Windows 8 brings a new app lifecycle model, in which Windows Store apps are automatically managed for the user. These apps always feel alive, even though they never run when they’re off the screen. This provides great benefits for power consumption and battery life.
Here are a few related blog posts we recommend for background reading on this topic:
- Building Windows 8 Blog: Building a power-smart general-purpose Windows (see “The Metro style application model” section)
- Building Windows 8 Blog: Improving power efficiency for applications (explains the different app states)
- Windows 8 app developer blog: Managing app lifecycle so your apps feel “always alive” (explains how to program for the different lifecycle states)
In this post, we’ll take a look at what this all means for debugging. Of all the debugging advances we made in Visual Studio 2012 (from JavaScript debugging, to the Windows 8 Simulator, to remote debugging on Windows RT devices), the debugging experience for Windows 8 lifecycle states and background tasks was one of the most challenging to design!
Simulating events
The first challenge we encountered in this process was how to simulate the events your app would encounter with real world usage, so that you could debug those interesting cases. How could we simulate your app being suspended because a text message was sent and caused another app to activate? How could we simulate your app being terminated, without ending your debugging session?
One principle that we used in designing the solution was that we wanted the model to be simple, so that you could use a core set of debugging commands to simulate the variety of lifecycle events that your app might experience. Therefore, we decided to add the following three commands to Visual Studio: Suspend, Resume and “Suspend and Shutdown”.
- Suspend: The Suspend command leaves the app in suspended state after it has handled the event.
- Resume: The Resume command resumes the app, and brings it back into a running state as the active app in the foreground.
- “Suspend and shutdown”: “Suspend and shutdown” first does a “Suspend”. Then (once the app is suspended), this command terminates the app and stops debugging.
You may wonder why we needed to create a “Suspend and shutdown” command. The goal of this command is to simulate the natural sequence of events that occur when your app is suspended and terminated by Windows 8. When an app gets suspended, it receives a suspending event, and the suspending event handler usually saves data the app may need when it is later activated (after going from suspended to terminated state). We observed users try to simulate this in other ways on the pre-release bits. For example, we saw some users just stop debugging, which would shut down the app, but there would be no suspending event triggered. Other users would explicitly close the app by pressing Alt+F4 or by dragging it to the bottom of the screen. In that case, a suspending event would be triggered before the app was terminated; however the next time the user activated the app, its PreviousExecutionState would be ClosedByUser (which is not what we’re trying to simulate). Therefore, the “Suspend and shutdown” command provides a way to simulate your app being suspended and terminated by Windows, as opposed to being explicitly closed by the user.
Exposing the commands
The next question we faced in the design process was how to expose these commands.
In the Visual Studio 2012 Beta release, we created dedicated buttons for these commands in the “Debug Location” toolbar. We chose this toolbar because it provides the unique ability to select a process during run mode. This makes it easy to determine which process to apply the commands to, when debugging multiple processes.
Starting in Visual Studio 2012 RC (and continuing for Visual Studio 2012 RTM), we collapsed these buttons into a dropdown list on the same “Debug Location” toolbar. The dropdown design provided more space for the multiple commands which we wanted to expose, without cluttering the toolbar:
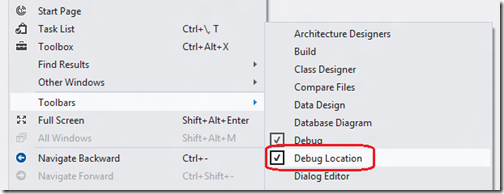
Please note that the “Debug Location” toolbar is not always enabled. Therefore, if you don’t see this toolbar, please enable it through the View menu:
App activation
Another case that we wanted to allow you to simulate in the debugger is app activation.
When you start debugging your Metro style app in Visual Studio, by default the app automatically gets activated. (This occurs in a very similar way to tile activation.)
However, there are also other ways your app can be activated, which you’ll want to simulate as well. For example, your app can receive some content shared from another app, and get activated through contract or extension. (See the Sharing content target app sample for more info on how this works.)
Starting in the beta release of Visual Studio 2012, we added the ability for you to change the project properties to not launch the app when you start debugging (in order to simulate these other activation scenarios). When you start debugging your project with this option set, Visual Studio 2012 goes into debug mode but nothing actually runs yet. You’ll also notice that the “Debug Location” toolbar shows your project name instead of a running process.
This indicates that the app package deployed by this project is in debug mode, and as soon as an app from that package gets activated, the debugger will attach to the process.
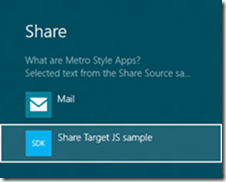
For example (as described in the Sharing content target app sample mentioned above), we can simulate sharing text from another app and selecting the sample app as the share target. In that case, the app gets activated and we can debug it:
Note that now the “Debug Location” toolbar shows the actual process that is running.
Debugging background tasks
There’s one more Windows 8 behavior that we wanted to allow you to simulate in the debugger, and that is background tasks. The idea behind background tasks is that your app may need to perform certain actions in the background, while the app is off-screen and not running. To learn how to program background tasks, please see the following post on the Windows 8 app developer blog: Being productive in the background – background tasks.
Background tasks get triggered by a system event such as a timer event. (Your app needs to run at least once to register the task.) Background tasks normally run in a system provided host (backgroundTaskHost.exe or wwahost.exe for JavaScript), however you can also provide your own executable for some background task triggers. Regardless of which process hosts the task, the background task runs as part of your package.
We designed the debugging experience for background tasks to utilize the same auto-attaching functionality as at runtime. That is, when your package is in debug mode, the debugger will automatically attach to the host process once it starts.
Given that you can debug apps from multiple packages at a time, we needed to present these in a control that had the ability to expand based on the number of tasks. Therefore, we added these to the same “Debug Location” toolbar dropdown control as shown above. As a result, the trigger commands of all background tasks registered for currently active packages will appear in this dropdown. As an example, when debugging the Background Task sample, you will see the following background tasks in the dropdown list (once registered).
Next, to debug a background task, add a break point to the Run method and trigger the background task:
And that’s how easy it is to debug your background task!
Please note that there are just a few exceptions to this design… Background tasks that have a data payload (for example, TriggerDetails in the IBackgroundTaskInstance) cannot be triggered through Visual Studio and must be triggered naturally by the system instead, in order to debug. Similarly, for the ControlChannel, PushNotification, and SmsReceived triggers. However, all other background task triggers can be triggered via Visual Studio.
Summary
The Windows 8 app lifecycle model presents some new debugging scenarios to consider, as you develop your Windows Store apps. Using Visual Studio 2012, you can simulate the events and states that your app will encounter, as it gets suspended and resumed. Visual Studio 2012 also provides a way to debug different app activation mechanisms, by putting the package in debug mode without activating the app. Finally, you can use the Debug Location toolbar dropdown to trigger background tasks. For more information on this topic, please reference the MSDN documentation. We look forward to hearing what you think on Connect, the Forums, or UserVoice!
Special thanks to Lisa Feigenbaum for contributing to this blog post.


0 comments