Summary: Learn how to use the debugging tools in the Windows PowerShell ISE to speed development of scripts.
Microsoft Scripting Guy, Ed Wilson, is here. Today I want to talk a little bit about using the Windows PowerShell ISE to debug a script. This is actually the third article this week in which I talk about using Windows PowerShell to debug scripts. In the first article, I talked about working at the Windows PowerShell console and using the Windows PowerShell debugger to help with debugging scripts. I discussed setting breakpoints on scripts by using the Set-PSBreakPoint cmdlet. Next, I talked about setting breakpoints on variables and examining the variables from inside the debugger. I also talked about specifying an action to take when a breakpoint is reached.
One thing to keep in mind when you are working with the debugger in the Windows PowerShell ISE, is that it is still the same Windows PowerShell debugger. For example, if I am working on a Windows PowerShell script, but I have not yet saved the script with a file name, I cannot set a breakpoint; this option is not available.
Once I have saved the script with a file name, I can select a line, and use the Toggle Breakpoint action from the Debug menu to set a breakpoint on the specific line. Once set, the line changes color. When I run the script and the breakpoint is hit, the script enters debugger mode. I can use the immediate window (the execution pane that is normally the bottom pane) to type commands for the debugger. The output pane (normally the middle pane) shows that the script is in debugger mode, and it displays the current output. I can use the normal debugger commands to step into, step over, list the call stack, or other actions that are detailed in the following table.
(Note: This table is copied from my Microsoft Press book, Windows PowerShell 2.0 Best Practices.)
|
Keyboard shortcut |
Command name |
Command meaning |
|
s |
Step-into |
Executes the next statement and then stops. |
|
v |
Step-over |
Executes the next statement, but skips functions and invocations. The skipped statements are executed, but not stepped through. |
|
o |
Step-out |
Steps out of the current function up one level if nested. If in the main body, it continues to the end or the next breakpoint. The skipped statements are executed, but not stepped through. |
|
c |
Continue |
Continues to run until the script is complete or until the next breakpoint is reached. The skipped statements are executed, but not stepped through. |
|
l |
List |
Displays the part of the script that is executing. By default, it displays the current line, five previous lines, and 10 subsequent lines. To continue listing the script, press ENTER. |
|
l <m> |
List |
Displays 16 lines of the script beginning with the line number specified by <m>. |
|
l <m> <n> |
List |
Displays <n> lines of the script, beginning with the line number specified by <m>. |
|
q |
Stop |
Stops executing the script, and exits the debugger. |
|
k |
Get-PsCallStack |
Displays the current call stack. |
|
<Enter> |
Repeat |
Repeats the last command if it was Step (s), Step-over (v), or List (l). Otherwise, represents a submit action. |
|
h or ? |
Help |
Displays the debugger command Help. |
One thing that is a bit annoying when debugging a script with the Windows PowerShell ISE is that debugging commands that are typed while in debug mode do not appear in the ISE output pane like they do when using the Windows PowerShell debugger in the Windows PowerShell console. If I query a variable, or set a value for a variable, those commands appear in the output pane, but commands from the previous table do not appear.
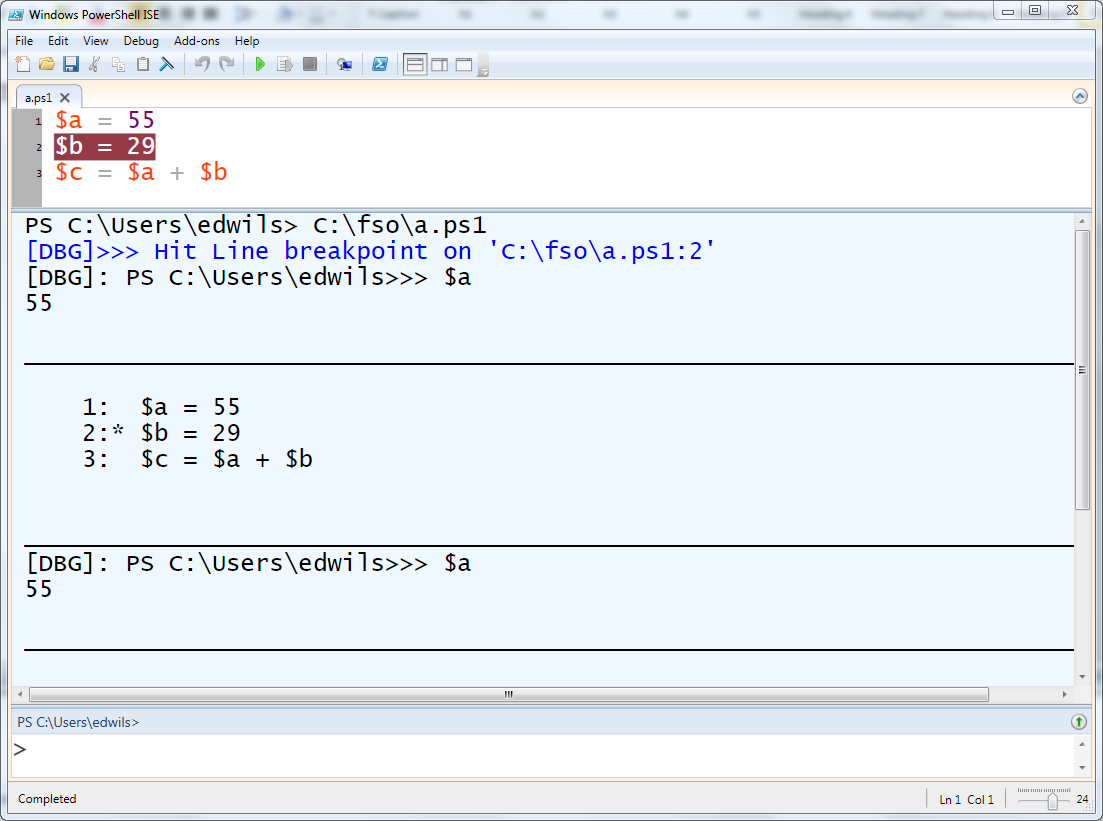
In the following image, I set a breakpoint for the second line of the script by using the Toggle Breakpoint command from the Debug menu. I then ran the script. It hit the breakpoint on the second line and entered debug mode. This is indicated in the output pane as [DBG]. Next, I used the l (L) command to list the lines from the script. The output from this command is visible, but there is no indication of the command that was typed. I then queried the value of the $a variable a second time, and both the command and output appeared. Finally, I used the o (O) command to step over the last line of code, and the script exited.
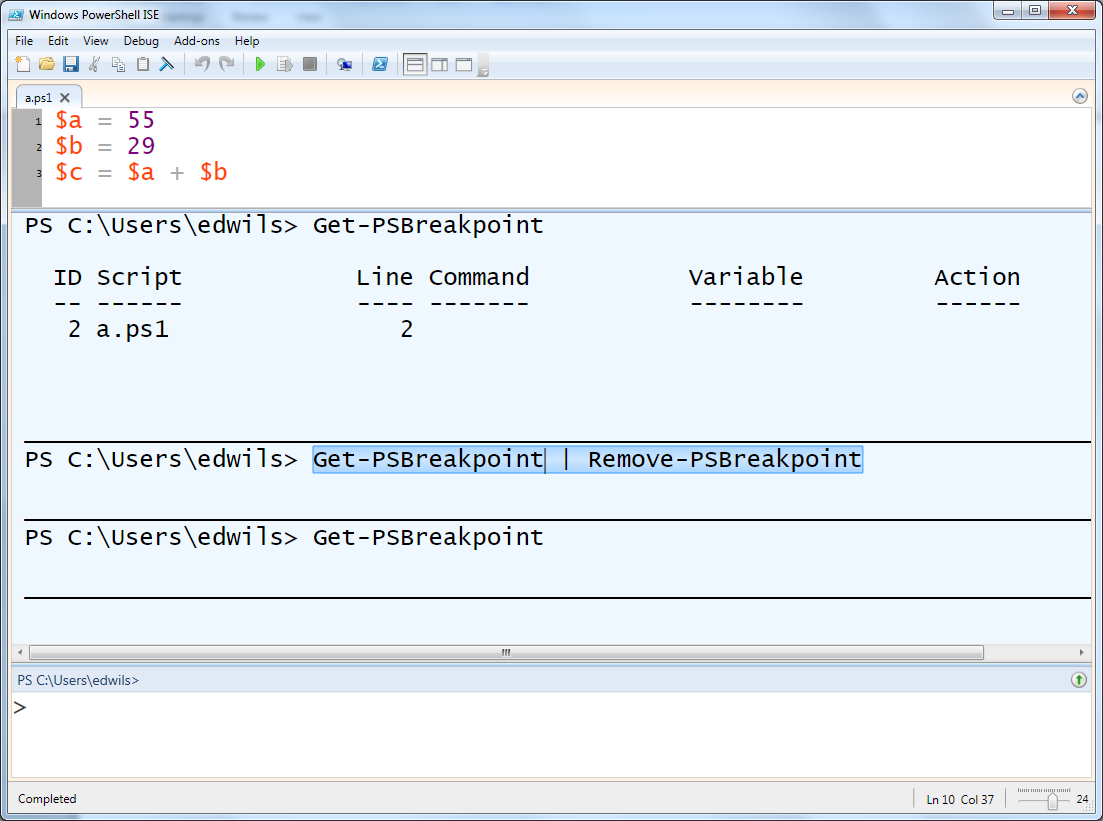
To remove all the breakpoints in a script, I can choose the Remove All Breakpoints command from the Debug menu. I can also use the Get-PSBreakpoint cmdlet to get all the breakpoints, and then use Remove-PSBreakpoint to remove the breakpoints, as shown here:
Get-PSBreakpoint | Remove-PSBreakpoint
These commands are shown in the following image.
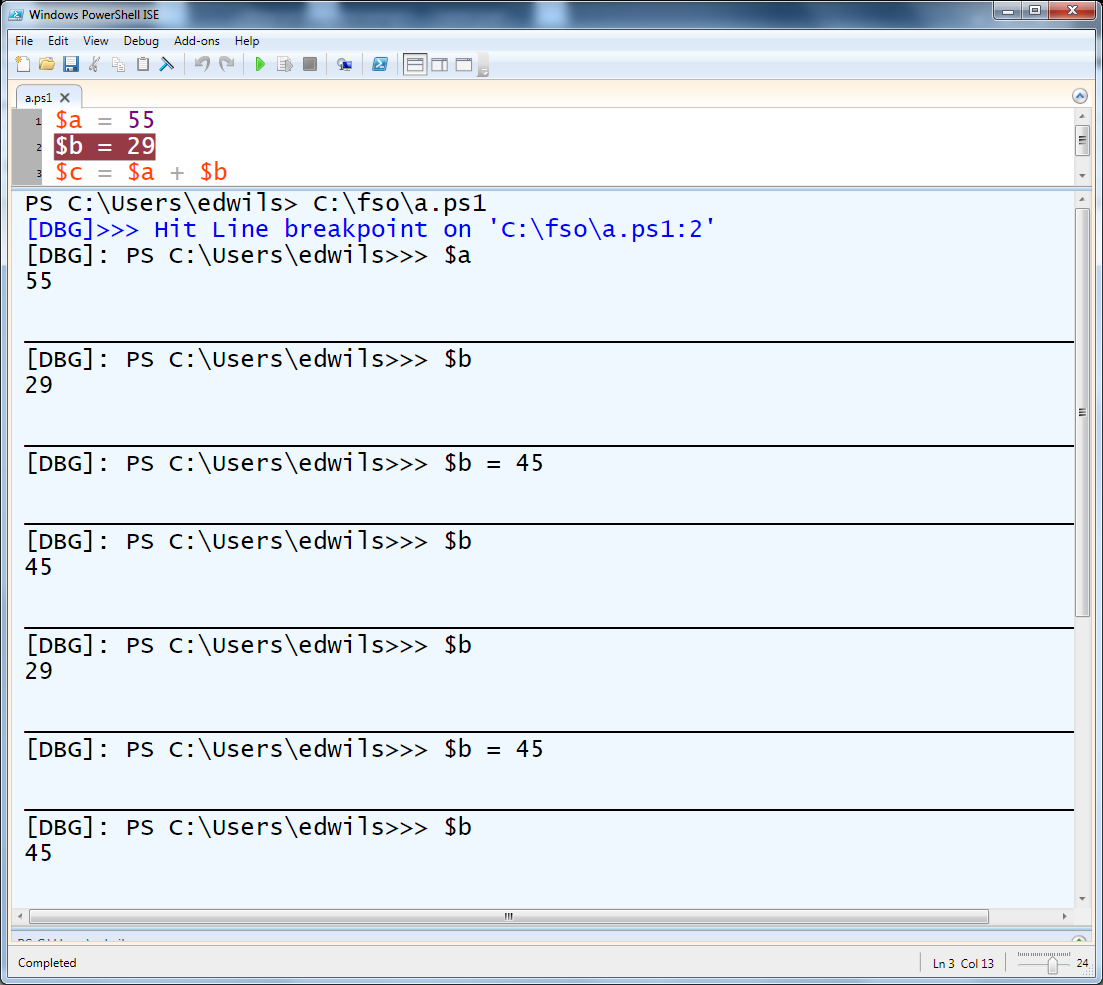
So, how is all this helpful? For one thing, I can use this to see what Windows PowerShell thinks is going to happen before it actually happens. I can also see what actually took place, just after it happened. In the following image, I am still using the single breakpoint. When the script breaks on line 2, it has not yet executed line 2. First, I check the value that is stored in $a. That value is 55, which according to the script, is correct. Next, I look to see what is stored in variable $b, and it reports back as 29. This should actually be null because the second line has not yet executed.
I figure out that the value comes from the previous time I ran the script. I then change the value of $b to 45. I query the $b variable, and sure enough, it is 45. I then type the s (S) command in the debugger, to step into the line and to actually execute the second line of code. I query the value of $b, and I see that it is now set back to 29. This proves that the debugger breaks before executing the line of code. I then set it back to 45, and query value of the variable, and I see that it is now set to 45. When the script finishes running, I check the value of $c, and see that it is 100 (however, this output is off screen in the following image).
From the Debug menu, I can only toggle a breakpoint on a line in the script. If I want to do something more sophisticated (such taking an action when a variable value is written to), I need to use the Set-PSBreakPoint cmdlet like I used in yesterday’s Hey! Scripting Guy Blog.
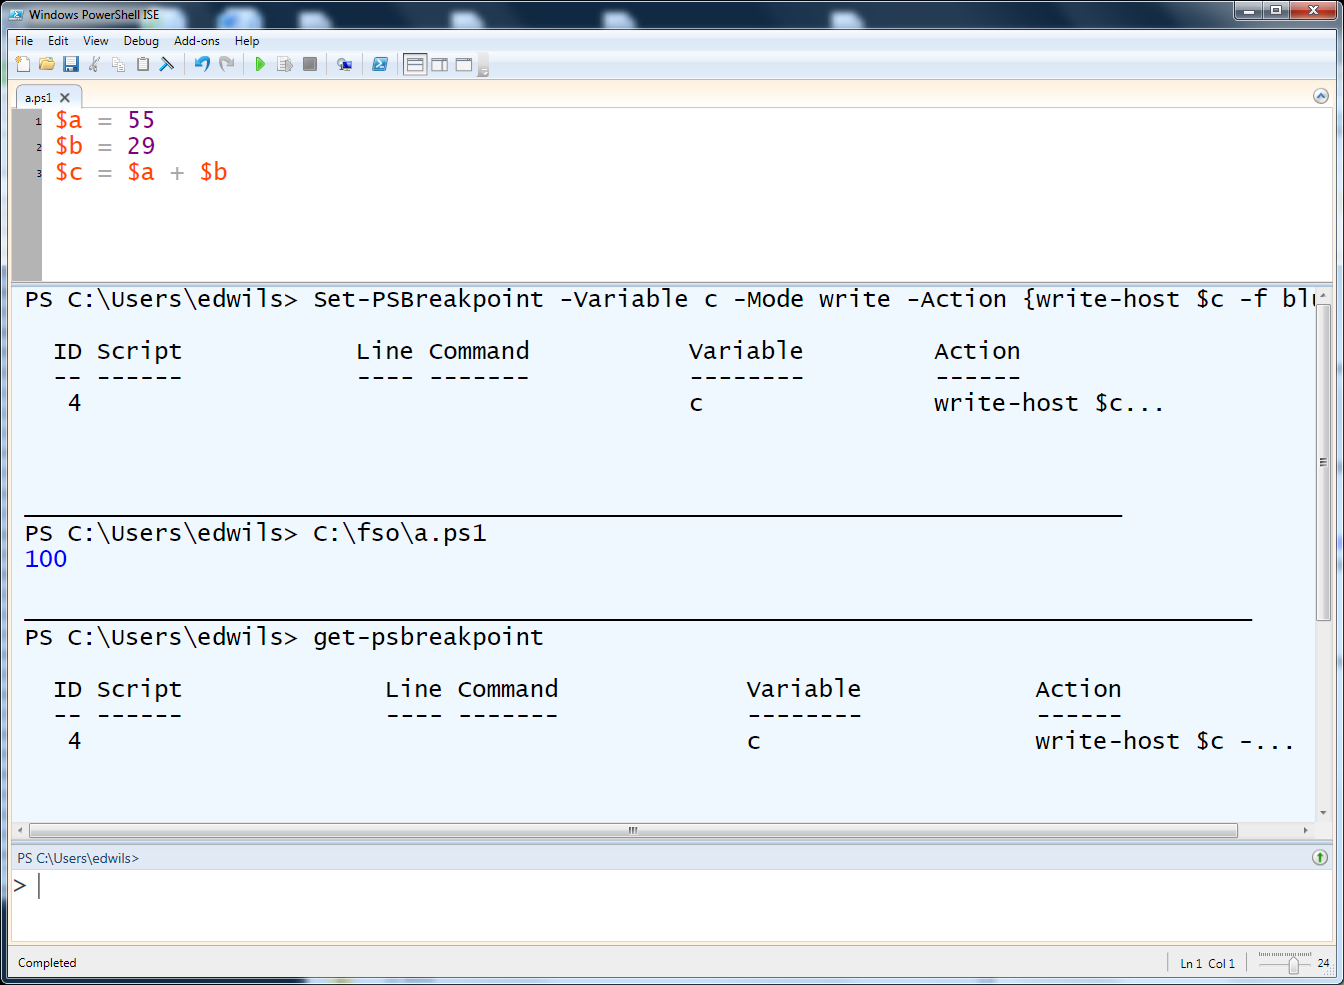
In the following image, I use the Set-PSBreakpoint cmdlet to write out the value of the variable $c to the console in blue, when the value of the $c variable is written to. Here is the Set-PSBreakPoint cmdlet command I use:
Set-PSBreakpoint -Variable c -Mode write -Action {write-host $c -f blue}
After I set the breakpoint, I run the script. When the breakpoint is reached, the action portion of the command executes, and the value contained in the $c variable is written to the output pane in blue. I then use the List Breakpoints command from the Debug menu (this is the same as typing the Get-PSBreakPoint command) to display all breakpoints. As seen in the following image, only one breakpoint is currently in effect.
As you can see, working with the debugger in the Windows PowerShell ISE is the same as working at the Windows PowerShell prompt. There is the Debug menu, but it ties back to the Windows PowerShell debugger itself. That is it for now.
Join me tomorrow when I will talk about more cool things to do with Windows PowerShell.
I invite you to follow me on Twitter and Facebook. If you have any questions, send email to me at scripter@microsoft.com, or post your questions on the Official Scripting Guys Forum. See you tomorrow. Until then, peace.
Ed Wilson, Microsoft Scripting Guy


0 comments