Summary: Microsoft Scripting Guy, Ed Wilson, talks about various ways to gather network statistics by using Windows PowerShell.
Microsoft Scripting Guy, Ed Wilson, is here. Hey, it is nearly the weekend! This means we are one week closer to Windows PowerShell Saturday #007…
PowerShell Saturday #007 will be held in Charlotte, North Carolina on February 8, 2014. This will be an awesome chance to meet and to learn from some of the best PowerShellers around. In fact, five of the speakers are also speakers at the PowerShell Summit this year. There are a limited number of tickets still available for this event, so you’ll want to sign up now. The Scripting Wife wrote a great post that provides a quick overview of the event: Psst…Charlotte PowerShell Saturday Details Leaked.
Note Today I am concluding my series about working with network adapters.
You may want to refer to the earlier posts to catch up on the series:
- Use PowerShell to Identify Network Adapter Characteristics
- Enabling and Disabling Network Adapters with PowerShell
- Renaming Network Adapters by Using PowerShell
- Using PowerShell to Find Connected Network Adapters
- Working with Network Adapter Power Settings
One of the cool things about the Windows platform is all the ways that are possible to obtain networking statistical information. There are NetStat, Netsh, performance counters, and the Get-NetworkStatistics function from the NetAdapter Windows PowerShell module. All of these methods can be used inside the Windows PowerShell console or from within the Windows PowerShell ISE.
Netsh
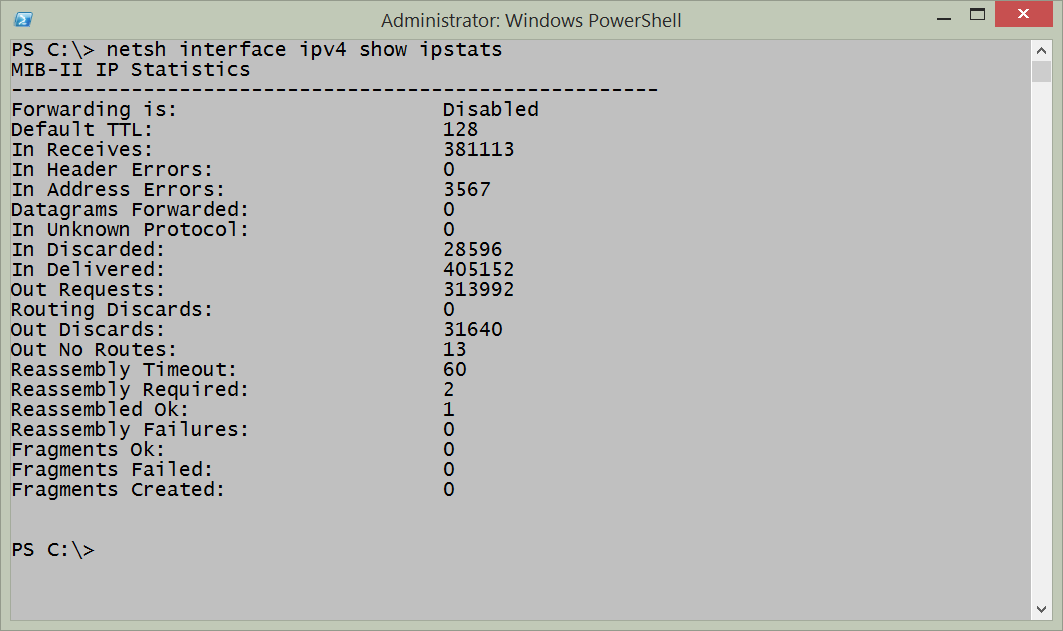
Using Netsh to obtain network statistics is easy and powerful. For example, to show IP statistics, I use the following command:
netsh interface ipv4 show ipstats
A sample output from this command is shown in the image that follows:
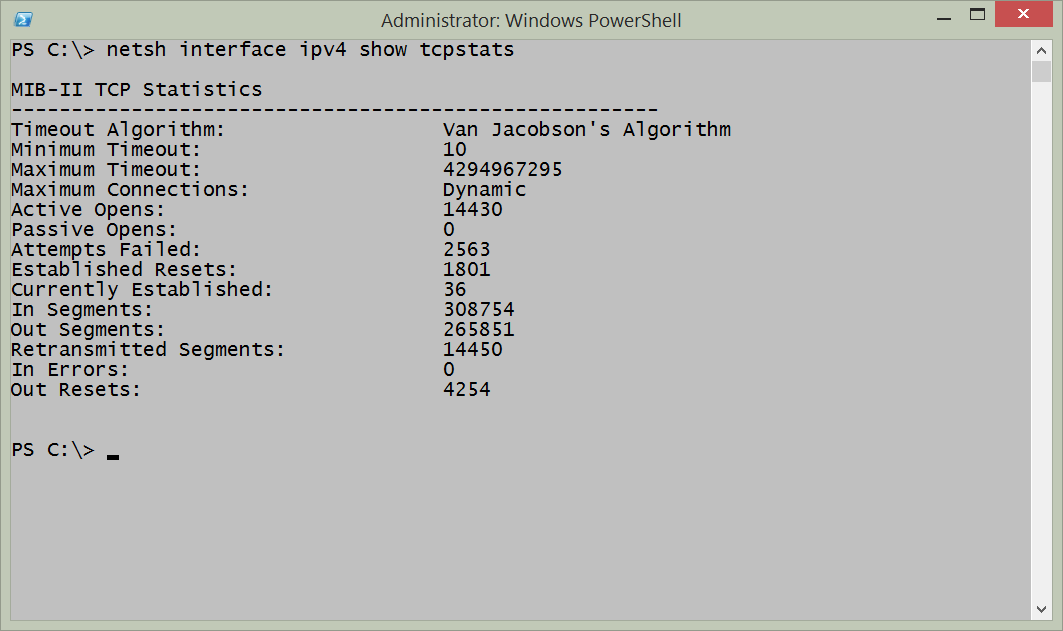
To use Netsh to show TCP statistics, I use the command shown here:
netsh interface ipv4 show tcpstats
The command and the output from the command are shown here:
One of the cool things about using Netsh from within Windows PowerShell is that I have the power of Windows PowerShell at my fingertips. Rather than going back and forth to find stuff, I can pipe the results from a command to the Select-String cmdlet.
For example, if I am interested in how many commands are available to show statistics, I use the following command because I noticed that each of the commands contains the letters stats:
netsh interface ipv4 show | Select-String "stats"
The output from the command is shown here:
PS C:\> netsh interface ipv4 show | Select-String "stats"
show icmpstats – Displays ICMP statistics.
show ipstats – Displays IP statistics.
show tcpstats – Displays TCP statistics.
show udpstats – Displays UDP statistics.
In addition to the IPV4 interface, I can also work with the IPV6 interface and obtain similar statistics. Here is the command that I used to obtain that information:
PS C:\> netsh interface ipv6 show | Select-String "stats"
show ipstats – Displays IP statistics.
show tcpstats – Displays TCP statistics.
show udpstats – Displays UDP statistics.
In addition to using the Select-String cmdlet to parse the output from the Netsh Help, I can use it to hone in on specific information from the statistics. For example, the following command retrieves IPv6 interface IP stats:
netsh interface ipv6 show ipstats
I can hone in on the output and look for errors by piping the results to the Select-String cmdlet and choosing errors. This command is shown here.
netsh interface ipv6 show ipstats | Select-String errors
In the image that follows, I first show the command to retrieve the IPV6 IP statistics. Next I show the output from the command. Then I filter the output to only errors by using the Select-String cmdlet. Lastly, I show the output from the filtered string.
NetStat
The NetStat command has been in the Windows world for a long time. It provides a quick snapshot of connections from local ports to remote ports in addition to the protocol and the state of those connections.
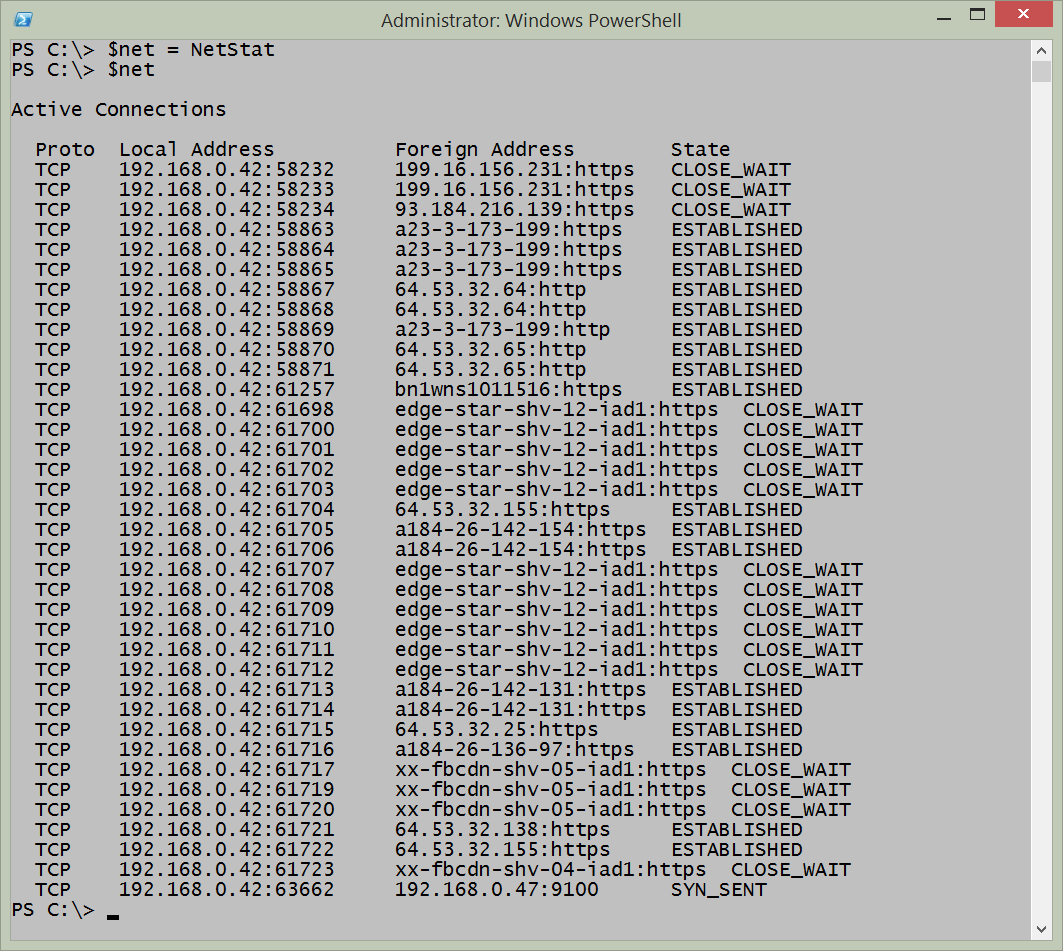
It takes a couple of minutes to run, and as a result, it makes sense to store the results of NetStat into a variable. I can then examine the information several times if I want to without having to wait to gather the information additional times. Here is an example of running the NetStat command and storing the results in a variable:
$net = NetStat
To display the information in an unfiltered fashion, I simply type $net at the Windows PowerShell prompt, and it displays all of the information that it gathered:
$net
The command to run NetStat, store the results in a variable, and examine the contents of the $net variable are shown in the following image:
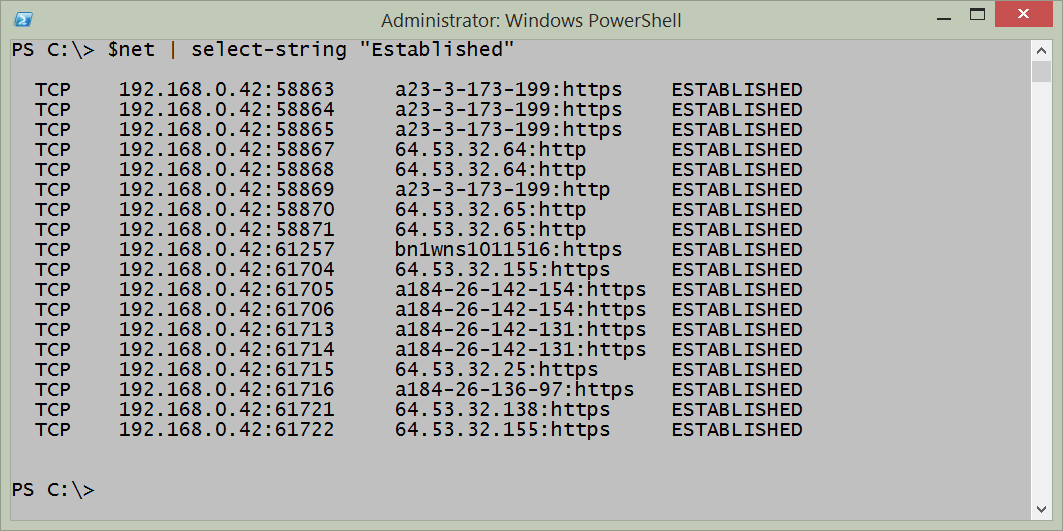
The real power, however, comes in using Windows PowerShell to parse the text output to find specific information. For example, the previous output shows multiple connections in various connected states. I can easily parse the output and find only the connections that are Established. The command I use is:
$net | select-string "Established"
The command and the output from the command are shown in the following image:
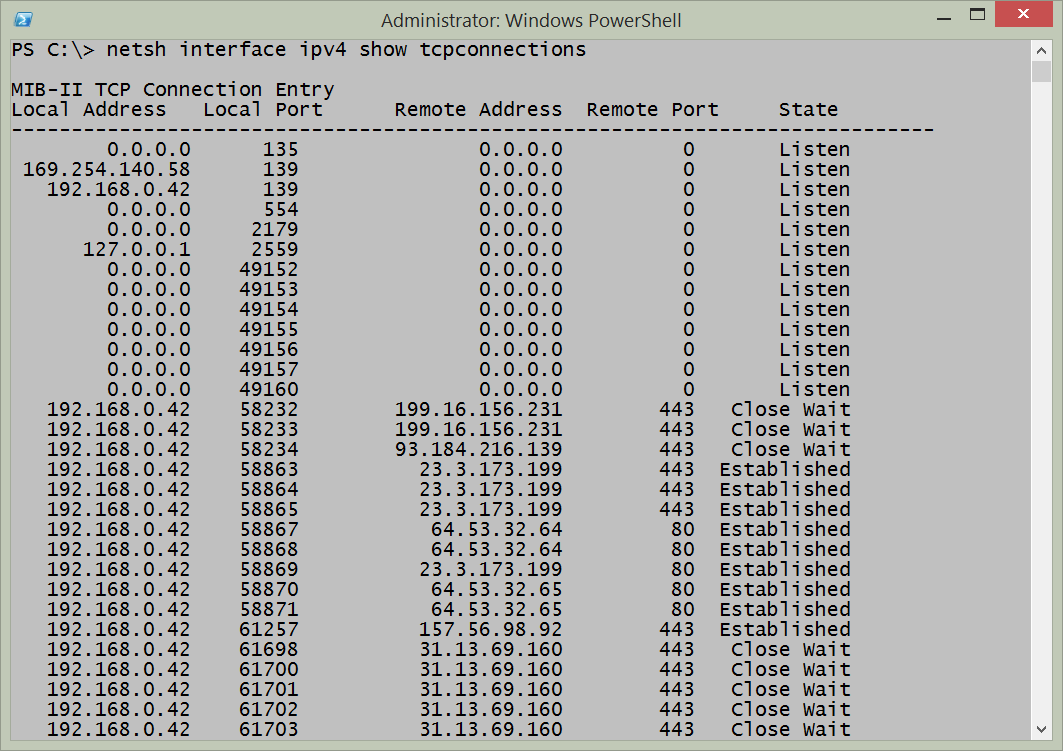
Interestingly enough, I can also use Netsh to report on TCP connections. The command is shown here:
netsh interface ipv4 show tcpconnections
The output from the command, as shown in the image that follows, is a bit different than that received from NetStat:
Performance counters
To easily collect performance counter information, I need to know the performance counter set names. To do this, I use the Get-Counter cmdlet, and I choose all of the ListSets. I then like to sort on the CounterSetName property, and then select only that property. The following command retrieves the available list sets:
Get-Counter -ListSet * |
Sort-Object CounterSetName |
Select-Object CounterSetName
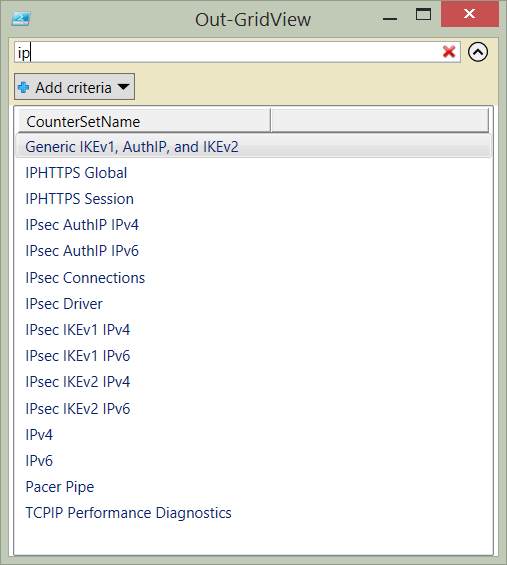
If I pipe the output to the Out-GridView cmdlet, I can easily filter the list to find the list sets I want to use. This command is shown here:
Get-Counter -ListSet * |
Sort-Object CounterSetName |
Select-Object CounterSetName |
Out-GridView
The resulting Out-GridView pane makes it easy to filter for different values. For example, the image that follows filters for IP:
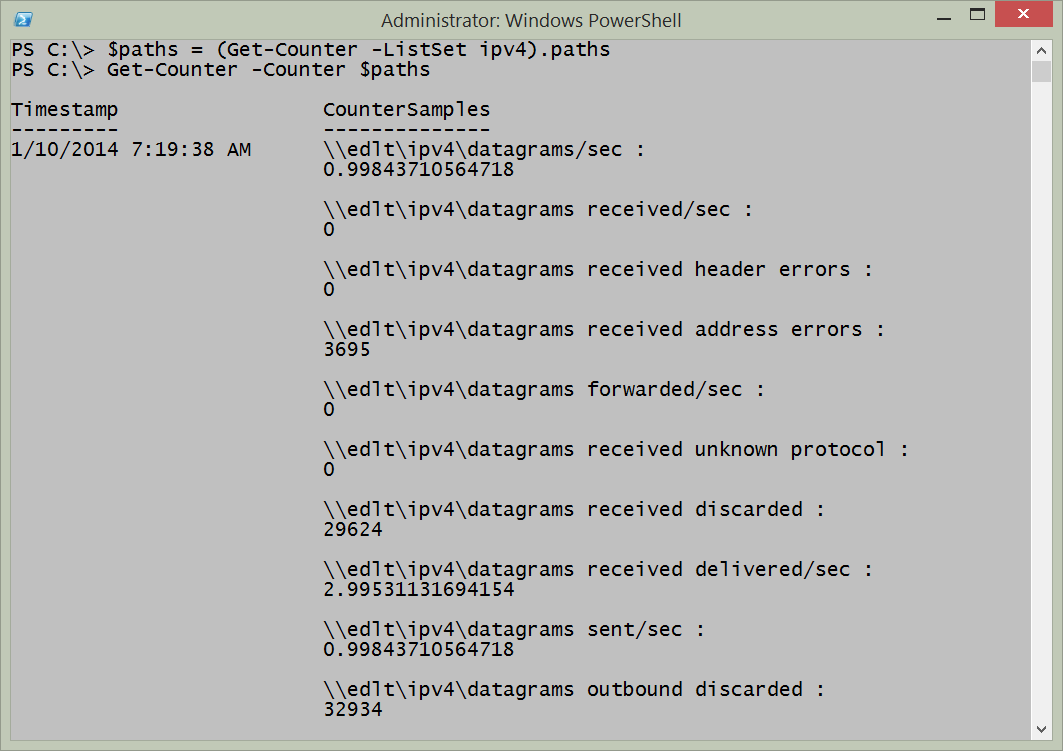
When I have the CounterSetName value that want to query, it is a simple matter of plugging it into Get-Counter to first obtain the paths, as shown here:
$paths = (Get-Counter -ListSet ipv4).paths
Next, I use the paths with the Get-Counter cmdlet to retrieve a single instance of the IPv4 performance information:
Get-Counter -Counter $paths
The commands and the output from the commands are shown in the following image:
If I want to monitor a counter set for a period of time, I use the –SampleInterval property and the –MaxSamples parameter. In this way, I can specify how long I want the counter collection to run. An example of this technique is shown here:
Get-Counter -Counter $paths -SampleInterval 60 -MaxSamples 60
If I want to monitor continuously, until I type Ctrl+C to break the command, I use the –Continuous parameter and the –SampleInterval parameter. An example of this command is shown here:
Get-Counter -Counter $paths -SampleInterval 30 -Continuous
Using Get-NetAdapterStatistics
The easiest way to gather network adapter statistics is to use the Get-NetAdapterStatistics function from the NetAdapter module. It provides a quick overview of the sent and received packets. An example of the command is shown here:
Get-NetAdapterStatistics
The command and a sample output are shown in the image that follows:
If I want to work with a specific network adapter, I can use the name of the adapter; or for more flexibility, I can pipe the results from the Get-NetAdapter function. This technique is shown here:
Get-NetAdapter -ifIndex 12 | Get-NetAdapterStatistics
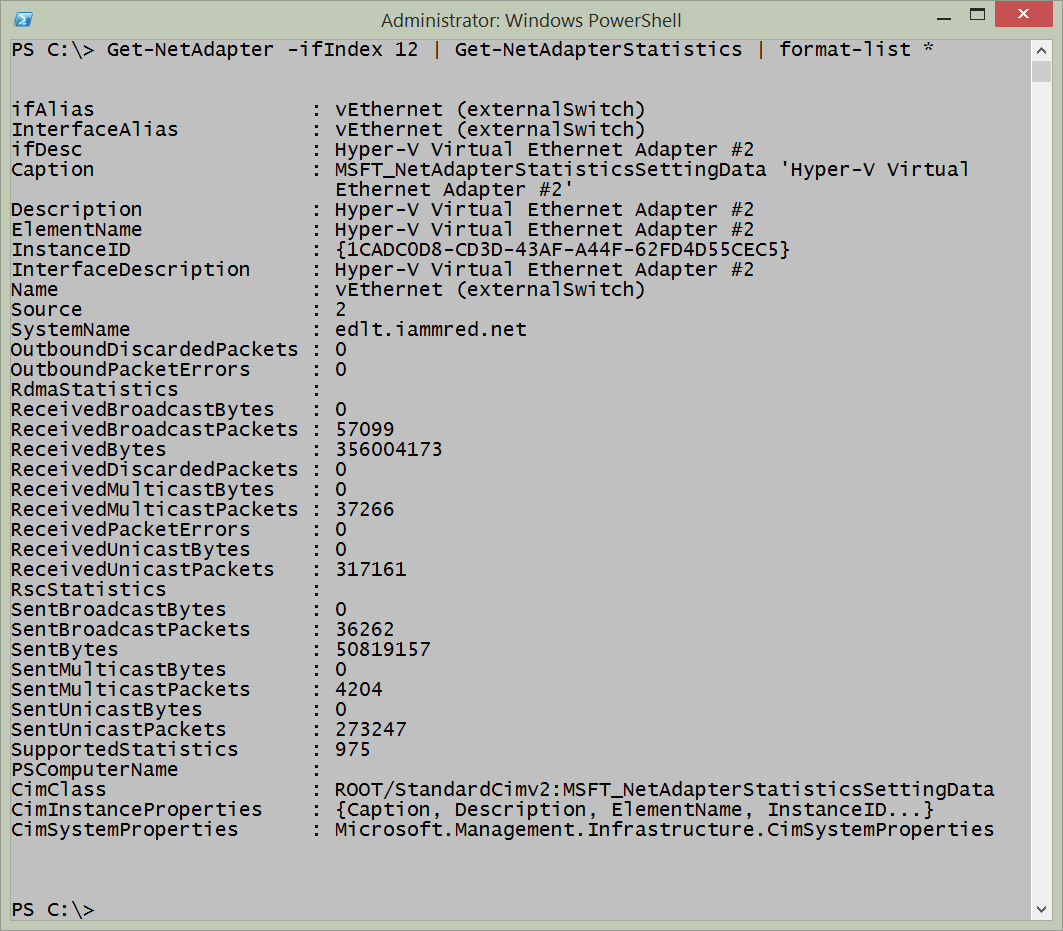
The Get-NetAdapterStatistics function returns more than only the bytes sent and received. To find the additional information, I like to pipe the results to the Format-List cmdlet. An example of this technique is shown here:
Get-NetAdapter -ifIndex 12 | Get-NetAdapterStatistics | format-list *
The command,and the output associated with the command are shown in the following image:
This concludes Network Adapter Week. Join me tomorrow when I will talk about mobile devices, Active Sync, and Exchange. It is cool stuff that you do not want to miss.
I invite you to follow me on Twitter and Facebook. If you have any questions, send email to me at scripter@microsoft.com, or post your questions on the Official Scripting Guys Forum. See you tomorrow. Until then, peace.
Ed Wilson, Microsoft Scripting Guy



0 comments