

Welcome to Part 2 of the series about how to debug PowerShell in Visual Studio Code. In Part 1, we looked at the debugging features of Visual Studio Code with the PowerShell extension installed. Now we will examine the various ways that you can start to debug PowerShell script with Visual Studio Code.
Single file debugging
With the 1.9 release of Visual Studio Code, you can now debug a PowerShell script with no debugger configuration required and no need to open a workspace. That is, you can open a single PowerShell file instead of a folder and still debug it.
In the following example, I open a single script file, set a breakpoint, and press F5. Debugging a PowerShell script is that simple in Visual Studio Code 1.9!
Note: The following image is animated. If you don’t see the animation, click the image to start the animation.
When you open a file, Visual Studio operates in “no-folder workspace” mode as indicated by the purple status bar. When you open a folder, you are in a regular workspace, and the status bar will be blue.
Workspace debugging
Workspace debugging occurs when you start a debug session after you have opened a folder via Open Folder… from the File menu. When you open a folder, Visual Studio Code designates that folder as the workspace root. Typically, you open a folder that is the root of your Git repository and/or project folder.
Visual Studio Code stores debugger launch configurations, like the other configuration and settings files that we’ve encountered so far, in another JSON that‘s stored under the .vscode directory. The name of the JSON file that stores debugger launch configurations is launch.json. If the workspace is controlled by a software configuration management tool such as Git, you will typically want to add the config files that are under .vscode to source control.
You may be wondering why you should bother with this launch.json file if you can debug without it. It turns out that having a launch configuration file can be quite handy because it allows you to:
- Create a launch configuration that always starts a specific script with the specified arguments.
- Create a launch configuration to launch whichever file is in the active editor window (like in ISE).
- Create a launch configuration to attach to the interactive session, that is, Debug Console.
- Create and select from multiple launch configurations.
Let’s look at an example of creating the PowerShell launch configurations for the debugger. Select Open Folder… from the File menu to open a folder that contains one or more of your PowerShell scripts. Open the Debug view, and you will note that the Launch Configuration dropdown indicates that there are “No Configurations” as shown in the following screenshot:
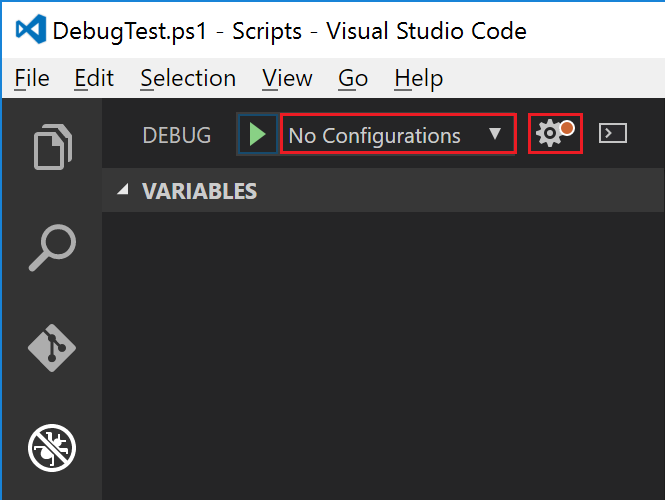
Now click the gear icon that’s highlighted in the previous screenshot next to the dropdown. You will be see a list of available debuggers:

Your list may differ depending on the extensions that you have installed. Select PowerShell from the list. That will create the .vscode\launch.json file. This whole process is shown in the following screenshot:
Note: The following image is animated. If you don’t see the animation, click the image to start the animation.

By default, the PowerShell extension initially configures your launch.json file with the three launch configurations that are in the following screenshot:

These launch configuration support the following debug scenarios:
- PowerShell Launch (current file) – This is what we have been using. It launches the file in the active editor window under the debugger. This is how the PowerShell integrated scripting environment (ISE) debugger works.
- PowerShell Attach to Host Process – This allows you to attach to another process that hosts the PowerShell engine and debug script that’s running in that process.
- PowerShell Interactive Session – This attaches the debugger to the Debug Console session. This can be handy for importing your module and debugging it from the Debug Console prompt. This configuration can also be handy if you want to use the
Set-PSBreakpointcommand to set variable breakpoints, that is, when a variable is read or written. Setting this type of breakpoint is currently not supported by Visual Studio Code.
There is a fourth configuration that is not added by default:
- PowerShell Script Configuration – Launches the file that’s specified in the configuration by using a path relative to the
${workspaceRoot}configuration variable.
Let’s add this fourth launch configuration to the launch.json file that we previously created. Click the Add Configuration button in the lower-right area of the editor window for launch.json. You will see the following list. Your list may differ depending on the extensions that you have installed.

Select PowerShell: Launch Script Configuration from the list. By the way, one consequence of having this “Add Configuration” feature is that you may have a C# project configured to use the .NET Core debugger, yet you have a few PowerShell scripts in the project. You can debug those PowerShell scripts from the C# project by adding a PowerShell launch configuration to the C# project’s launch.json file.
The following animated GIF shows the whole process of adding a launch configuration that launches the PowerShell extension’s Examples\DebugTest.ps1 file with arguments:
Note: The following image is animated. If you don’t see the animation, click the image to start the animation.
As you can see, when you select the “Launch PowerShell (DebugTest.ps1)” launch configuration, starting the debugger will always start the DebugTest.ps1 file under the debugger with the specified arguments.
Launch configuration settings / variables
Most settings in the PowerShell launch configuration are pretty self-explanatory.
scriptis the path to the script to execute.cwdis the current working directory that should be set for the debug session.argsis an array of arguments to pass to the script being debugged.
However, it usually works best to put all the arguments in a single string, for example:
{
"type": "PowerShell",
"request": "launch",
"name": "PowerShell Launch (MyScript.ps1)",
"script": "${workspaceRoot}/MyScript.ps1",
"args": [ "-Count 42 -DelayMillseconds 2000" ],
"cwd": "${workspaceRoot}"
},
Besides ${workspaceRoot} and ${file}, the following variables are available for you to use in launch.json:
${workspaceRoot}: the path of the folder opened in Visual Studio Code${workspaceRootFolderName}: the name of the folder opened in Visual Studio Code without any solidus (/)${file}: the current opened file${relativeFile}: the current opened file relative to workspaceRoot${fileBasename}: the current opened file’s basename${fileBasenameNoExtension}: the current opened file’s basename with no file extension${fileDirname}: the current opened file’s dirname${fileExtname}: the current opened file’s extension${cwd}: the task runner’s current working directory on startup
You can also reference environment variables like ${env.USERPROFILE}.
Note: the env must be all lowercase and be careful to use env. instead of a env:. This is Visual Studio Code’s syntax, not PowerShell syntax.
PowerShell interactive session debugging
If you select the PowerShell Interactive Session launch configuration and start debugging, the debugger attaches to Visual Studio Code’s Debug Console, but it doesn’t run any script. In a future update to the PowerShell extension, the plan is to use a dedicated interactive console that runs as one of your terminal windows.
How is debugging an interactive session useful? Well, you might want to debug one of your module’s commands while using it from the console. Or you might want to debug in a remote session.
To do a debug a module command, select the PowerShell Interactive Session launch configuration, and press F5 to start debugging. In the Debug Console, execute the Import-Module command to import your module. Then, execute the module command that you want to debug. Of course, make sure that you’ve set a breakpoint in the appropriate place so that you can break into the debugger at the desired point of execution within the command. This process is illustrated in the following screenshot:
Note: The following image is animated. If you don’t see the animation, click the image to start the animation.
For remote session debugging, you also start debugging with the PowerShell Interactive Session launch configuration. After the debug session has started, type Enter-PSSession <hostname> to create a session on the remote computer. After connection, you can use psedit to open the remote script in Visual Studio Code where you can set breakpoints and step through the script. This process is shown in the following screenshot:
Note: The following image is animated. If you don’t see the animation, click the image to start the animation.
PowerShell attach to host process
With “attach to” support, you can attach the PowerShell debugger to another PowerShell host process. Where I’ve found this particularly useful is debugging PowerShell tab expansion script.
In this scenario, I need to the debug posh-git’s GitTabExpansionInternal method. I set a line breakpoint in this function, and then select the PowerShell Attach to Host Process launch configuration. When I start debugging, I see a selection list for PowerShell host processes that can be attached to:

Note that this list displays the process ID (PID) and the host’s main window title bar text. I’ve updated my prompt function to display the current PowerShell process’s PID in the title bar. This makes it easier to know which PowerShell console process I want to attach to. After you select a process, the debugger starts.
Now I can attempt tab completion of git commands like git push or<tab>, and the debugger will break on my breakpoint. This whole scenario is demonstrated in the following screenshot:
Note: The following image is animated. If you don’t see the animation, click the image to start the animation.
In this blog post, we looked at the debugging features of Visual Studio Code and the PowerShell extension. We also looked at how to configure the debugger to launch your scripts under the debugger, how to interactively debug local and remote scripts, and how to attach to PowerShell host processes.
I think you’ll find the PowerShell debugging experience in Visual Studio Code to be quite productive. Of course, if you do find a bug, please be sure to submit an issue at https://github.com/PowerShell/vscode-powershell/issues so we can continue to improve the debug experience for everyone.
Keith Hill Software Engineer PowerShell MVP
Hello,Read more
Thanks for this article, very userfull for me!! :)
I'm a little late to the party, but I have a question about powershell debugging in VS.
I'm currently writing a PS Module for my company. I'd like to use the automation of the debugger to launch one function from the module automatically with the parameters setup. All my functions are currently in the psm1 file (and I don't really plan to change that, there is not enough functions to separate in multiple files)I want to launch one of them (which happens to be the first one of the psm1 file).