Summary: Learn how to use Windows PowerShell to capture performance counter information and write the saved data to a SQL Server database.
![]() Hey, Scripting Guy! I have been enjoying your PoshMon articles this week, but I have found them to be of limited value. I would love to see how I could store this performance data in a SQL database. I could then use SQL Reporting Services to parse the data and create reports.
Hey, Scripting Guy! I have been enjoying your PoshMon articles this week, but I have found them to be of limited value. I would love to see how I could store this performance data in a SQL database. I could then use SQL Reporting Services to parse the data and create reports.
—RS
![]() Hello RS,
Hello RS,
Microsoft Scripting Guy Ed Wilson here. I am in the middle of a two-week road trip. The engagement with the Central Ohio Windows PowerShell Users group was great, and so was SQLSaturday in Wheeling, West Virginia. I had never been to Wheeling—it is actually a pretty cool place and is relatively near both Columbus, Ohio, and Pittsburgh, Pennsylvania. Now I am in Seattle, Washington, for the internal-to-Microsoft TechReady conference, and it has been a great experience. I have gotten to see many of my friends from other locations, so it has been like a reunion in one respect. I have also learned a lot both in terms of perceived customer needs and technical aspects.
RS, I am going to use the technique from yesterday’s blog post wherein I automatically glean the performance counters from a binary performance trace file. The reason for doing this is that it greatly simplifies the task of specifying the performance counters. For that post, I carefully selected a nice collection of counters by using the graphical selector tool in the Performance Monitor tool, and I do not want to repeat that task. The original code is shown here:
$counters = Import-Counter -Path “C:\Users\edwils\Desktop\HSG-New\System Monitor Log.blg”
$paths = $counters[0].countersamples | % {$_.path}
Get-Counter -Counter $paths
For a more permanent solution, it would be trivial to export the counter paths to a text file. You could then use the Get-Content cmdlet to read the text file and populate the $counterPath variable when needed. This would save needing to parse the .blg file on a repetitive basis. The code to do this is shown here:
$paths | Out-File -FilePath c:\fso\ExportPaths.txt -Encoding ascii -Append
In fact, I like the idea of writing the counters to a data file. I decided to modify the original code to use the Tee-Object to send the output to both a variable and a text file at the same time. This is not something that Tee-Object is normally used for, but because Tee-Object will output to the screen if it is the last command in the pipeline, I save the output to a variable. This gives me both a file and a variable at the same time. The code to write to both a variable and a file is shown here (the % symbol is an alias for the ForEach-Object cmdlet):
$paths = $counters[0].countersamples | % {$_.path} | Tee-Object -FilePath c:\fso\testpaths.txt
The advantage of using Tee-Object is the code is still three lines long, but I now get both the variable populated and the text file created all at once. The modified code is shown here:
$counters = Import-Counter -Path “C:\Users\edwils\Desktop\HSG-New\System Monitor Log.blg”
$paths = $counters[0].countersamples | % {$_.path} | Tee-Object -FilePath c:\fso\counterpaths.txt
Get-Counter -Counter $paths
The text file that contains the counter paths is shown here.
After I have my counters in a text file, I can use the Get-Content cmdlet to read the counter text file for the counter paths. I specify 20 samples and a sample interval of 6 seconds. This will give me 20 readings over a two-minute period. When I have completed gathering my data, I use the Export-Counter cmdlet to export my performance data to a CSV file. It is much better to use this cmdlet than to attempt manually creating the CSV data.
These four lines of code are really two logical lines of code. I use the line continuation character at the end of the first and third lines to break the code to the next lines to make the code easier to read on the blog. The code to read counter paths from a text file, pass the paths to the Get-Counter cmdlet to retrieve 20 samples at 6-second intervals, store the results in a variable, and export the data to a CSV file is shown here:
$counterData = Get-Counter -Counter (Get-Content C:\fso\counterPaths.txt) `
-MaxSamples 20 -SampleInterval 6
Export-Counter -Path c:\fso\counterData.csv -FileFormat csv `
-InputObject $counterData
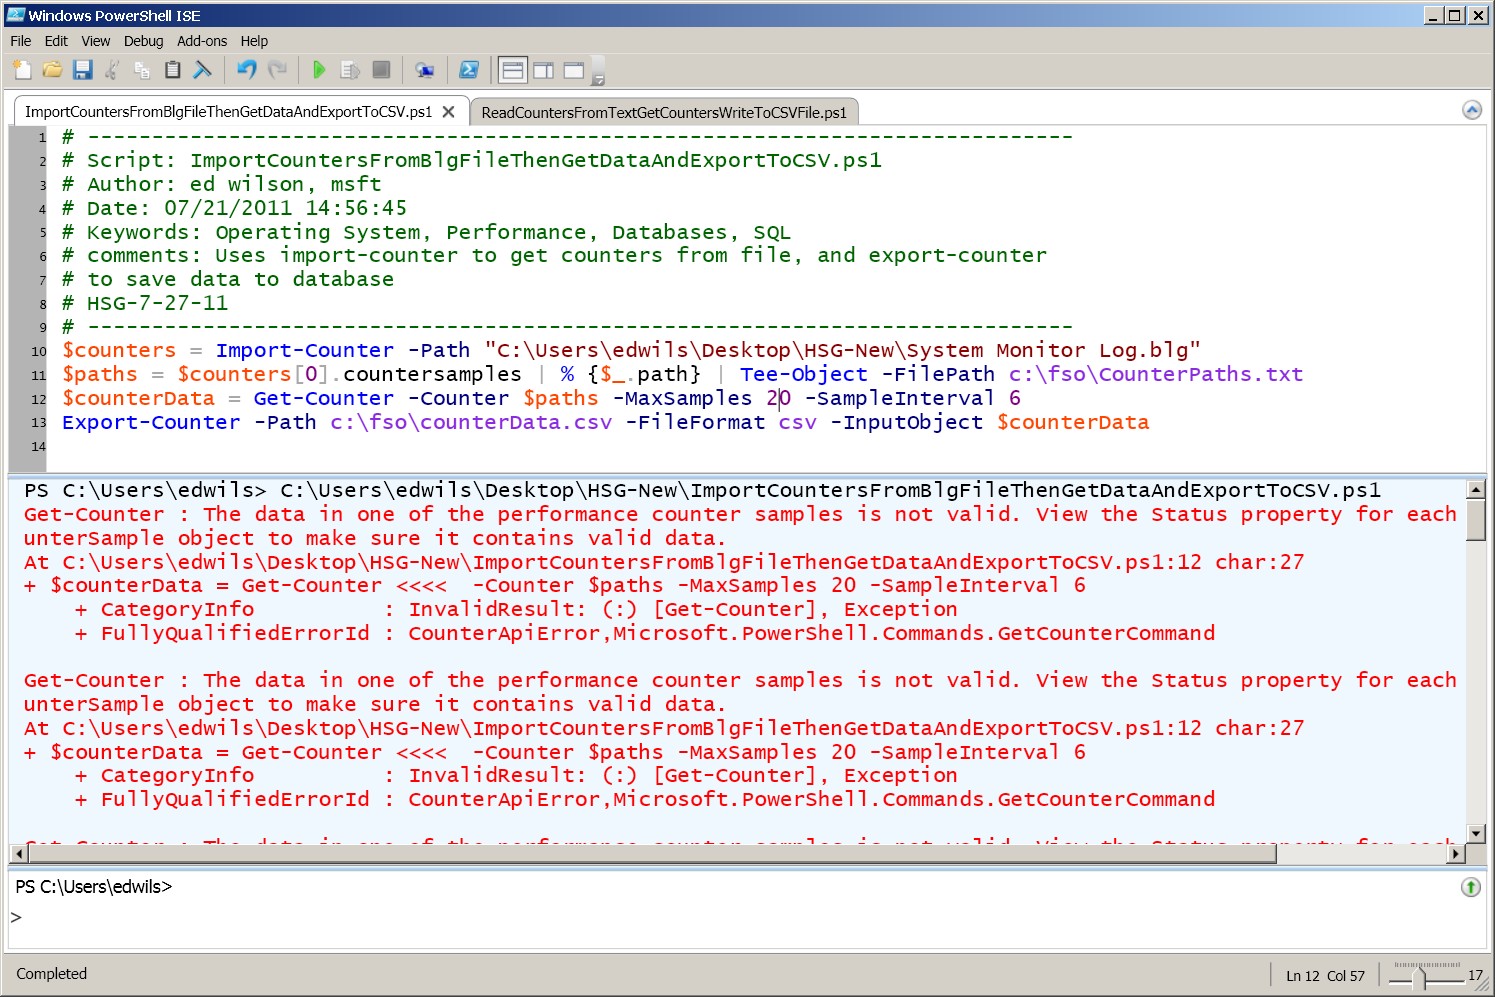
The script and associated output (there is no output) are shown here in a screen shot of the Windows PowerShell ISE.
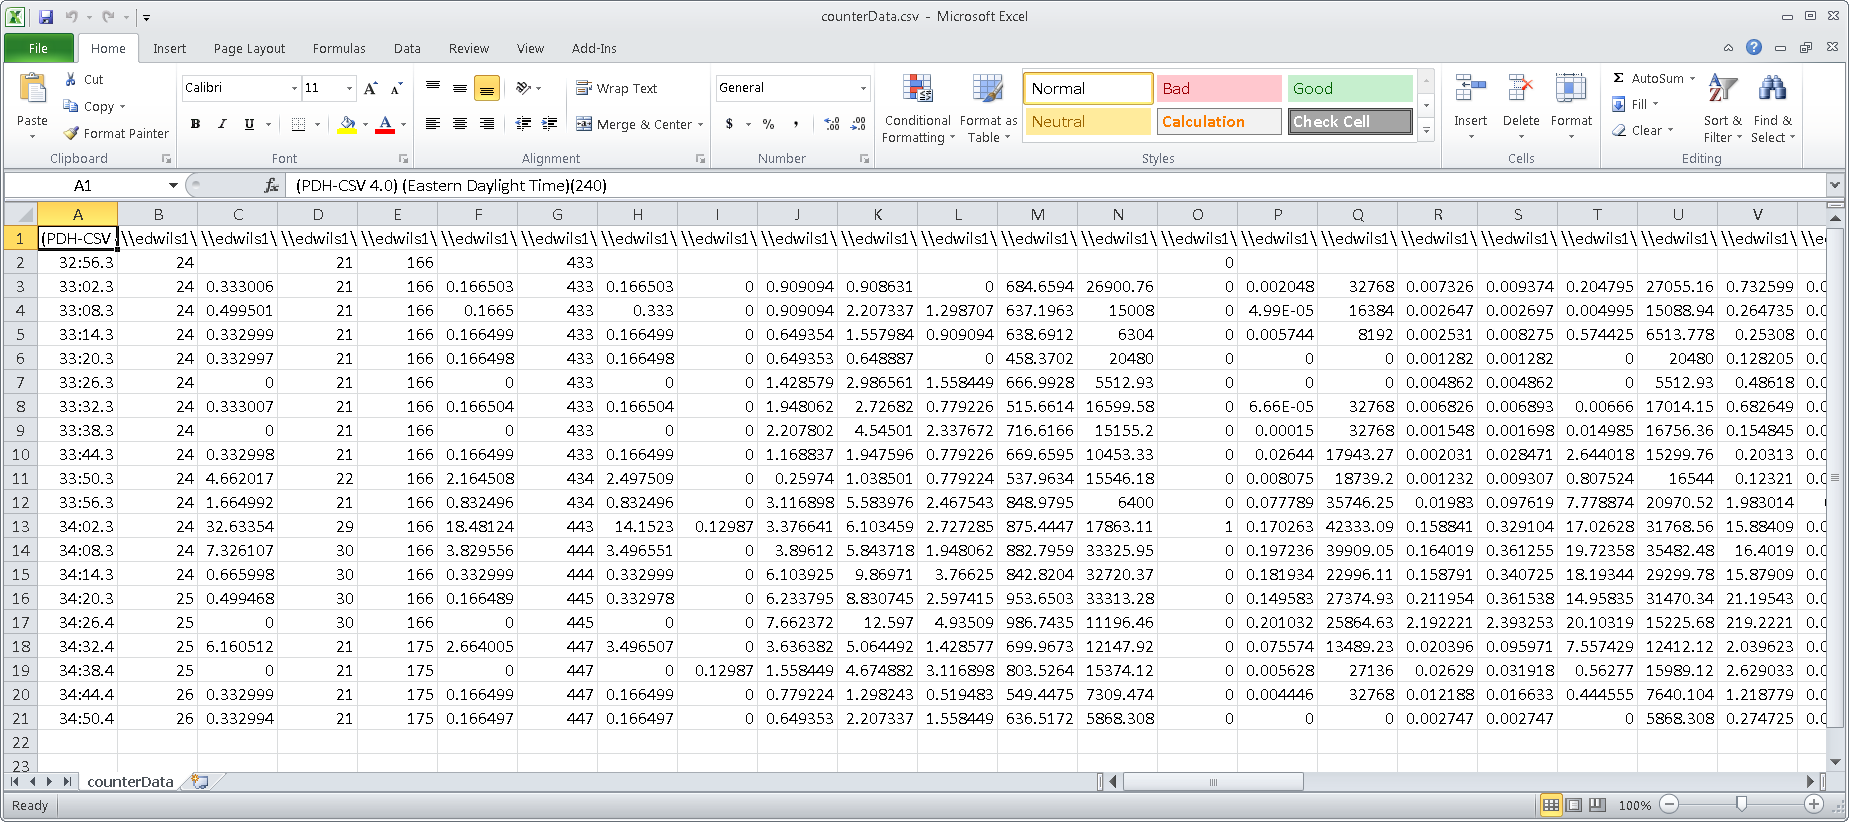
The data that is collected outputs to a CSV file. By default, CSV files associate with Microsoft Excel (if installed), and the CSV file created by running the script and exporting the counter information are shown in the following figure.
After I have verified that I have captured the data and have it in an acceptable format, I am ready to import it into a database. One note: if anything changes from the .blg file to the counter path file to the time when you run your script to capture data, you might receive an error while running the script. The error might be associated with an “invalid” counter path. This might happen, for example, if you were running this on a laptop and the counter is supposed to use a wired network connection, and later you were on a wireless network connection and disabled the wired network adapter. All the other data would be captured; only the invalid Perfmon counters would be mentioned in the error message and no data would be captured for those instances. A sampling of such errors is shown in the following figure.
To import my newly created CSV file into my database, I am going to use the SQL Server Import and Export Wizard. I created my database earlier by using Microsoft SQL Server Management Studio, but I could have used the SQLPSX cmdlets from CodePlex. I am using SQL Server 2008 R2 Express Edition, which is a free download. One disadvantage of using the Express Edition is that I cannot save my import package.
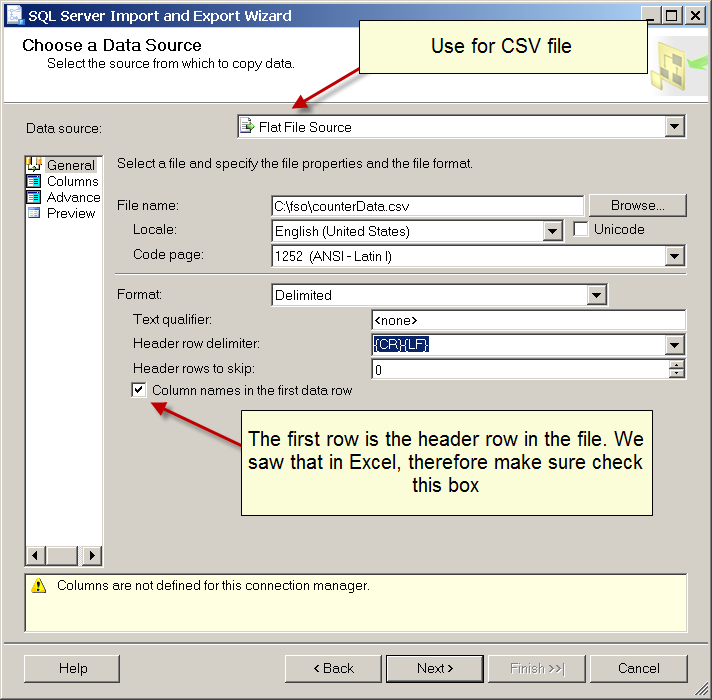
After I have chosen my data source, selected the file, and specified that the column names are in the first data row, I go to the next page where I can view the way the data will be imported. If it does not look acceptable, I can go back and make advanced changes. In this case, however, everything looks fine, as is shown in the following figure.
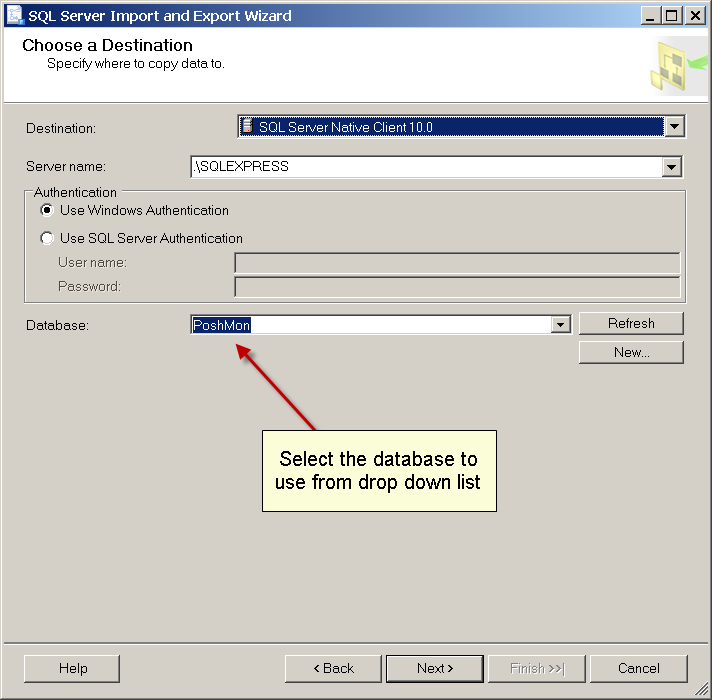
Now I need to choose which database I am going to use. I am going to use my PoshMon database on my SQL Server Express Edition, and connect via Windows Authentication. This is shown in the following figure.
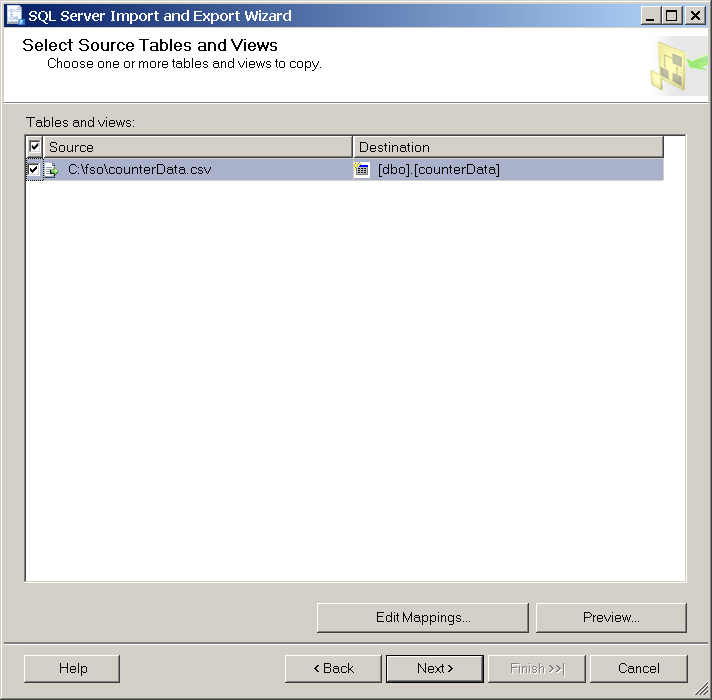
Now I need to map the data to a particular table. I am going to wimp out and allow the wizard to automatically create a new table for me. The table will be called counterData, which was the name from the spreadsheet. The table mapping is shown in the following figure.
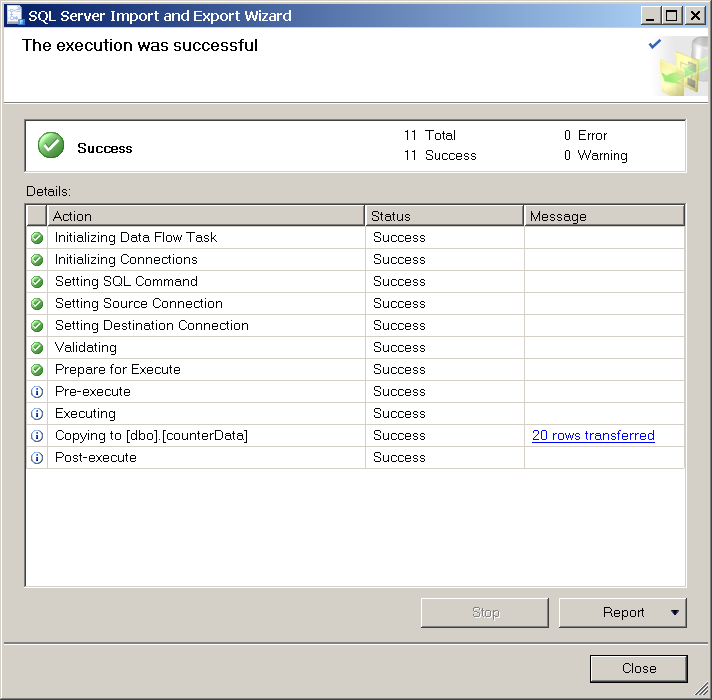
It is time to click a few more times and allow the import to run. The results appear on the final screen. If a problem occurs, a report will be available under the Message column. The successful conclusion page is shown here.
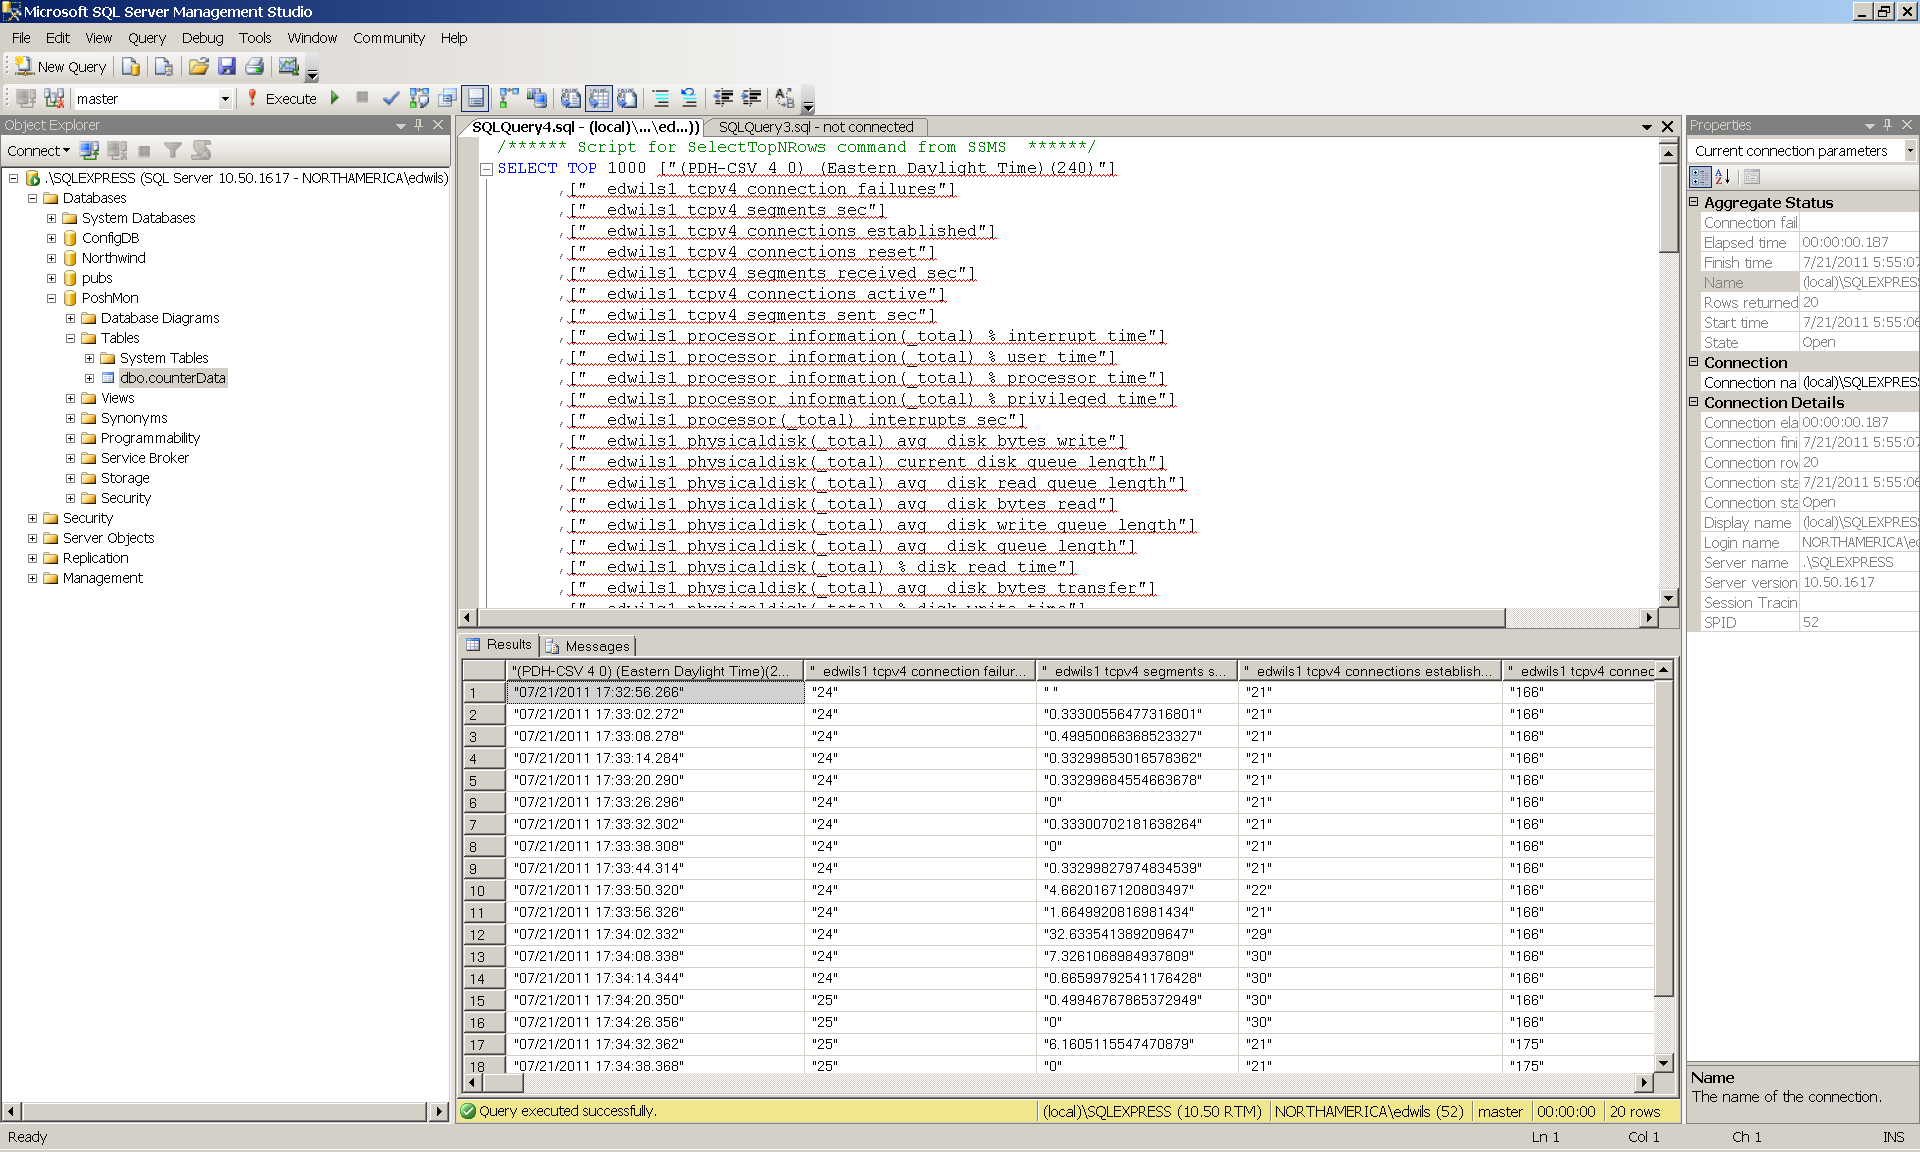
After the import has completed, I like to run a query from inside the SQL Server Management Studio. I can right-click the newly created table and choose Select Top 1000 Rows from the shortcut menu. The generated query and associated data are shown in the following figure.
That is it for querying performance counters and writing them to a SQL database. It can be lots of fun. Download SQL Express today, and give it a whirl.
I invite you to follow me on Twitter and Facebook. If you have any questions, send email to me at scripter@microsoft.com, or post your questions on the Official Scripting Guys Forum. See you tomorrow. Until then, peace.
Ed Wilson, Microsoft Scripting Guy



0 comments