Summary: Learn how to create and parse performance monitor logs by using Windows PowerShell.
![]() Hey, Scripting Guy! I am wondering if I can use Windows PowerShell to create a performance counter log that I can use in Perfmon?
Hey, Scripting Guy! I am wondering if I can use Windows PowerShell to create a performance counter log that I can use in Perfmon?
—CS
![]() Hello CS,
Hello CS,
Microsoft Scripting Guy Ed Wilson here. After I finished giving my two talks on Windows PowerShell at SQLSaturday in Wheeling, West Virginia, I had the chance to talk to Ken M. and Matt L. who are both from Pittsburgh, Pennsylvania. Actually, The Scripting Wife and I had a chance to meet Ken M. at the PowerShell Deep Dive in Las Vegas. One of the things we were talking about was starting a new Windows PowerShell users group in Pittsburgh. I hope it will happen. By the way, next weekend (August 6–7, 2011) I have a couple of articles that talk about what is involved in starting a Windows PowerShell users group. If you would like to start a Windows PowerShell users group, shoot me an email at scripter@microsoft.com.
Note Performance counter cmdlets in Windows PowerShell work on Windows 7 and later. If you need to work with performance counter logs in an operating system before Windows 7, use the Relog.exe utility. This library article talks about other command-line tools that you might find useful in working with performance counters.
CS, when running scripts that might generate a lot of data, it is important to look at potential memory consumption. For example, let’s use the commands from yesterday’s Hey, Scripting Guy! Blog post that select the performance counter paths to collect processor, memory, and disk information. After I have gathered all the counters, I submit them to the Get-Counter cmdlet to begin the collection of the data. The commands is shown here:
$a = (Get-Counter -ListSet “Processor Information”).paths
$a += (Get-Counter -listSet “memory”).paths
$a += (Get-Counter -listSet “LogicalDisk”).paths
$a += (Get-Counter -listSet “PhysicalDisk”).paths
Get-Counter -Counter $a
If I want to use Windows PowerShell to create a performance log, the best way to do this is to use the pipeline and stream the data directly to the file. Streaming the data directly to a file will reduce the memory consumption of the command. I can use the continuous switched parameter to cause the Get-Counter cmdlet to stream data continuously. Because of the manual intervention required, this switch is limited to ad hoc performance testing. One would never kick off a scheduled task with the continuous switch. The modified command is shown here:
$a = (Get-Counter -ListSet “Processor Information”).paths
$a += (Get-Counter -listSet “memory”).paths
$a += (Get-Counter -listSet “LogicalDisk”).paths
$a += (Get-Counter -listSet “PhysicalDisk”).paths
Get-Counter -Counter $a -Continuous | Export-Counter -Path c:\fso\myperflog.blg
If I run this command from the Windows PowerShell ISE, I can click the red button to halt execution of the command. If I run this from the Windows PowerShell console, I need to press Ctrl+C to halt execution. This is because I used the continuous switch. The Export-Counter cmdlet has a maxsize parameter (to limit the size of a performance log), but it does not work when the Get-Counter cmdlet is run in continuous mode.
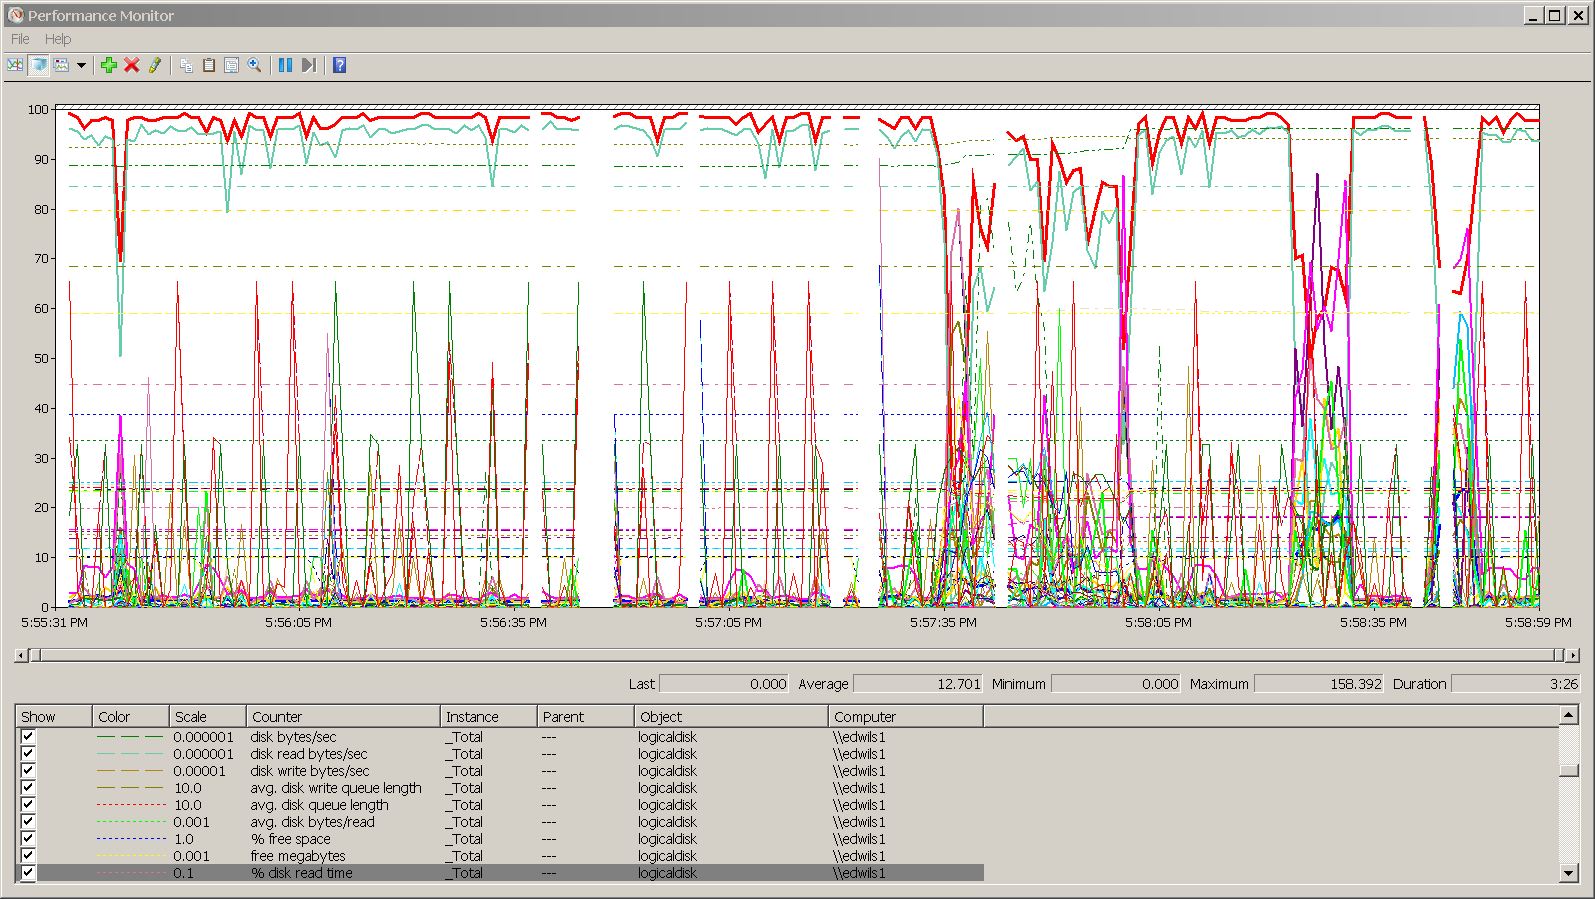
After I have finished collecting my data, I can open the .blg file directly in PerfMon, as shown in the following figure.
To explore the data from the performance log, I import the performance log into a variable, index into the variable, and pull out a single snapshot. Remember from yesterday, the counter set on my laptop contains more than 220 counter paths, so for each snapshot, I have more than 220 performance points to examine.
The data I want to work with is stored in a property called countersamples. This is where I will find the information I am interested in examining.
If I want to find all counters in the first sample (that contains 220 performance points) that have a cooked value that is greater than 3000, I use the command following this paragraph. On my laptop, quite a few counters return from the command because of the various memory counters at work (my laptop has total memory that is greater than 3000 bytes). Anyway, here is a command that will return all cooked values that are greater than 3000. In this command, the [0] is used to index into the array of performance counter information, and return the first record set of data. The ? is an alias for the Where-Object cmdlet. The $_ is used to refer to each performance counter as it streams across the pipeline. The curly brackets indicate a script block that is supplied to the Where-Object cmdlet:
$a[0].countersamples | ? {$_.cookedvalue -gt 3000 }
To use Windows PowerShell to troll through the data and return useful information, it is necessary to use a compound query. In other words, I want to find counters that contain a certain word and have a certain value. For example, suppose I notice I have an issue with disk utilization. I might use a command such as the one shown here to identify all counters that contain the word logicaldisk in the path and that have a cooked value that is greater than 2. The reason for this query is that a diskqueue length greater than 2 could be signs of a problem. Here is the command (when using the –AND operator in a Where-Object cmdlet, it is necessary to repeat the $_ for each property with which you wish to work):
$a[0].countersamples | ? {$_.path -match ‘logicaldisk’ -AND $_.cookedvalue -gt 2 }
The output, as shown here, is not too enlightening because of the large number of counters that relate to disk space:
Path InstanceName CookedValue
\\edwils1\logicaldisk(harddiskvolume1)\% free space harddiskvolume1 94.3312101910828
\\edwils1\logicaldisk(_total)\% free space _total 38.6717598265006
\\edwils1\logicaldisk(c:)\% free space c: 38.0932520373644
\\edwils1\logicaldisk(harddiskvolume1)\free megabytes harddiskvolume1 1481
\\edwils1\logicaldisk(_total)\free megabytes _total 59022
\\edwils1\logicaldisk(c:)\free megabytes c: 57541
I can now begin to filter out the information, because I have a good idea of the type of data with which I am working. I also know that many of the returned counters are returning percentages of free space, and that is a value I am not too interested in right now. Because I am working with a collection of 195 different readings, one might be tempted to use the ForEach-Object cmdlet to work through the countersamples. After all, I did have to index into the array to begin working with the countersamples. The following command would work. It would also return only counters that match logicaldisks, but do not have the word free in the path:
$a | % {$_.countersamples | ? {$_.path -match ‘logicaldisk’ -AND $_.path -notmatch “free” -And $_.cookedvalue -gt 2 } }
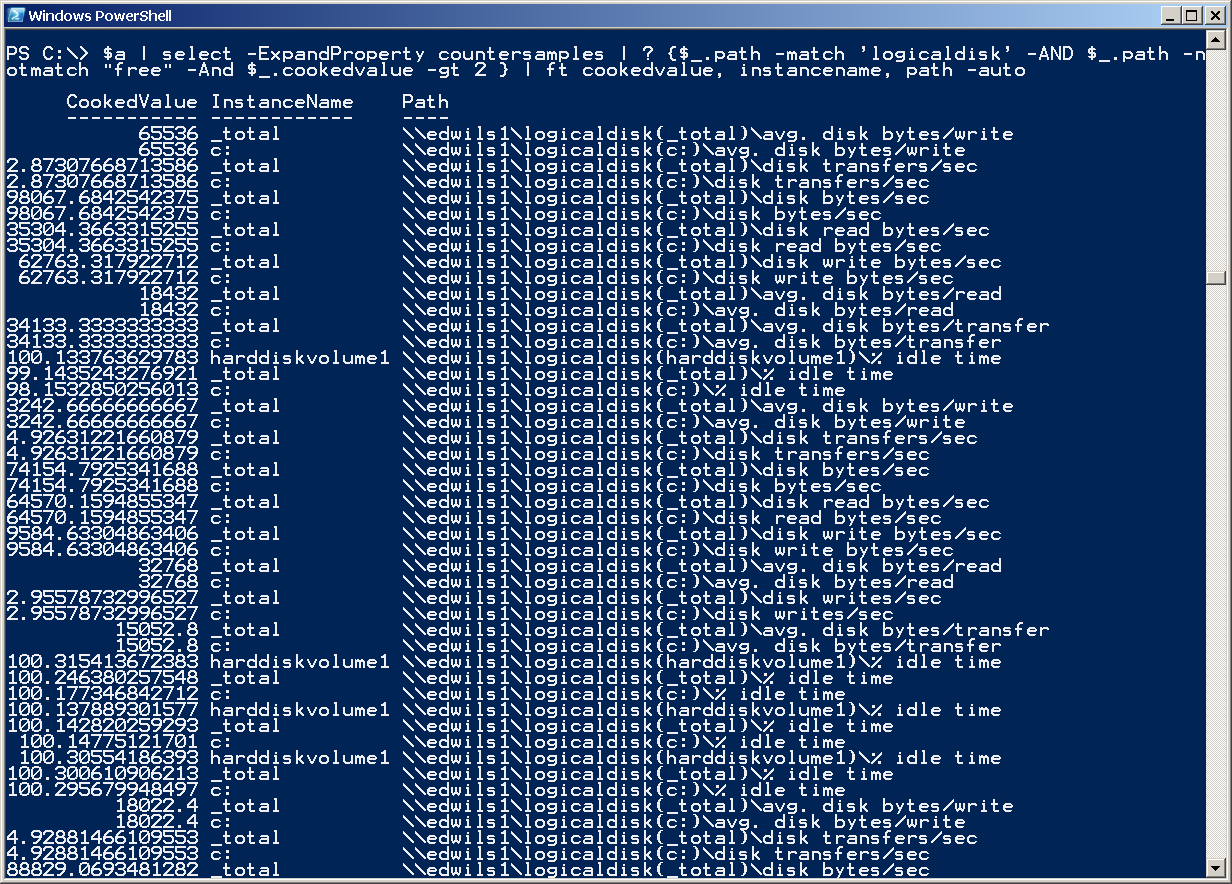
A better approach, however, is to use the expandproperty property from the Select-Object cmdlet. This avoids the performance hit of interrupting the stream across the pipeline. To make the output easier to read, I pipe the output to the Format-Table cmdlet (this is one logical command that has broken across multiple lines; I have not included any line-continuation characters):
$a | select -ExpandProperty countersamples | ? {$_.path -match ‘logicaldisk’ -AND $_.path -n
otmatch “free” -And $_.cookedvalue -gt 2 } | ft cookedvalue, instancename, path –auto
The command and associated output are shown in the following figure.
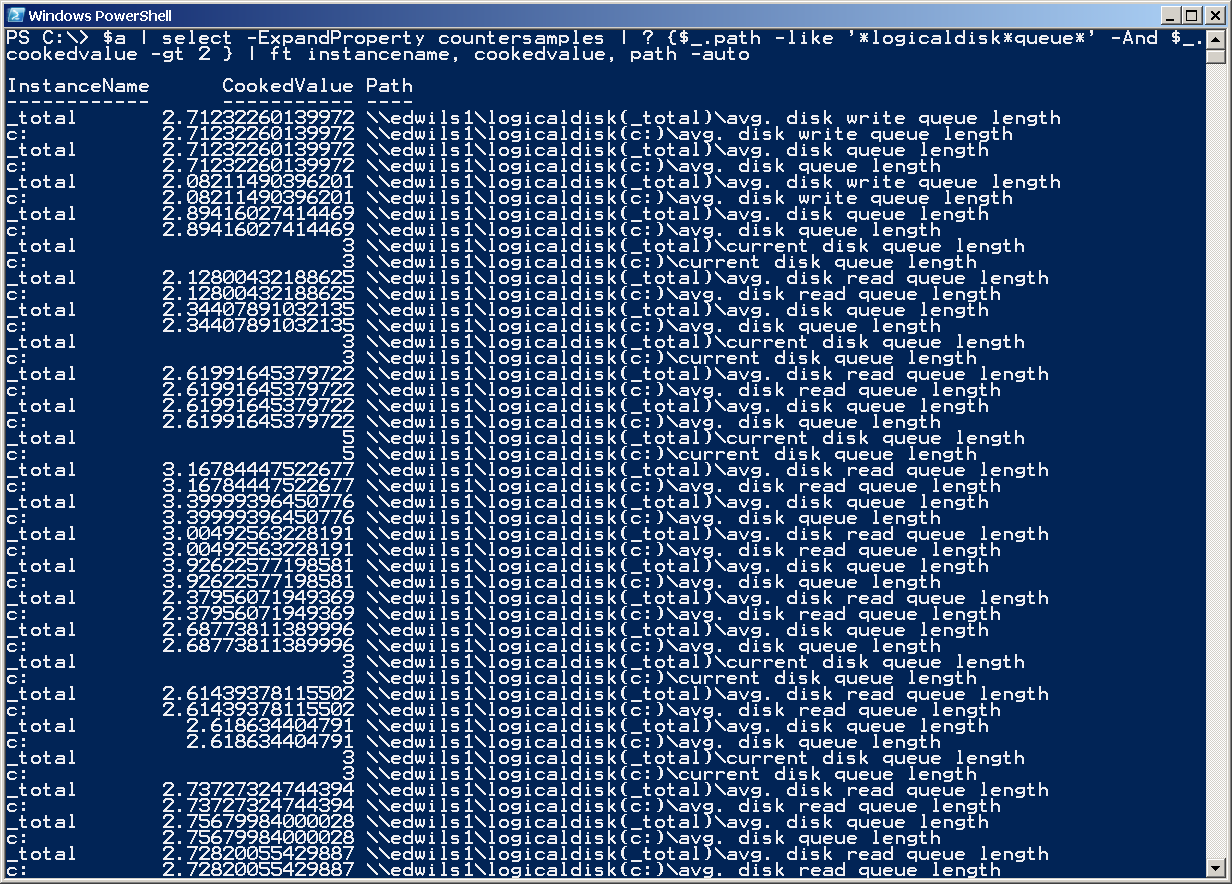
But, I had said, I thought I had a problem with the disk queue. I change my query around a bit. For one thing, I do not need to exclude any counters with the word free in the path because I am looking for items to do with the disk queue. I am specifically interested in any counter dealing with a disk queue that has a length greater than 2. I pipe the results to the Format-Table cmdlet to make the display a bit easier to read. Here is the command (keep in mind it is a single-line command, and I have not added any line-continuation characters; therefore, if you run this command, make sure it is a single line):
$a | select -ExpandProperty countersamples | ? {$_.path -like ‘*logicaldisk*queue*’ -And $_.
cookedvalue -gt 2 } | ft instancename, cookedvalue, path -auto
The command and associated output are shown in the following figure.
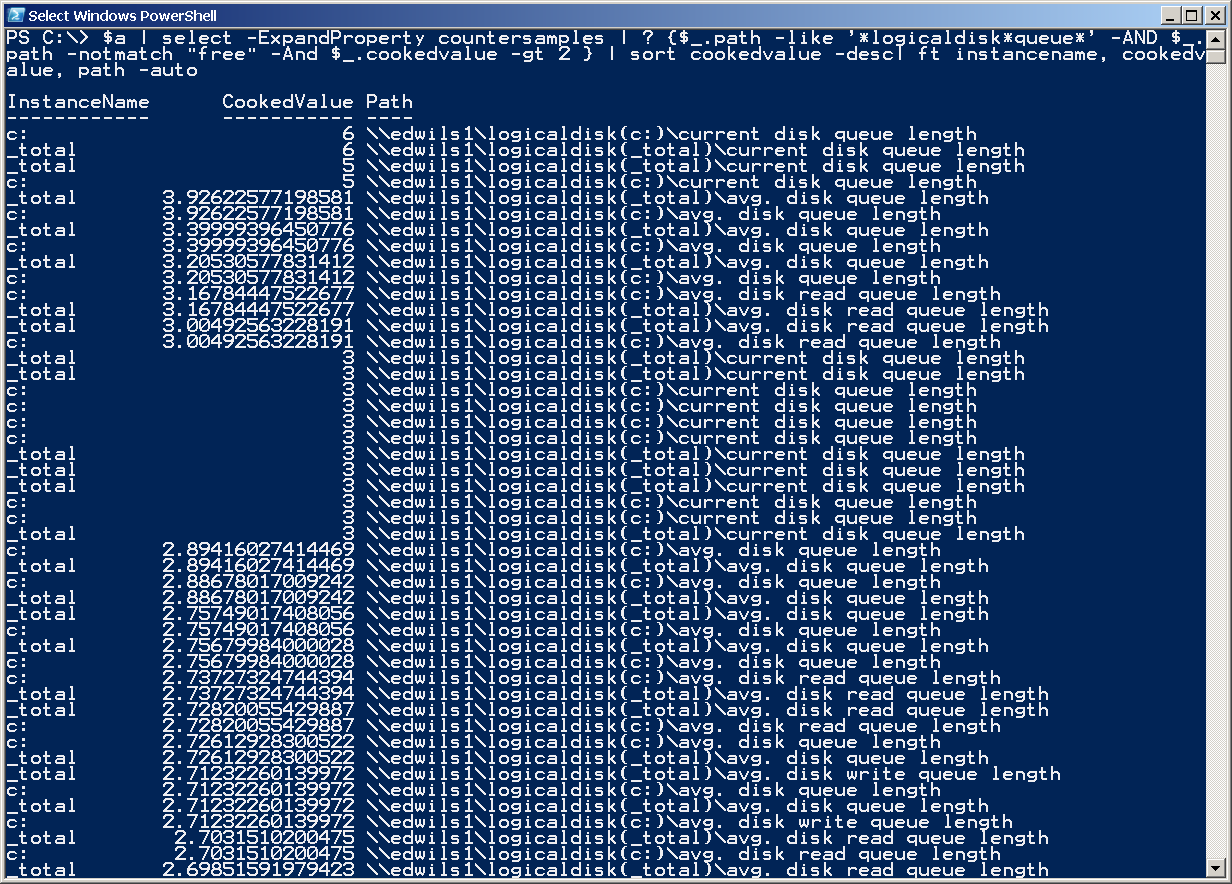
Scrolling through the list, it is not obvious which problem I might actually have. I decide to sort the list. First, I sort by the queue length. I want the largest numbers on top, so I use the descending switched parameter. Once again, this is a single command:
$a | select -ExpandProperty countersamples | ? {$_.path -like ‘*logicaldisk*queue*’ -AND $_.
path -notmatch “free” -And $_.cookedvalue -gt 2 } | sort cookedvalue -desc| ft instancename, cookedv
alue, path –auto
The command and associated output are shown in the following figure.
I think I would like to see the counters sorted by path name. This will give me a feel for the ranges involved. The command is shown here (this is a single-line command; I have not included the backtick line continuation character):
$a | select -ExpandProperty countersamples | ? {$_.path -like ‘*logicaldisk*queue*’ -AND $_.
path -notmatch “free” -And $_.cookedvalue -gt 2 } | sort path | ft instancename, cookedvalue, path –
auto
The command and associated output are shown here.
Well, that is all there is to working with performance logs in Windows PowerShell.
I invite you to follow me on Twitter and Facebook. If you have any questions, send email to me at scripter@microsoft.com, or post your questions on the Official Scripting Guys Forum. See you tomorrow. Until then, peace.
Ed Wilson, Microsoft Scripting Guy


0 comments