
In this post, Senior App Dev Manager Randy Park continues with his series on Machine Learning with an experiment and introduction to ML.NET.
This is the continuation from the previous article which demonstrated of feature permutations using Azure Machine Learning Studio solution. As mentioned in that article, if you would like to find out more on this powerful experiment, please read about permutation feature importance. Put it simply, the Permutation Feature Importance (PFI) computes the permutation feature importance scores of feature variables given a trained model and a test dataset. As illustrated, doing it with Azure ML studio was easy as a few drag-and-drop operations. In this article, we would wonder what it would take on doing the same with ML.NET.
We will continue to use same dataset as mentioned in previous article which utilized a very popular exercise dataset to conduct EDA to determine factors that lead to attrition. The data contains 35 total columns as below:
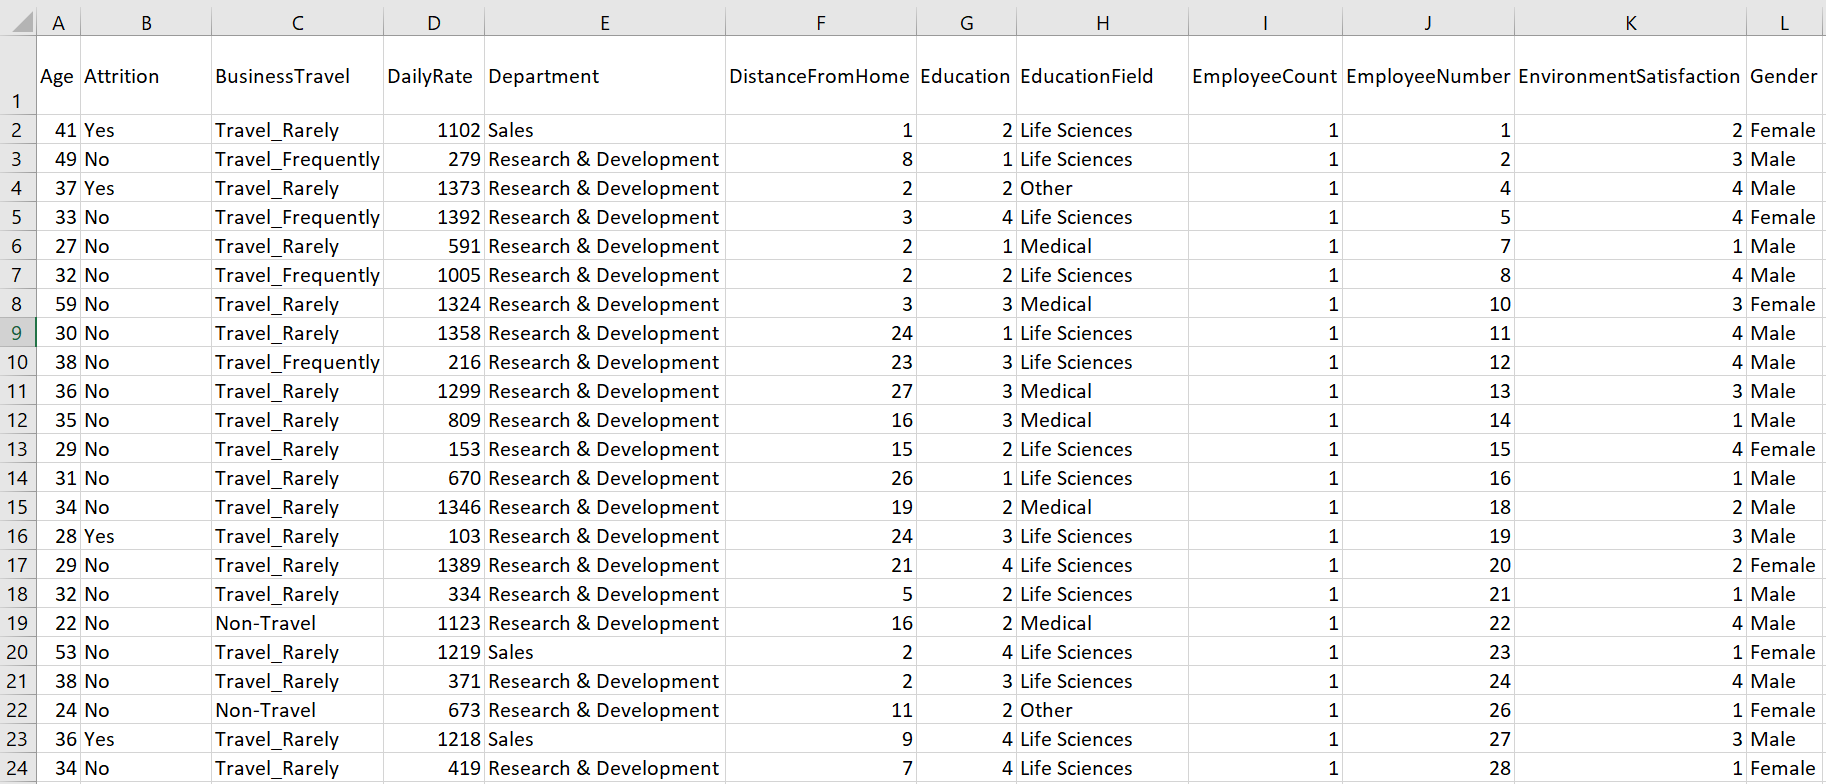
We will identify at least the top three or four factors that contribute to employee turnover. I often find general PFI examples on internet seemed rather too simple. I hope this experiment can relate the machine learning problem to real world scenarios as well as explaining the steps & efforts involved.
Introduction to ML.NET implementation
The building of machine learning model comprises of four or five steps depending on who you ask or which machine learning framework or strategy you employ. Here with ML.NET, any complex ML.NET operations can be succinctly expressed utilizing high level IEstimator .NET interface along with other various transformers. These choices of names and such implementation are not any different from the popular ML frameworks, such as TensorFlow and Scikit-Learn pipelines.
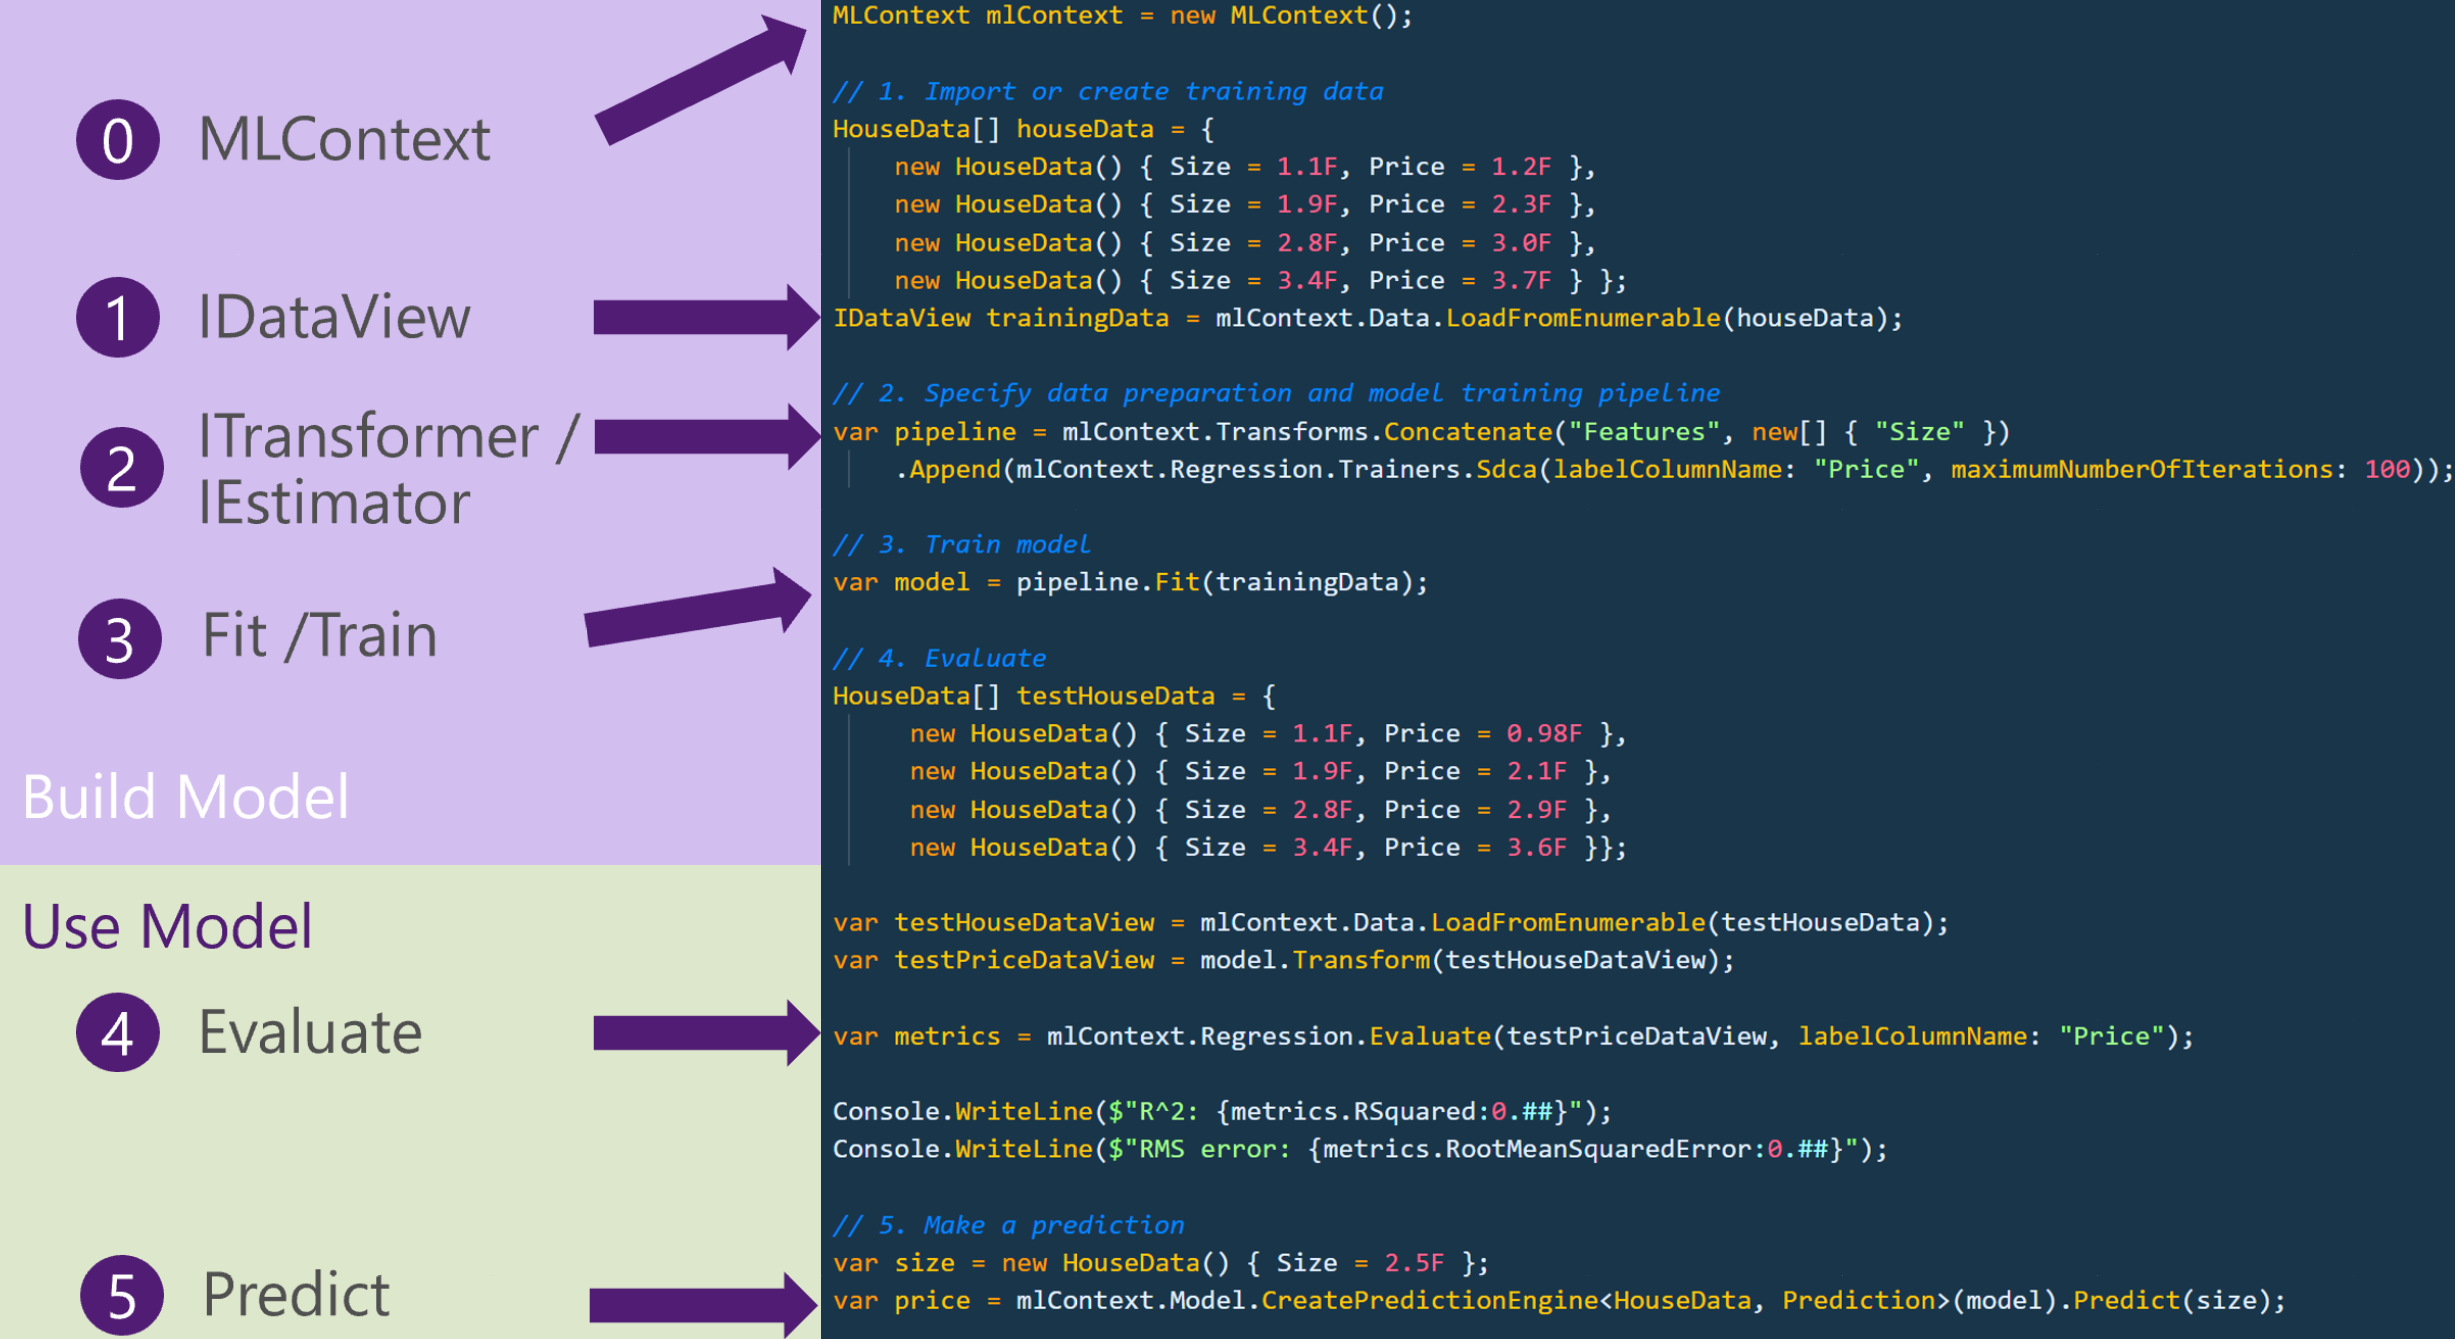
Figure 1: Sample of ML.NET Pipelines
First, we begin with obvious by creating the MLContext and the ML.NET implementation begins.

Figure 2: Step-0 – Instantiate MLContext
As our ML.NET application also starts with an MLContext object, keep in mind this singleton object offers many useful catalogs. A catalog is a factory class for data loading and saving, transforms, trainers, and model operation components. On debugging time, when inspecting of MLContext instance, you may feel it seems to offer just handful of components and algorithms, but please note that other training algorithms are also available through extension libraries.
Below is the step to load the training data to IDataView interface as well as provisioning test data.

Figure 3: Step-1 – Instantiate IDataView
Then, we will start featurization step by applying data transformers as below.
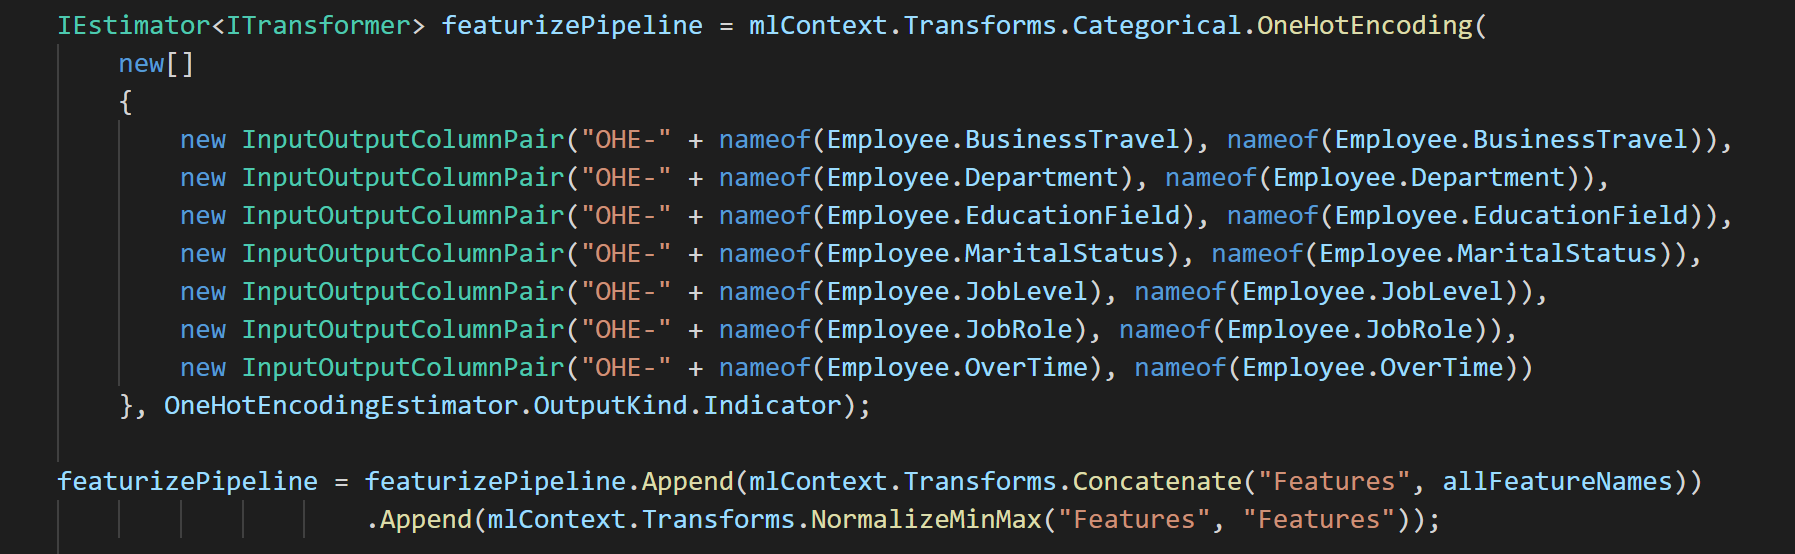
Figure 4: Step-2 – Featurize with transformers
I would like to make a clear separation of transformers responsible of featurizing of input dataset to the trainer. There are a few reasons, first, I would like to apply on other algorithms and make the comparisons. ML.Net offers so many great trainers and we will have to choose the trainer, typically based on the performance metrics and/or utilization of system resources. Second, as most experienced data scientists agree, the success of building machine learning model is on the featurization.
Continuing on, as this sample code seems very simple, and one-hot-encoding was no brainer for the text field categorization, though I spent considerable amount of time to choose a few other ways to vectorizing text fields and too numerous to mention to validate all the trials and errors. Make the long story short, once I am done with the featurization steps, I can now concentrate on which trainer to pick to fit the model to the featurized training data.
Here, I chose SdcaLogisticRegression trainer.
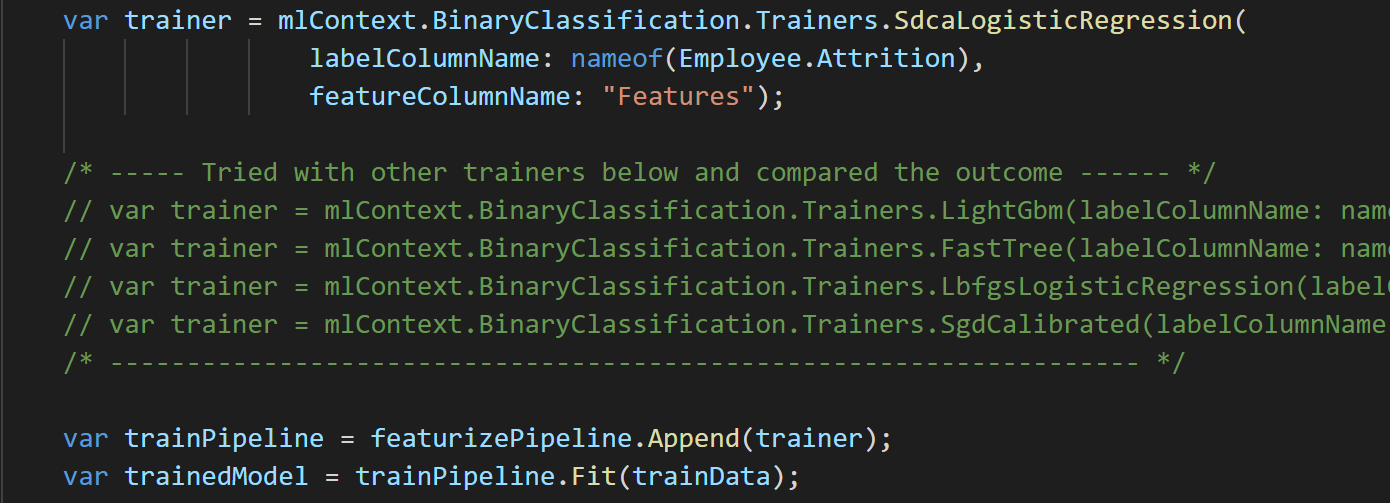
Figure 5: Step-3 – Train
Explaining of each of binary classification trainers are out-of-scope for this article, please go to this link to find out more about each of the trainers mentioned in the code.
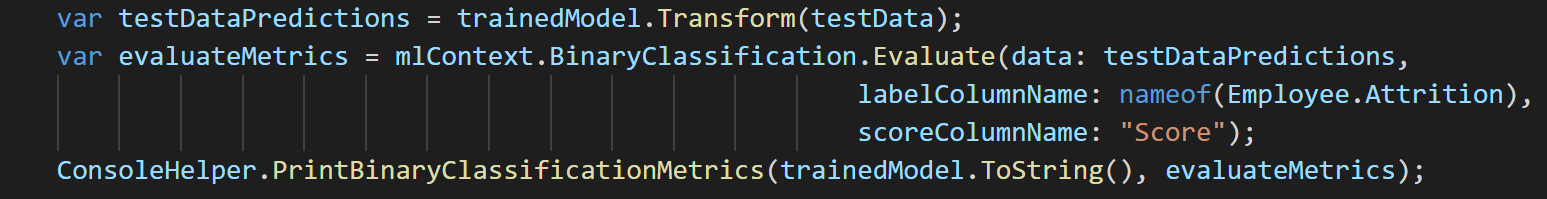
Figure 5: Step-4 – Evaluate
The ConsoleHelper class contains much useful utility methods developing and debugging machine learning models. As the model’s accuracy is about 85% and the area under curve (AUC) reaches about 83%, this model should be good to use to predict if the employee may likely leave or stay given circumstances.
===== Evaluating Model's accuracy with Test data =====
* Accuracy: 85.66%
* Area Under Curve: 82.94%
* Area under Precision recall Curve: 54.56%
* F1Score: 38.81%
* LogLoss: .5
* LogLossReduction: .23
* PositivePrecision: .65
* PositiveRecall: .28
* NegativePrecision: .87
* NegativeRecall: 97.07%
************************************************************
Now the primary purpose of the article begins here, the Feature Permutation step should occur right after the evaluation of the trained model. The main purpose of evaluation is on model performance and make decision based on the metrics of the model, but you can also draw out other observations including feature permutations. As the trained model is available, using the other random-sampled test dataset, different set of permutation of features will occur under the hood and will identify which of the features have heavier importance.
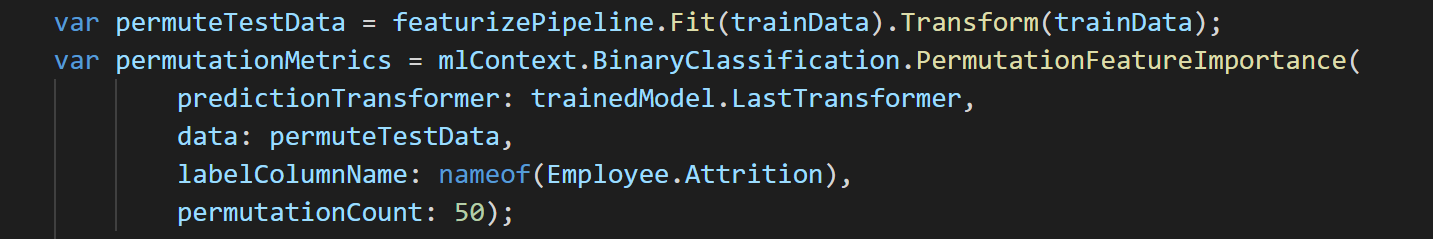
Figure 5: Step-4 – PFI
Now most important aspect of this project is to find the “why” or “what” contributes to attrition rather than providing of the accurate model. The BinaryClassfication.PermutaitonFeatureImportance() will provide the metrics, and make sure that we provide the featurized test data plus the trained model. Since we created separate featurizePipeline transformer, we can easily create IDataView permuteTestData.
What does the above PFI findings highlight? Below are the observations;
| Top 4 Features | Comments of this Observation |
|---|---|
| Overtime | Higher reported Overtime, employees are more likely to leave. |
| Marital Status | Certain group of marital status is more likely to leave than the other group. As far as which group, it could be identified through the debugging of each permutation slot associated. |
| Department | Certain department employees are more likely leave than other departments. Again, the identification could have been done as well. |
| Years At Company | Number of years at the same company are factored. Again, is it more years more likely to leave or less likely to leave? |
As with the first article, this exercise should not be looked at as the de-facto conclusion regarding attrition. However, it’s interesting to note of top concern of “Overtime” agreed with R implementation of correlation coefficients and Azure Machine Learning Studio solution.
Wrap Up
As mentioned in the previous article, PFI metrics are very useful in many cases, especially when training of the “black-box” models and when explain of causes are more important than the outcome. In general, the PFI explains how the model characterizes the relationship between the features and the target variable. We encourage everyone try this out and apply various statistical modules and machine learning models. Also, please find the code in this github repository.
On ending note, if you’re an enterprise developer who has been using C# with .NET framework and wanted to taste what machine learning development is all about, give yourself a chance with ML.NET. You can certainly reach out to Microsoft Premier service, and the team of experts will guide you step-by-step and help you to lessen the initial learning pains involved. Even without such consultation, I believe through abundance of easy-to-understand samples from Microsoft document sites and related github repos, you will find the new joy of adventure into this new development space!
0 comments