In the following article by Premier Developer consultant Kurt Schenk, he explains how to monitor a Java app using Tomcat running on Windows.
When deploying a Java Azure App Service Web App, there are some great tools you can use for monitoring. Before describing these tools, I will first share some background about operating systems and languages that the Azure App Service supports.
App Service Web Apps has out of the box support for ASP.NET and Java Apps (using Tomcat) running on Windows. Other languages (Node, PHP, .NET Core, Ruby) are supported with pre-configured Docker containers that run on Linux. You can also deploy custom containers as well. The focus of this blog is on how to monitor a Java app (using Tomcat) running on Windows.
You can deploy a Java Azure App Service Web App in several ways. For example, you can deploy it with Eclipse or Maven.
When you do this, the App Service Web App is using Windows OS, Java, and Tomcat. You can see this with kudo if you look at configuration, and you will see that a template similar to this one on Github is used.
Also, see web.config from JavaCoffee sample app after it was deployed to Azure.
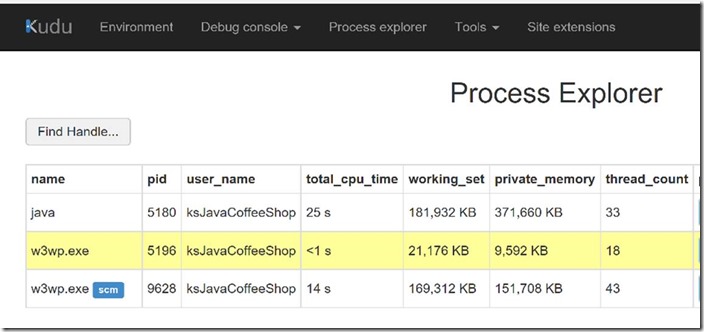
The running processes are ASP.NET (w3wp.exe) and Tomcat (java.exe).
To monitor your Java App Service Web App, you can leverage the tools below.
Azure Monitor Metrics: Azure App Service has been onboarded to Azure Monitor Metrics. These metrics can be sent to Application Insights.
Azure Monitor Diagnostics Logs: App Service Diagnostics Logs are not yet onboarded to Azure Monitor; however, by enabling Application Insights for App Service Web App, similar diagnostic information is captured such as web requests, exception, etc. (see “Application Insights” below).
For a list of Azure Services that have been onboarded to Azure Monitor Diagnostic logs see this resource.
Application Insights
Application Insights support Java Applications (see “Languages” section). If you follow the link for Java it takes you here.
You can capture JMX Counters in addition to Windows Performance Counters and send it to Application Insights.
“Logging Frameworks” supported by Application Insights includes Log4J. This enables capturing Tomcat logging since Tomcat uses Apache’s Java Commons Logging (JCL). Log4J is a popular implementation of JCL.
Azure Log Analytics
You can send Application Insights telemetry to Azure Log Analytics with this connector that is in preview.


0 comments