In this post, Sr. App Dev Managers Al Mata, Candice Lai, and Syed Mehdi gives a walkthrough of WinDbg.
You’re likely a developer and have used a code editor to debug and analyze your application failures. Few developers know or understand the “old school” way of troubleshooting to uncover additional details; enter the WinDbg debugger.
WinDbg is a general-purpose debugger for Windows operating system applications and code. It helps Developers find and resolve errors in their application, memory, system and drivers to name a few. This article introduces you to the WinDbg debugging concept and tool.
Getting started with WinDbg:
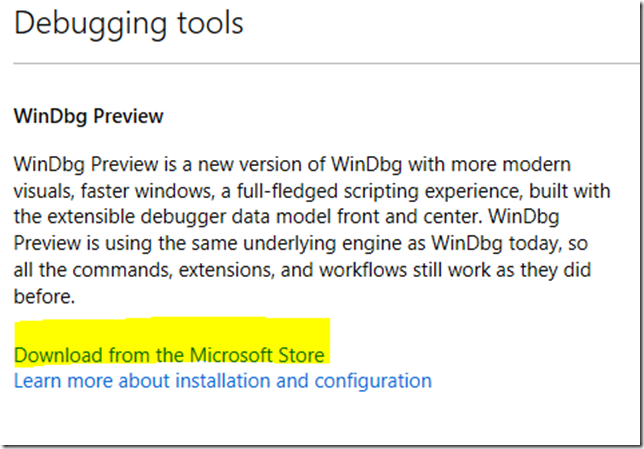
1. Download the Debugging Tools for Windows from the Microsoft website
We recommend you install WinDbg Preview as it offers more modern visuals, faster windows, a full-fledged scripting experience, built with extensible debugger data model front and center.
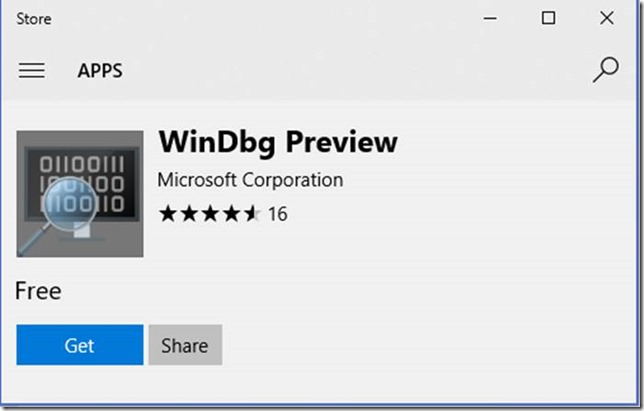
2. When clicking Download from the Microsoft Store, a prompt will appear, select “Get”
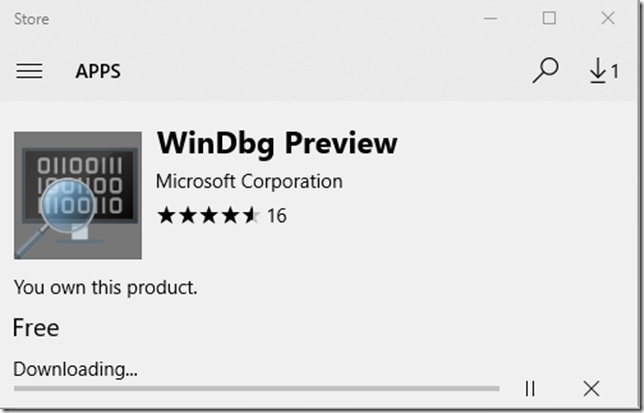
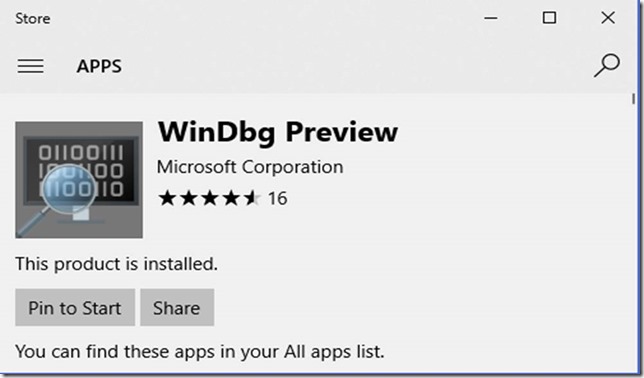
3. Windows will start the download and installation process. A prompt will confirm installation status.
4. Select to “Pin to Start,” close windows by clicking “X” on the top right of Window.
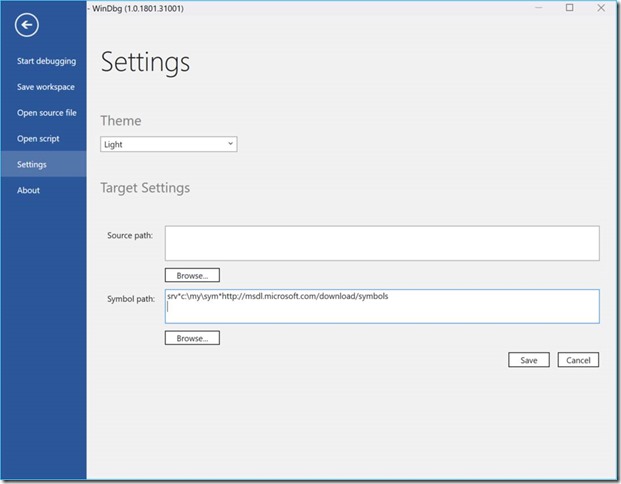
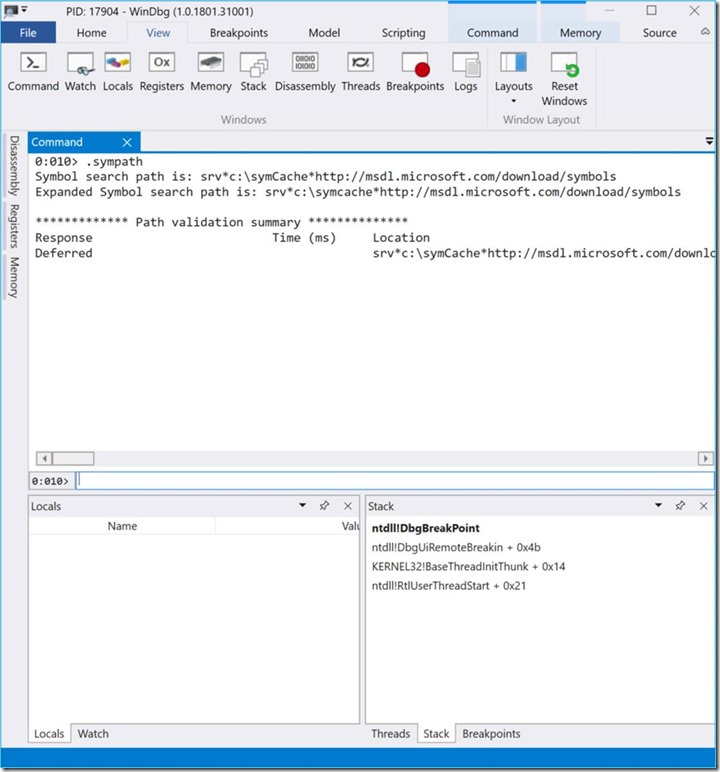
5. Set the Windows Symbol Server path in File > Settings > Symbol path (see example below)
6. Go to your Start menu, select the WinDbg Preview to launch the application
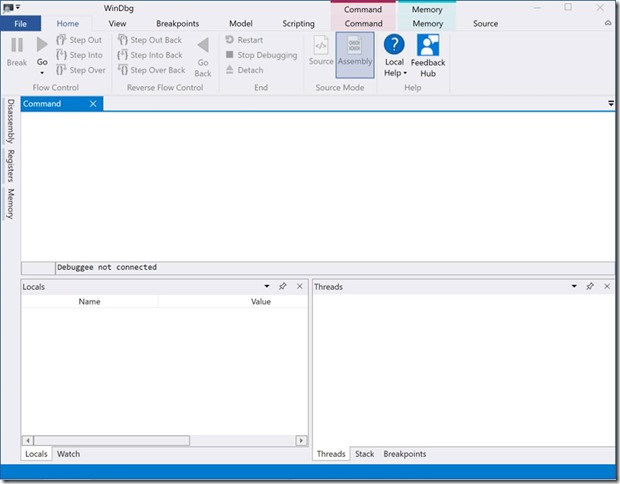
7. The WinDbg initial view
8. What is the difference between User Mode-Debugging and Kernel-Mode Debugging?
In User mode debugging, the code normally delegates to the system API’s to access hardware or memory. You typically are debugging a single executable, which is separated from other executables by the OS. Typical scenario is to isolate memory or application hang issues on Win32 desktop applications. In User mode, the debugger is running on the same system as the code being debugged.
In Kernel mode debugging, the code normally has unrestricted access to the hardware. Typical scenario is driver code developed for hardware devices. When debugging in Kernel mode you typically use two different systems. One system runs the code that is being debugged, and another runs the debugger, usually connected with a cable. Click here for additional information on Kernel mode debugging.
9. Advantages of WinDbg:
- Extensive numbers of commands and extensions.
- A useful tool to help understand OS and software running on the system being debugged.
- Lightweight and can be used in production as it has no dependency, only require an executable (.exe) to run.
- A useful tool to help isolate User or Kernel mode code that’s difficult to troubleshoot on Windows.
10. Common User mode debugging commands:
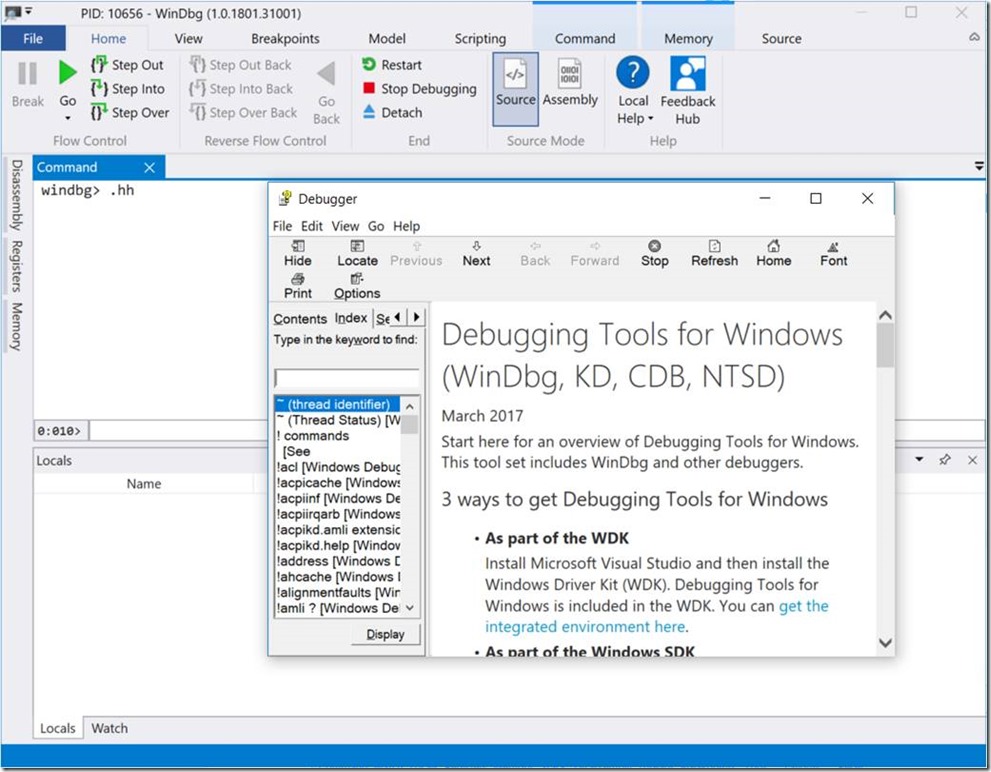
.hh (Open WinDbg’s help)
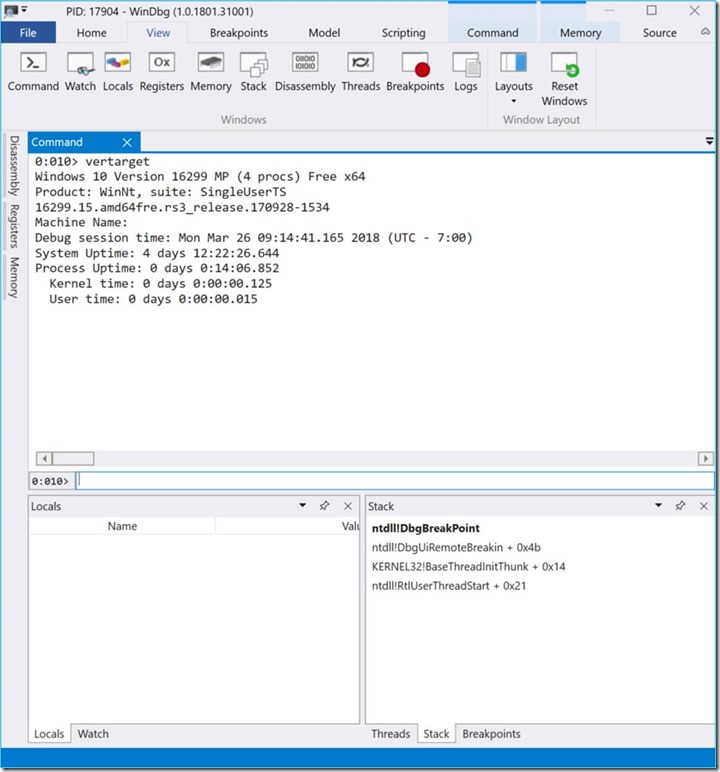
Vertaget (Get the version of the target computer)
Symbol Path (Display or set symbol search path)
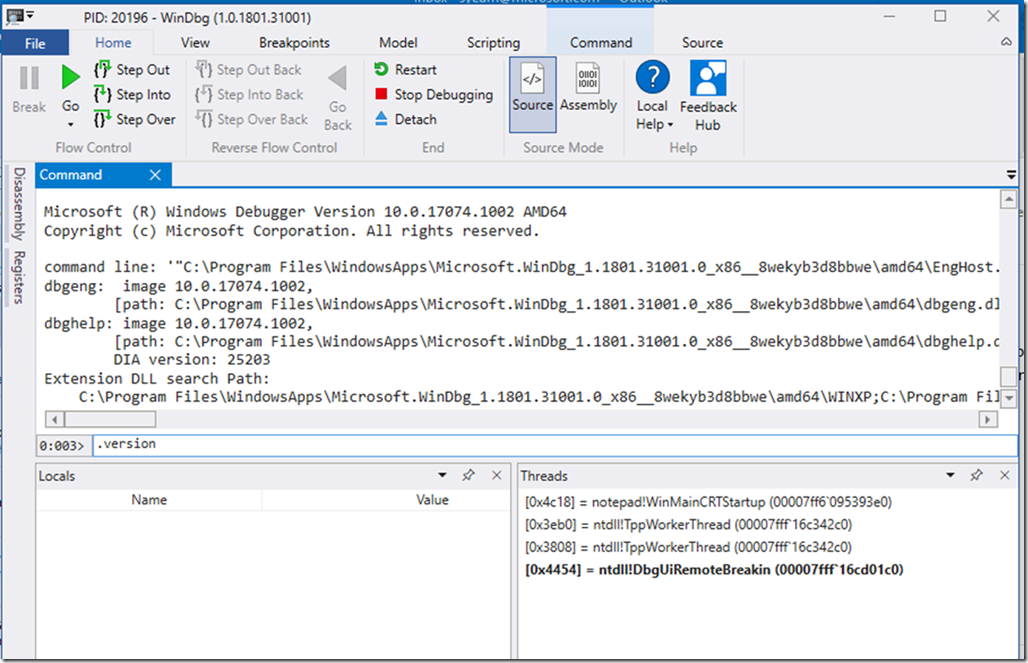
Version (Dump version info of debugger and loaded extension DLLs)
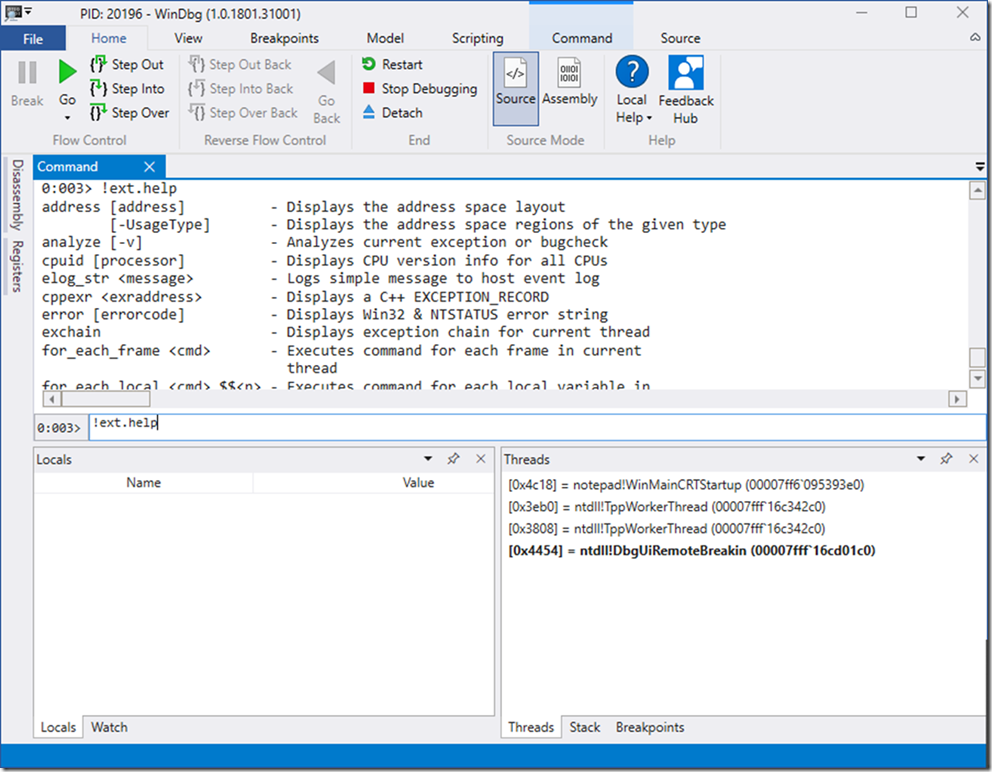
!ext.help(General extensions)
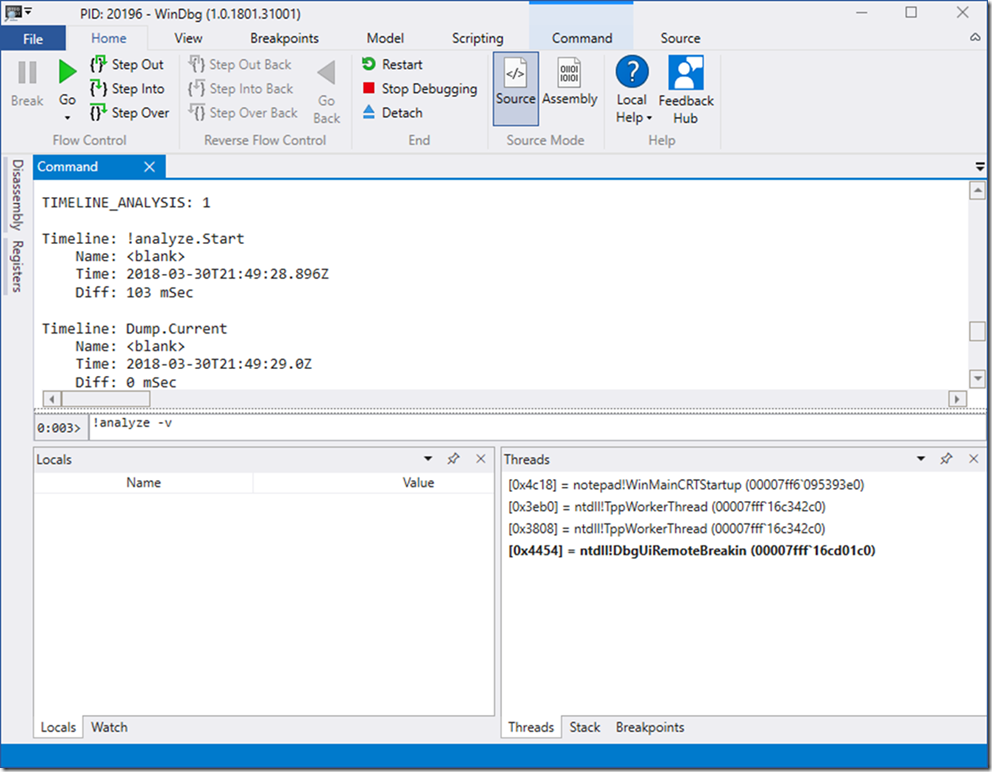
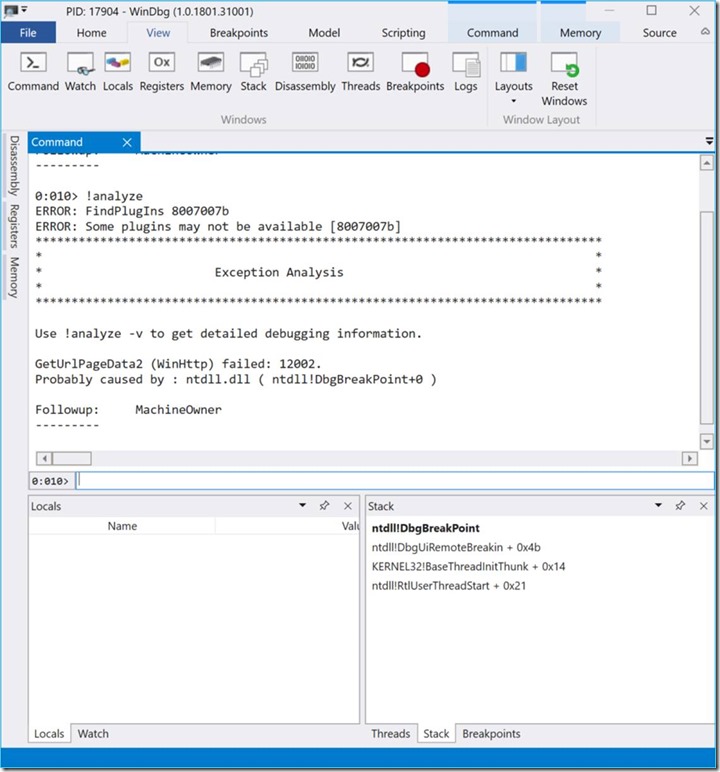
!analyze -v (Display information about the current exception or bug check; verbose)
11. Common Kernel mode debugging commands:
!analyze
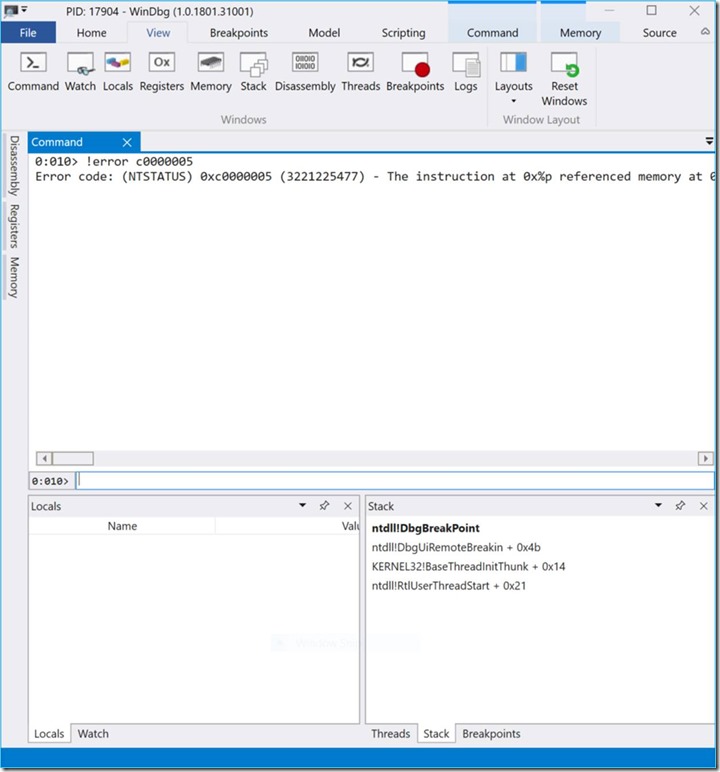
!error (plus error code, e.g. “!error c0000005)
12. Useful links:
Debugging Using WinDbg Preview:
https://docs.microsoft.com/en-us/windows-hardware/drivers/debugger/debugging-using-windbg-preview
Getting Started with WinDbg Microsoft Docs:
https://docs.microsoft.com/en-us/windows-hardware/drivers/debugger/getting-started-with-windbg
Common WinDbg Commands:
http://windbg.info/doc/1-common-cmds.html
WinDbg on Channel9:
Premier Support for Developers provides strategic technology guidance, critical support coverage, and a range of essential services to help teams optimize development lifecycles and improve software quality. Contact your Application Development Manager (ADM) or email us to learn more about what we can do for you.

0 comments