

In this post, App Dev Manager Andy Moore shows how to create cross-organizational reports for Azure DevOps with Power BI.
When using Azure DevOps to manage teams, backlogs, work items and bugs there are tools available for quick reporting and understanding of the current state of the project. Dashboards provide an easily digestible view of daily activities, sprint burndowns, and team velocity through clear visualizations, and Queries give the ability to define reports and charts for evaluation and analysis.
However, when there is a need for cross-organization understanding there is currently no native ability in Azure DevOps to construct these same style dashboards or analytic presentations. To address this need, Microsoft Power BI can be utilized to retrieve data, process and aggregate results, and present clear and concise information to key stakeholders.
Power BI is a powerful tool for analyzing and understanding data. Through constructed visualizations and dashboards, insights can quickly be obtained and used for further research and discussions. In the case of Azure DevOps, having the ability the ability to understand project metrics across organizations is extremely valuable, especially in situations where greater collaboration or team improvements can be made.
Azure DevOps Data and Power BI OData Queries
To manipulate data from Azure DevOps it must first be brought into Power BI through the utilization of OData queries. OData querying is the recommended method for accessing Azure DevOps data from Power BI as this takes advantage of the Azure DevOps Analytics service, an optimized engine for reporting and aggregation. With OData, query statements can be constructed which extract, filter, select, and aggregate results on the server before being returned to the caller, providing an efficient approach to pre-processing data.
To demonstrate, and to provide a real-scenario example, I’ve first prepared two demo Azure DevOps organizations: premierDeveloperDemo and premierDeveloperDemo2. Within these I’ve created projects using the Azure DevOps Demo Generator (https://azuredevopsdemogenerator.azurewebsites.net/):
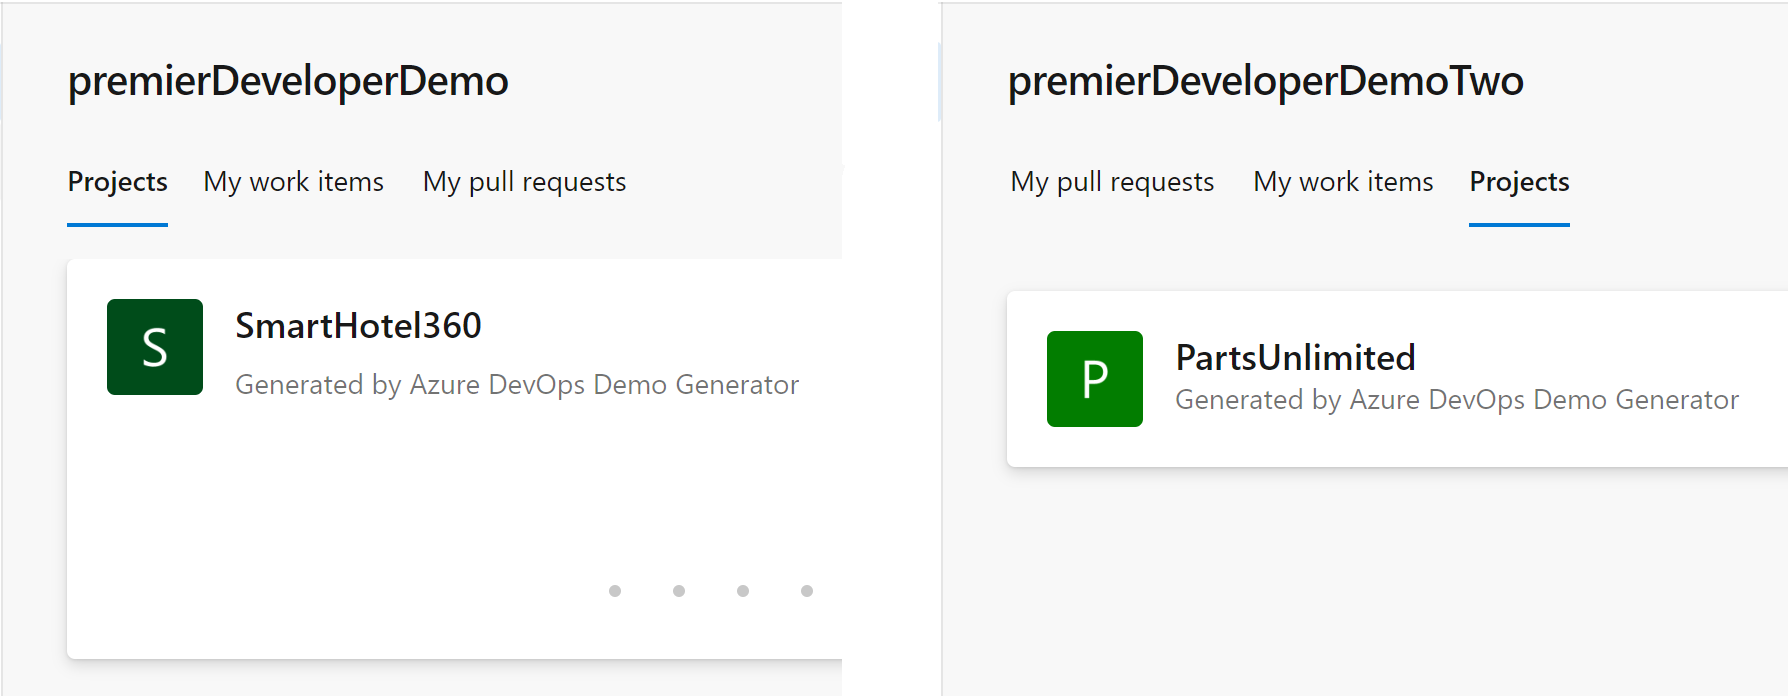
As a scenario, a simple report needs to be constructed denoting the total number of projects across organizations, which will require accessing both and querying to get project count. This will all be done through Power BI.
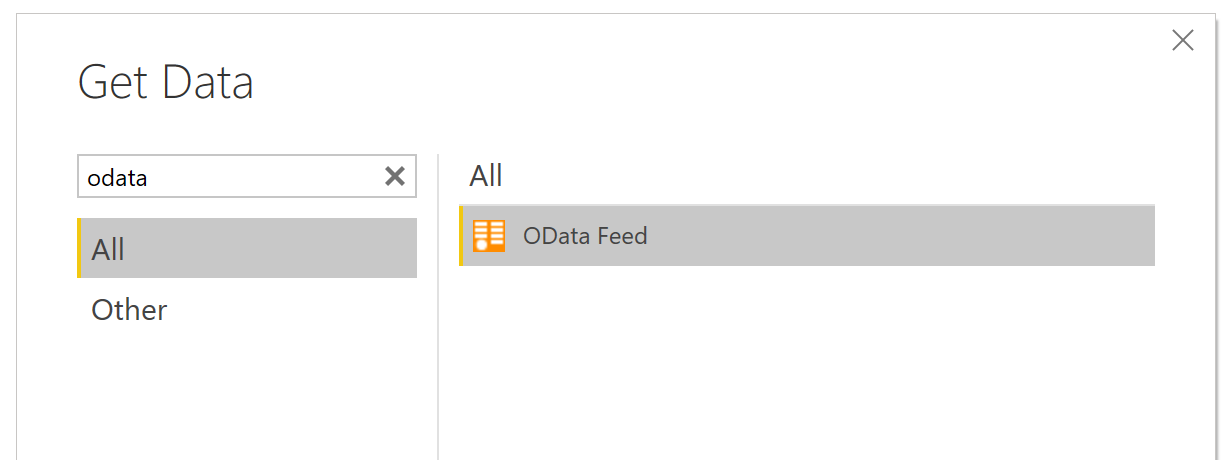
First, within Power BI the data sources need to be defined. To do this, open Power BI Desktop and navigate to Get Data. In the modal window which appears, filter the selection to OData:
In our given scenario, a query needs to be constructed to obtain the projects contained with an organization. This is available via the following:

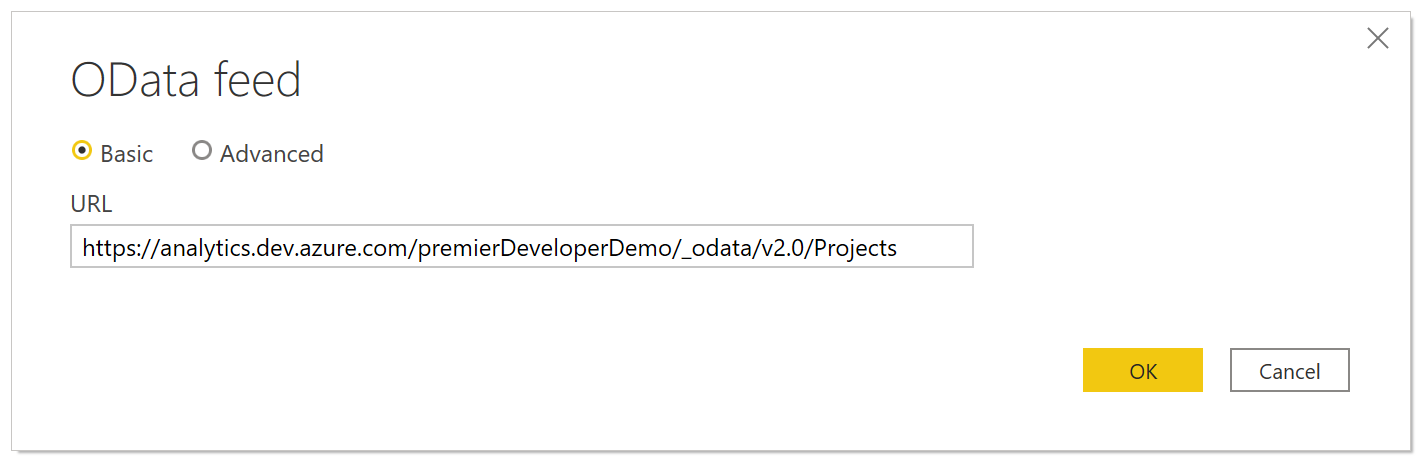
Once the query is submitted Power BI will prompt for credentials to connect to the Azure DevOps Analytics service. As these organizations and identity are tied to Azure Active Directory the sign in will be done through the Organizational Account option; otherwise a Personal Access Token can be generated and utilized for sign in (see https://docs.microsoft.com/en-us/azure/devops/organizations/accounts/use-personal-access-tokens-to-authenticate?view=azure-devops).
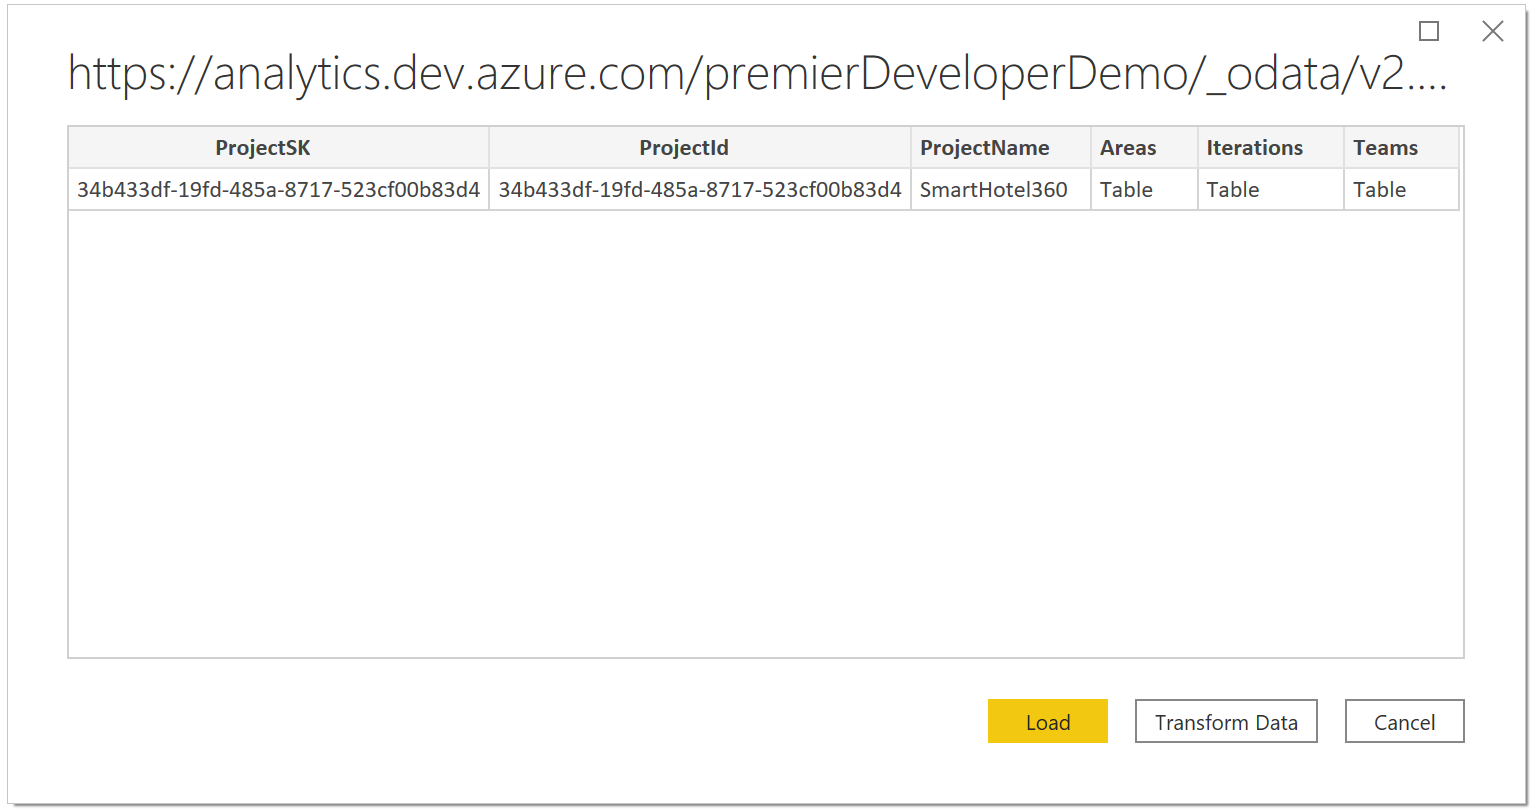
After authorized, the query will execute a preview of results returned, including the project ID and Name.
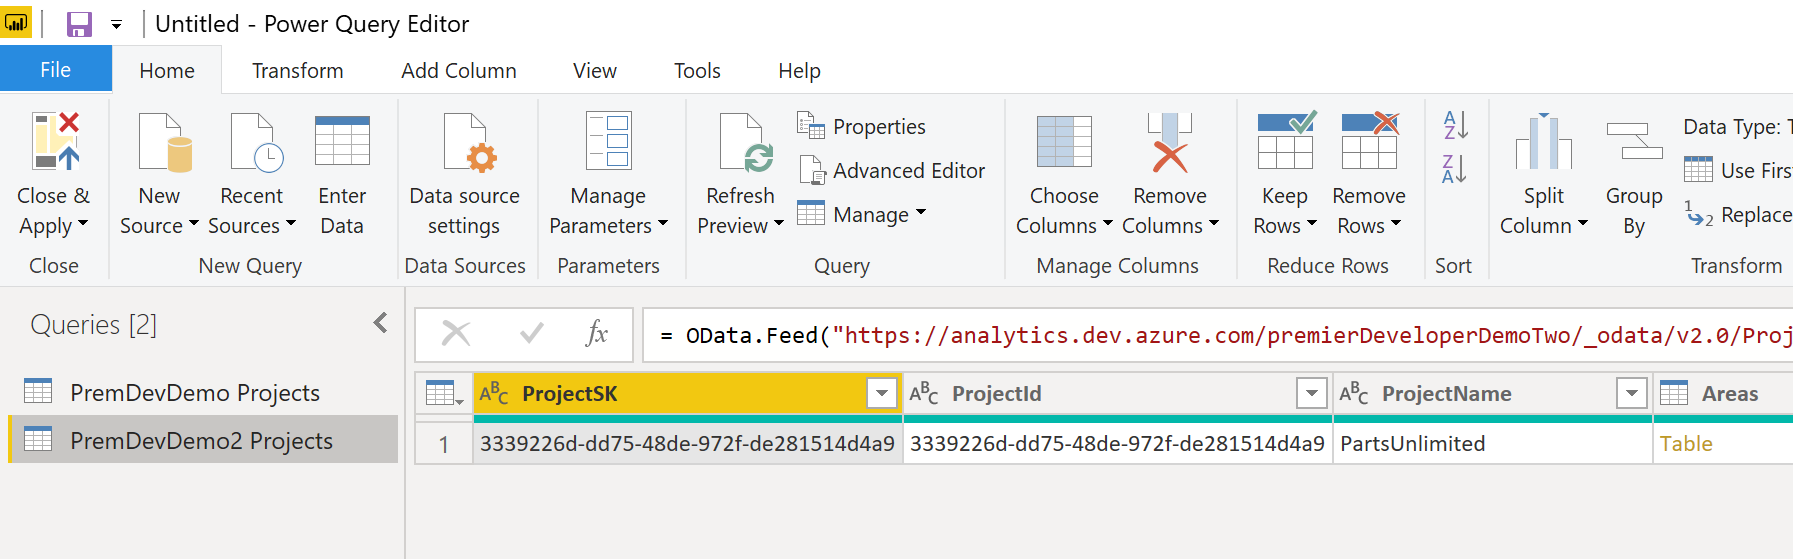
Following the same process for the second organization, another query will be created in Power BI containing the list of projects for this second org. Below is the result for the two demo organizations (as displayed in the Power Query Editor):
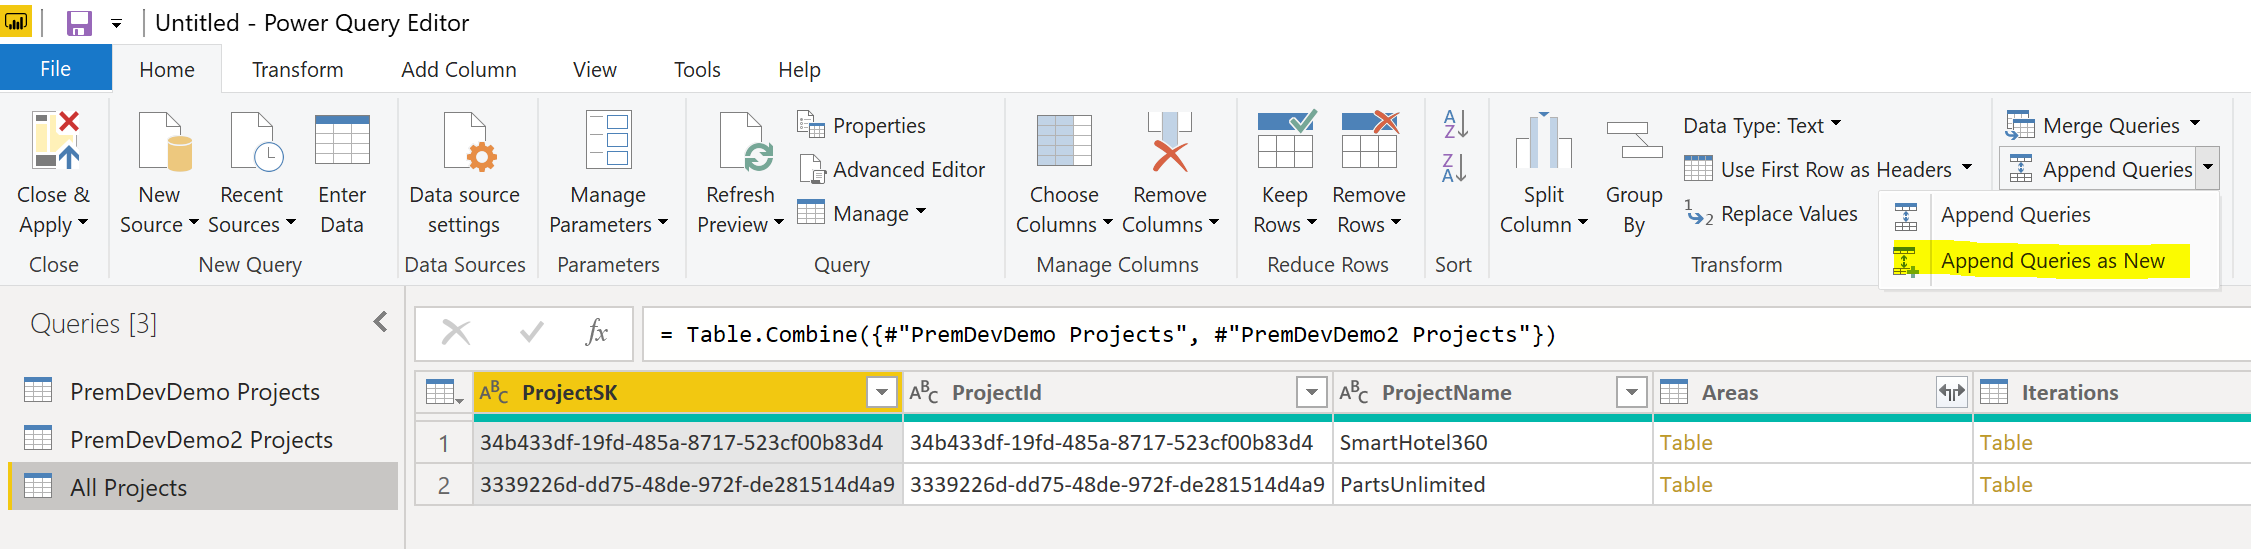
With both queries loaded the Append Queries as New command can be used to create a singular table with both results:
This now gives data for multiple organizations in a single table. However, what if we are interested in more than just two orgs? In the above approach we directly specified the Azure DevOps organization in the OData query command. By following this pattern, each organization could be loaded to Power BI by creating new data sources and retrieving manually. However, if examining across many organizations it would be tedious and inefficient to repeat these steps for each. To address, we’ll create a custom function which invokes the OData command and returns the result.
The first step in creating a function is to understand the variable component, which is this case is the name of the organization. To manage this, a new parameter needs to be created which is done through the Manage Parameters dialog:
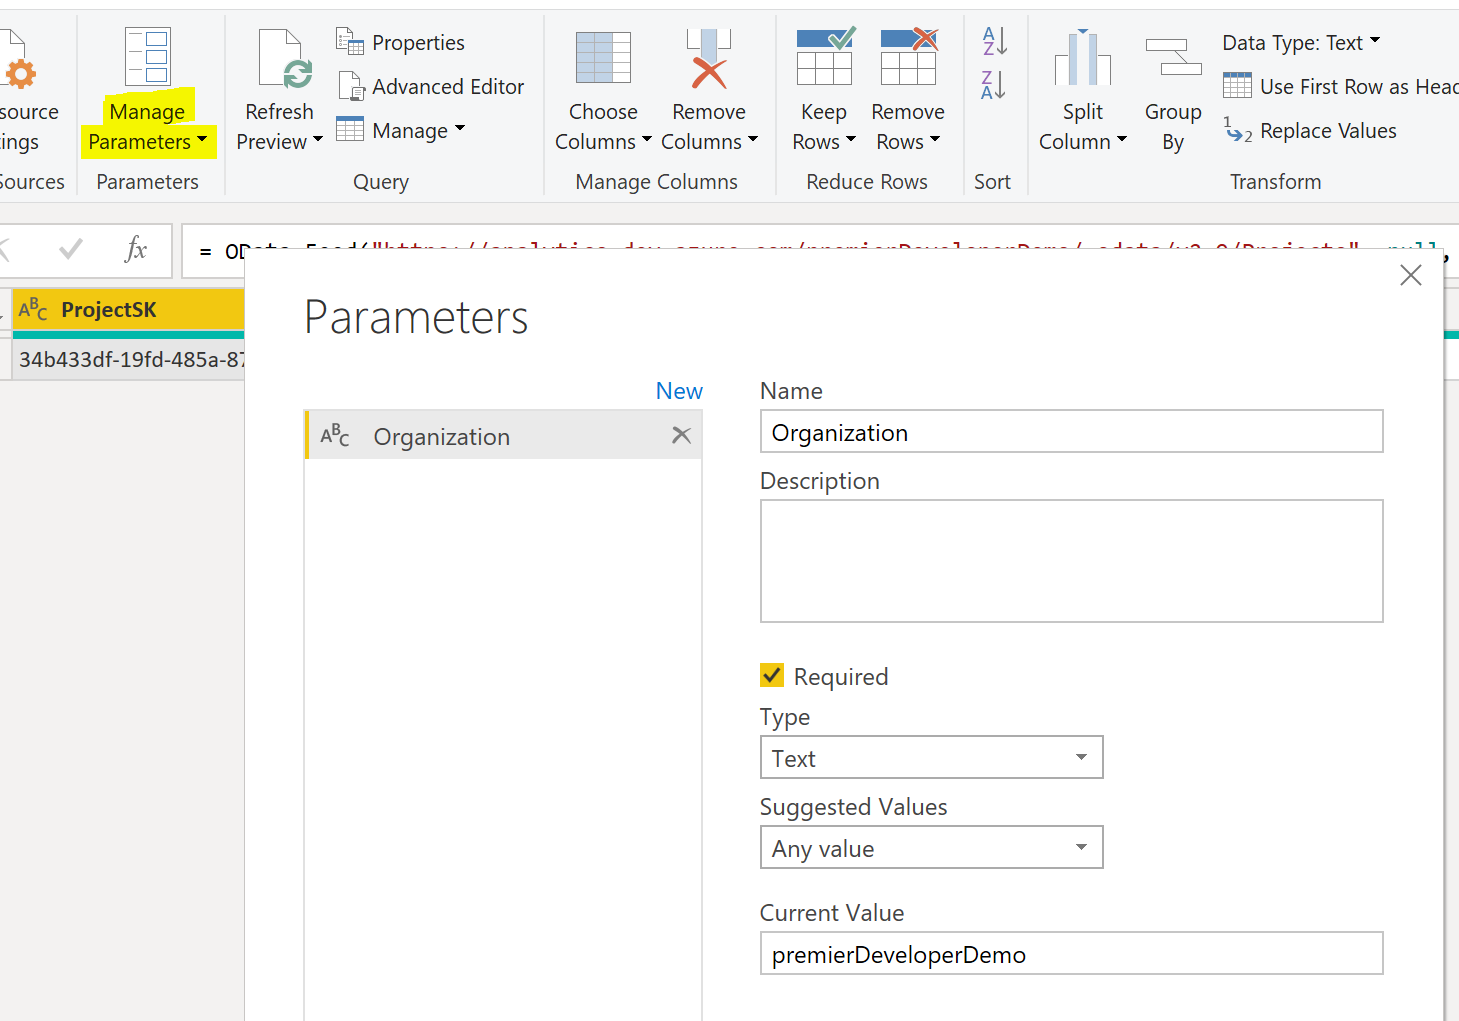
A new parameter needs to be added; in this example a parameter named Organization of type Text has been created and a default value supplied. Once saved, we need to update the OData query which can be done by updating the source of the original data source.
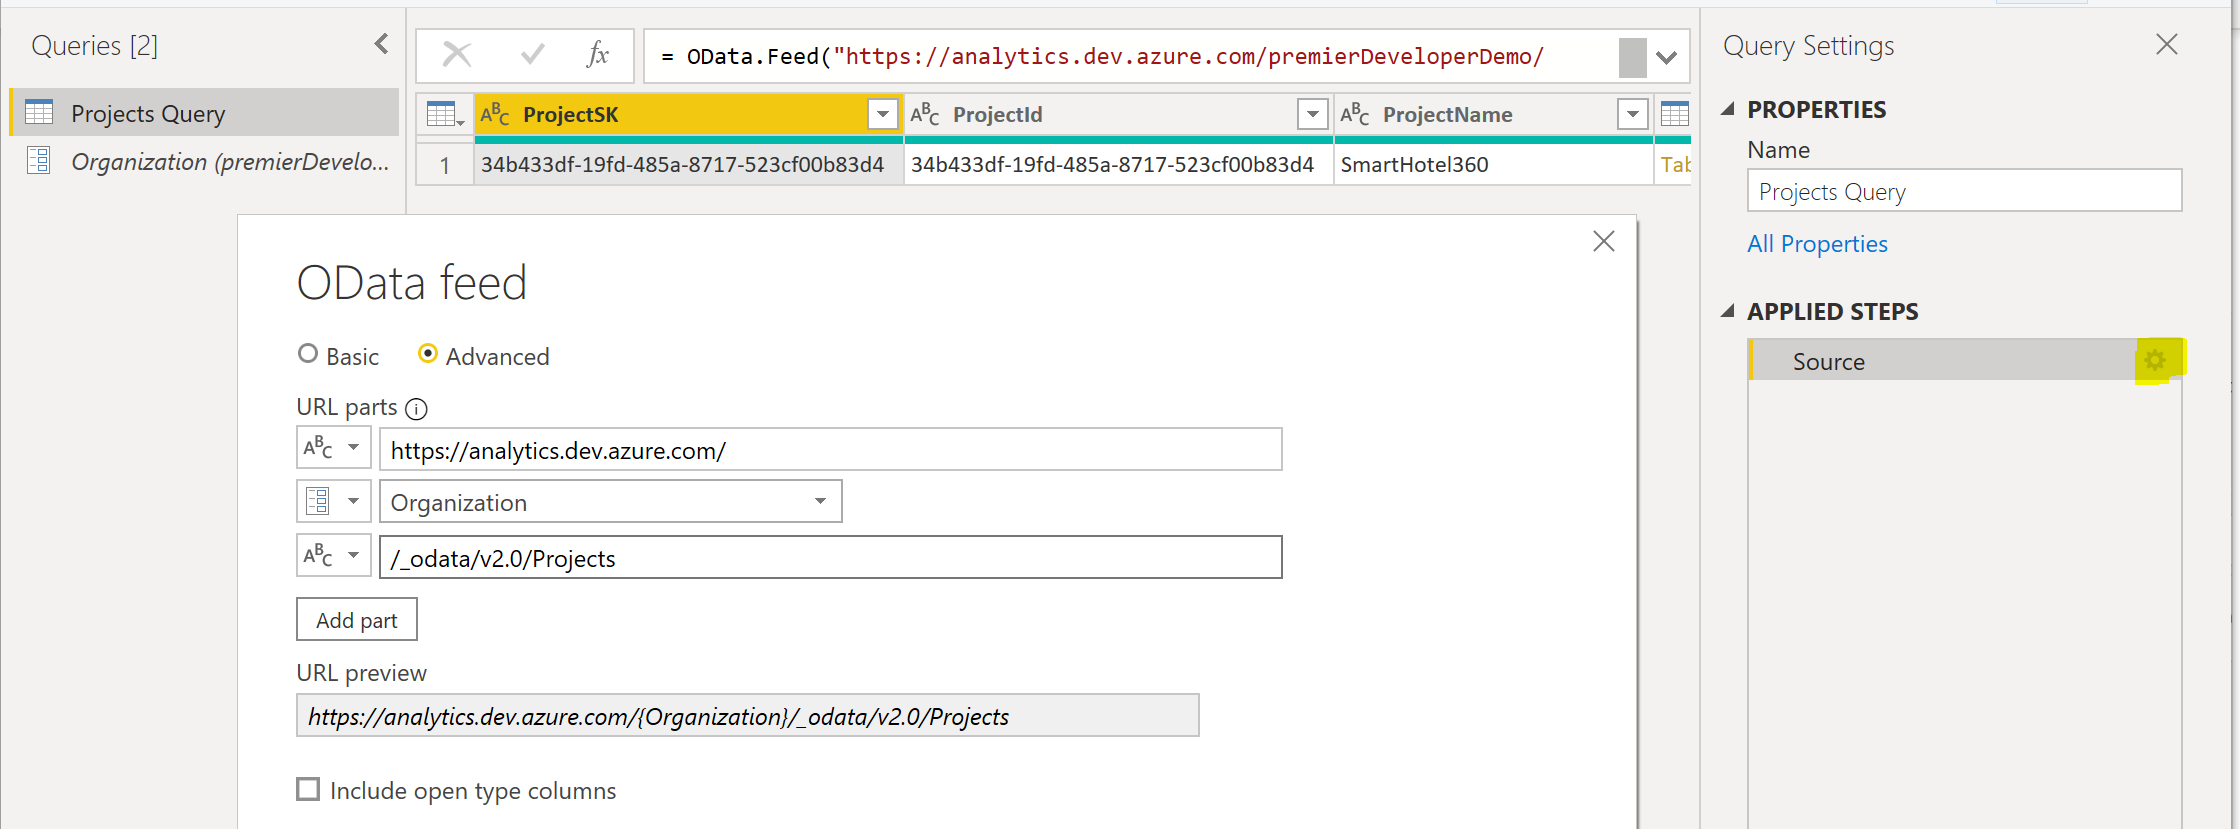
In clicking the gear icon on the Source step of the original query a modal entry will open populated with the original source. Rather than keep with a Basic statement, we’ll choose the Advanced option to open more fields. In the URL parts area, the single endpoint URL can be broken into parts. Doing this, there is the option to have one of these parts be of type parameter, which in this case is the newly created Organization parameter item:
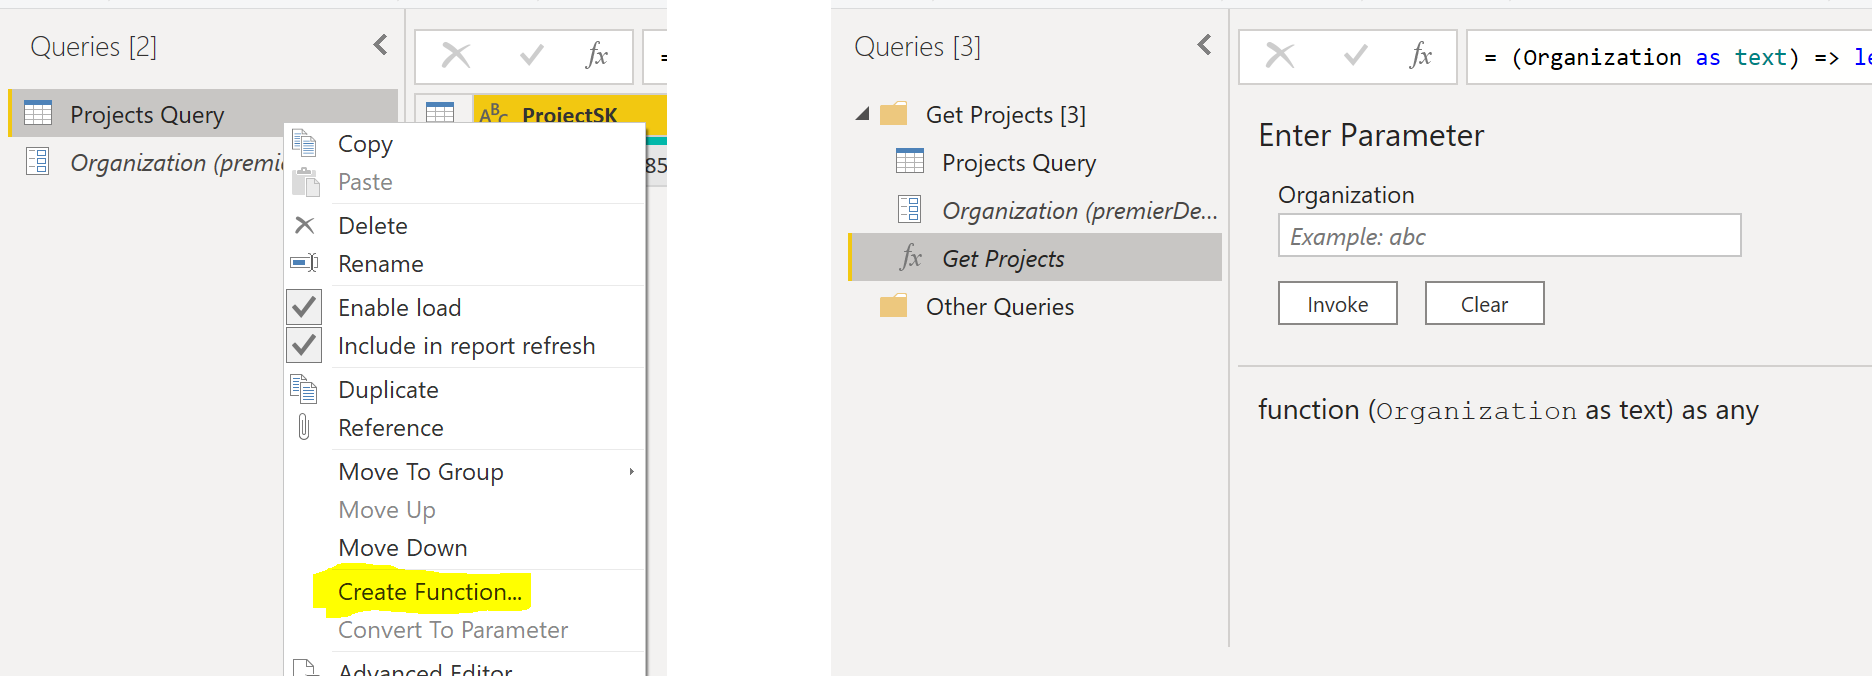
After saving, there is still one final step to create the custom function. On the query (in this demonstration I’ve renamed to Projects Query), right-click and choose Create Function from the context menu. Power BI will then automatically generate the function components:
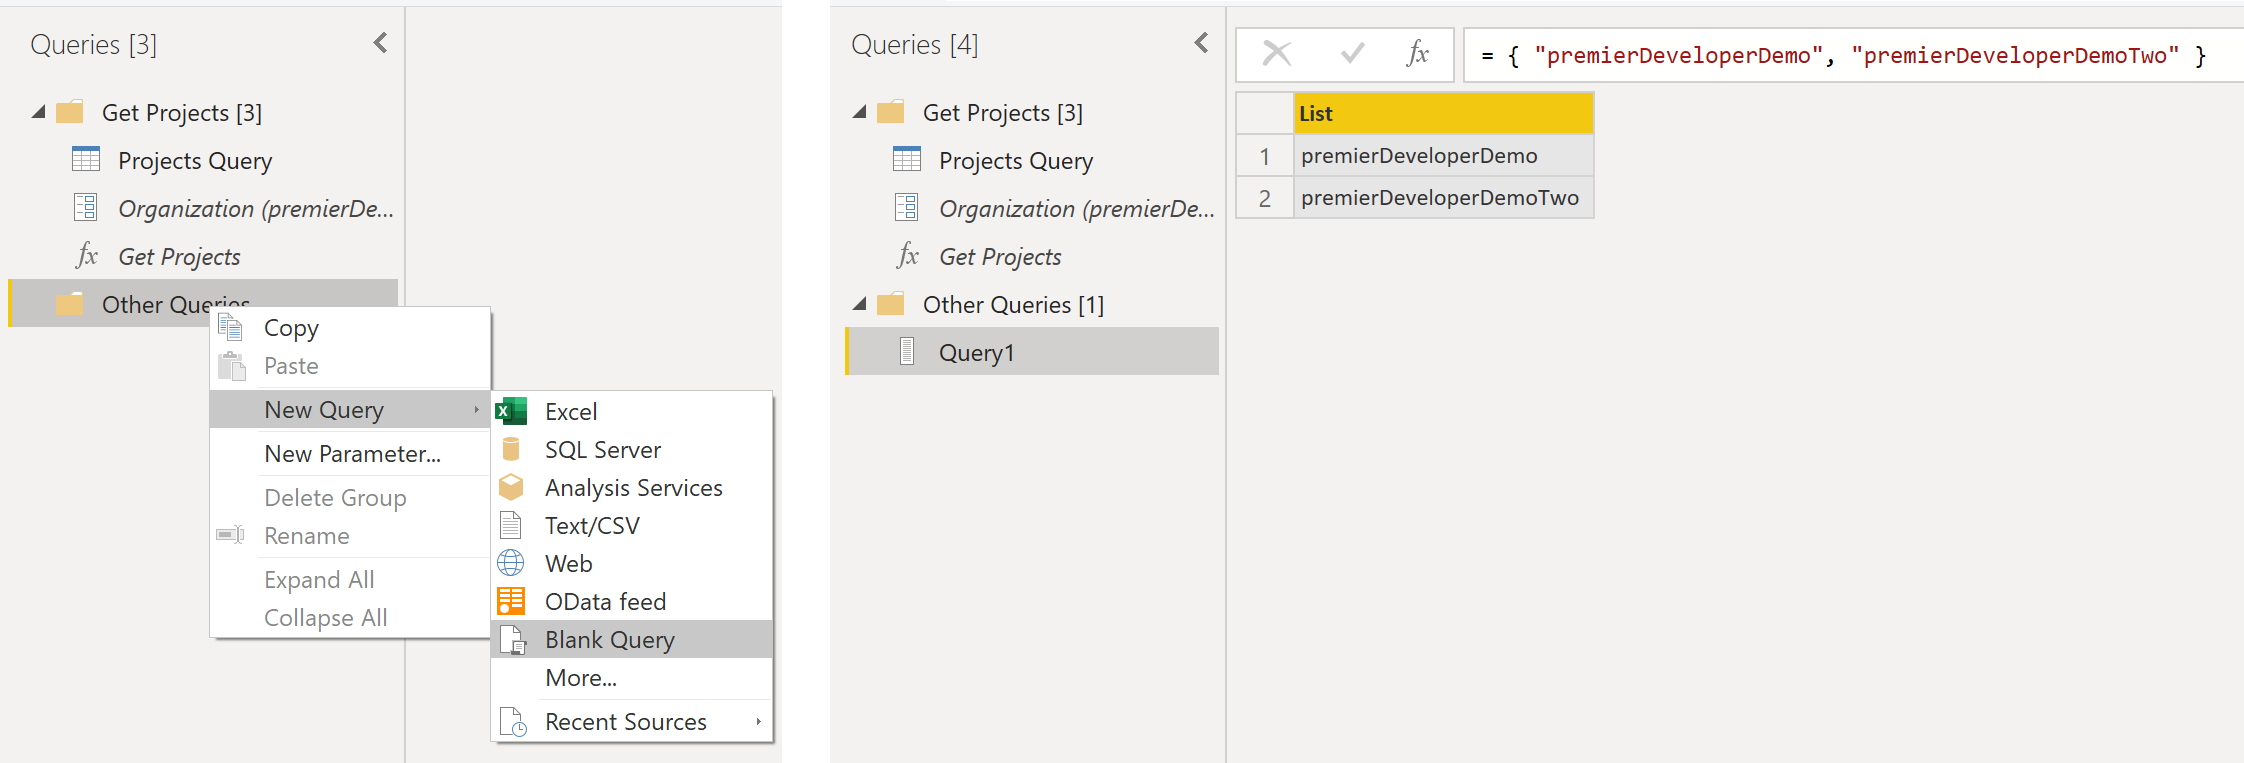
This is now ready to be used as a common method for retrieving a list of projects for any organization. To get from our demo orgs we’ll start with a blank query, and in the Source manually enter the list of Azure DevOps organizations we’re interested in:
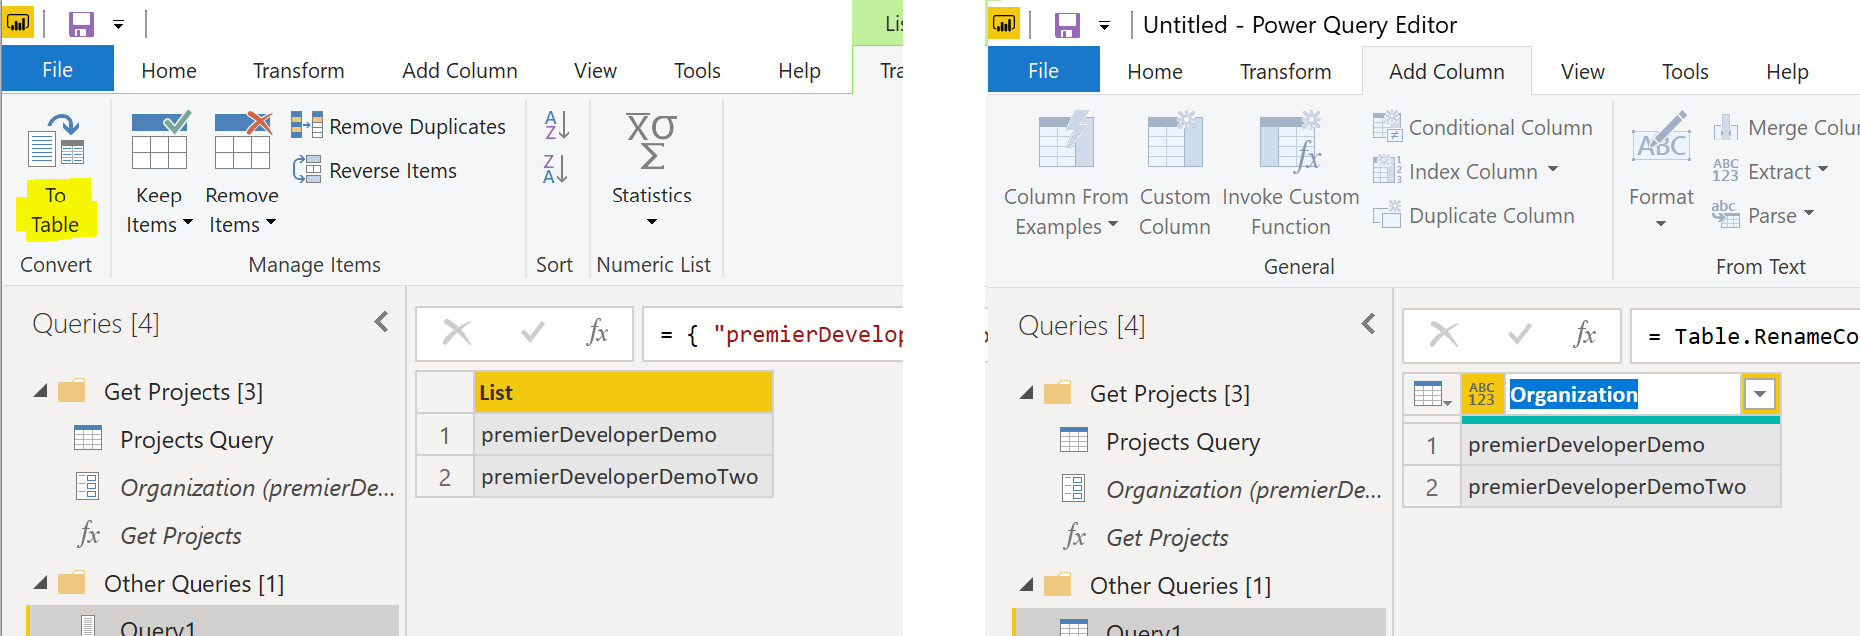
With the list created, it will need to be converted to a table in order to manage and manipulate columns (such as renaming, as was done in this example):
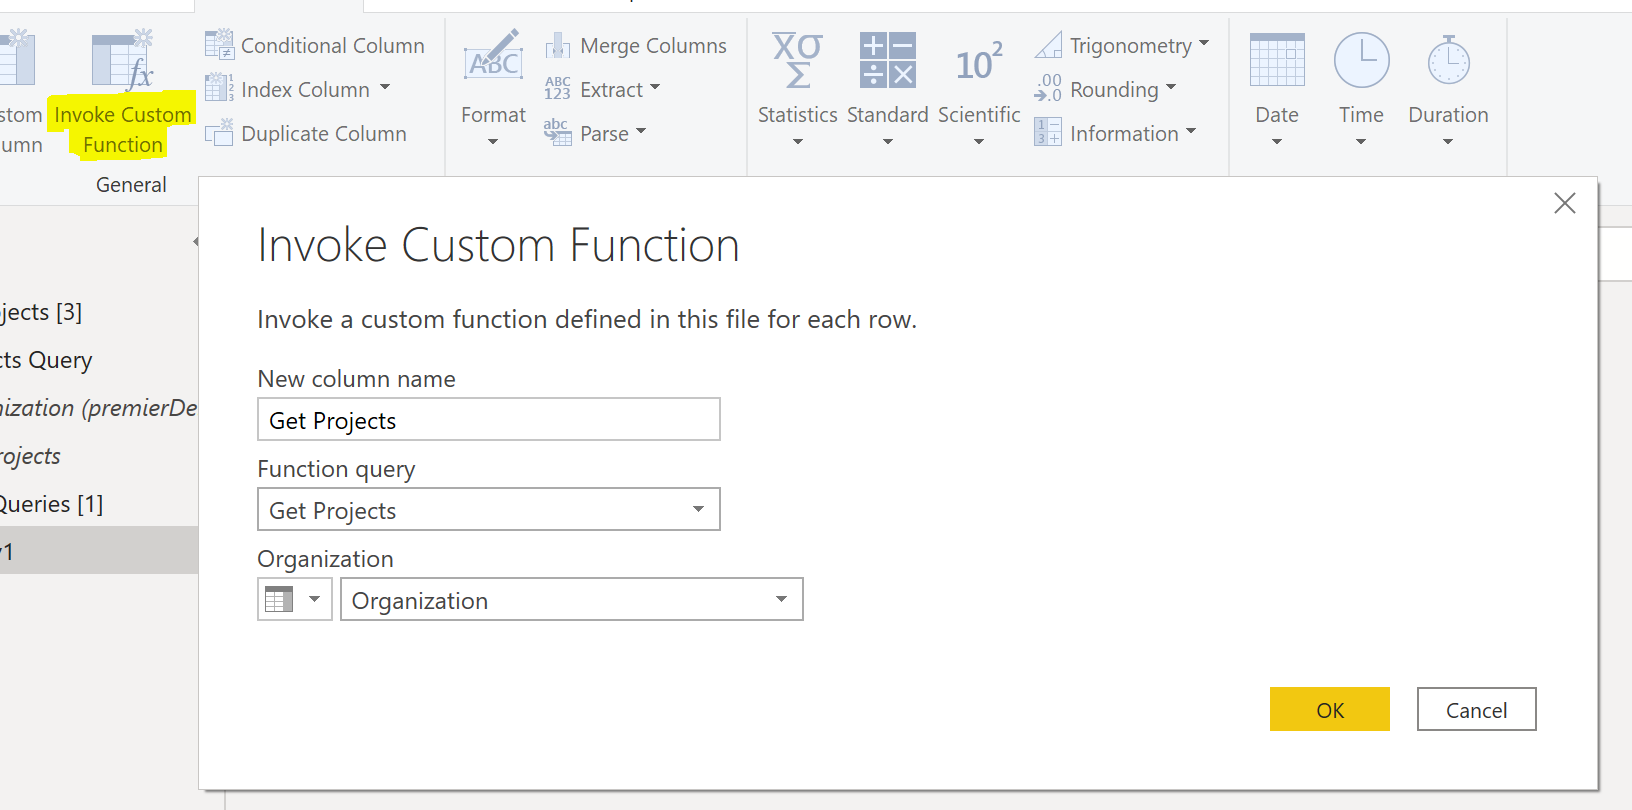
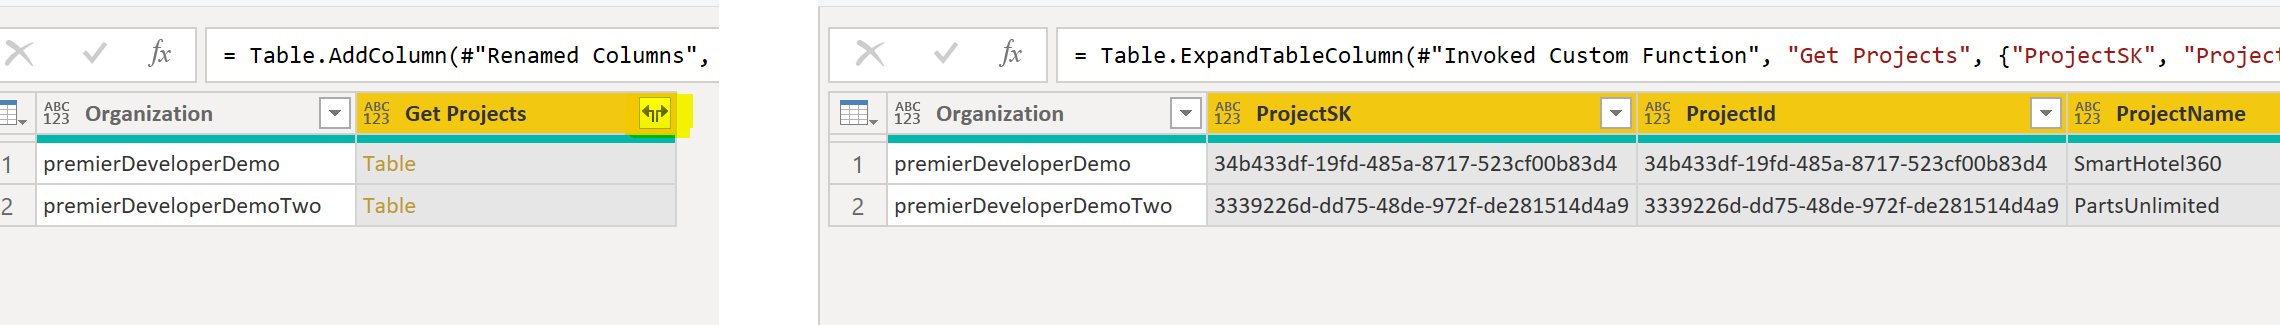
With the table created, the custom function can be invoked. By selecting from the toolbar, a dialog will open which prompts for the function name, and once chosen the required parameters will auto-populate. In the case of the Get Projects function, there is only a single value required and Power BI will attempt to infer the correct column value to use. As the column was renamed above to Organization, Power BI automatically matched this to the input of the function:
Once applied, the results can be expanded to view the full details:
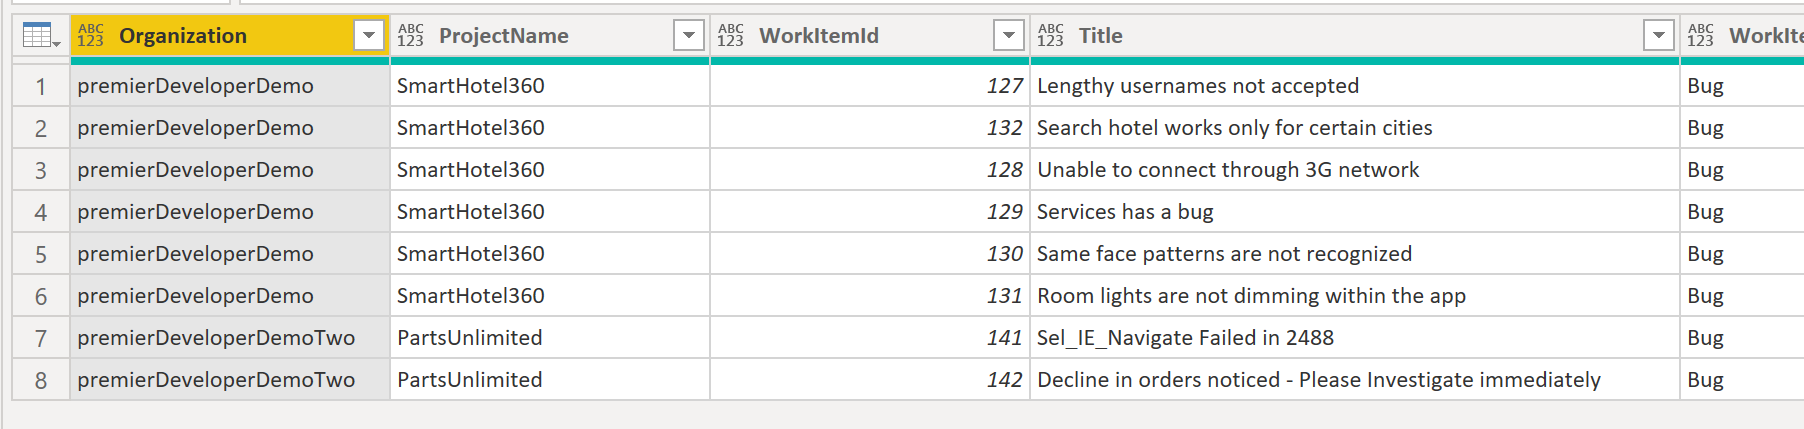
The benefit of this approach is that by abstracting the steps necessary for data retrieval any number of DevOps organizations can be entered (or loaded from an Excel file or other source) without the need for creating and appending multiple new queries. In addition, this can be expanded upon; for example the function could return not just a list of projects but a list of teams within the projects as well as all users assigned to those teams. Once the OData query is defined, it can be parameterized for use across all organizations for which access is available. As an example, the OData query below will return all bugs within all projects within an organization:

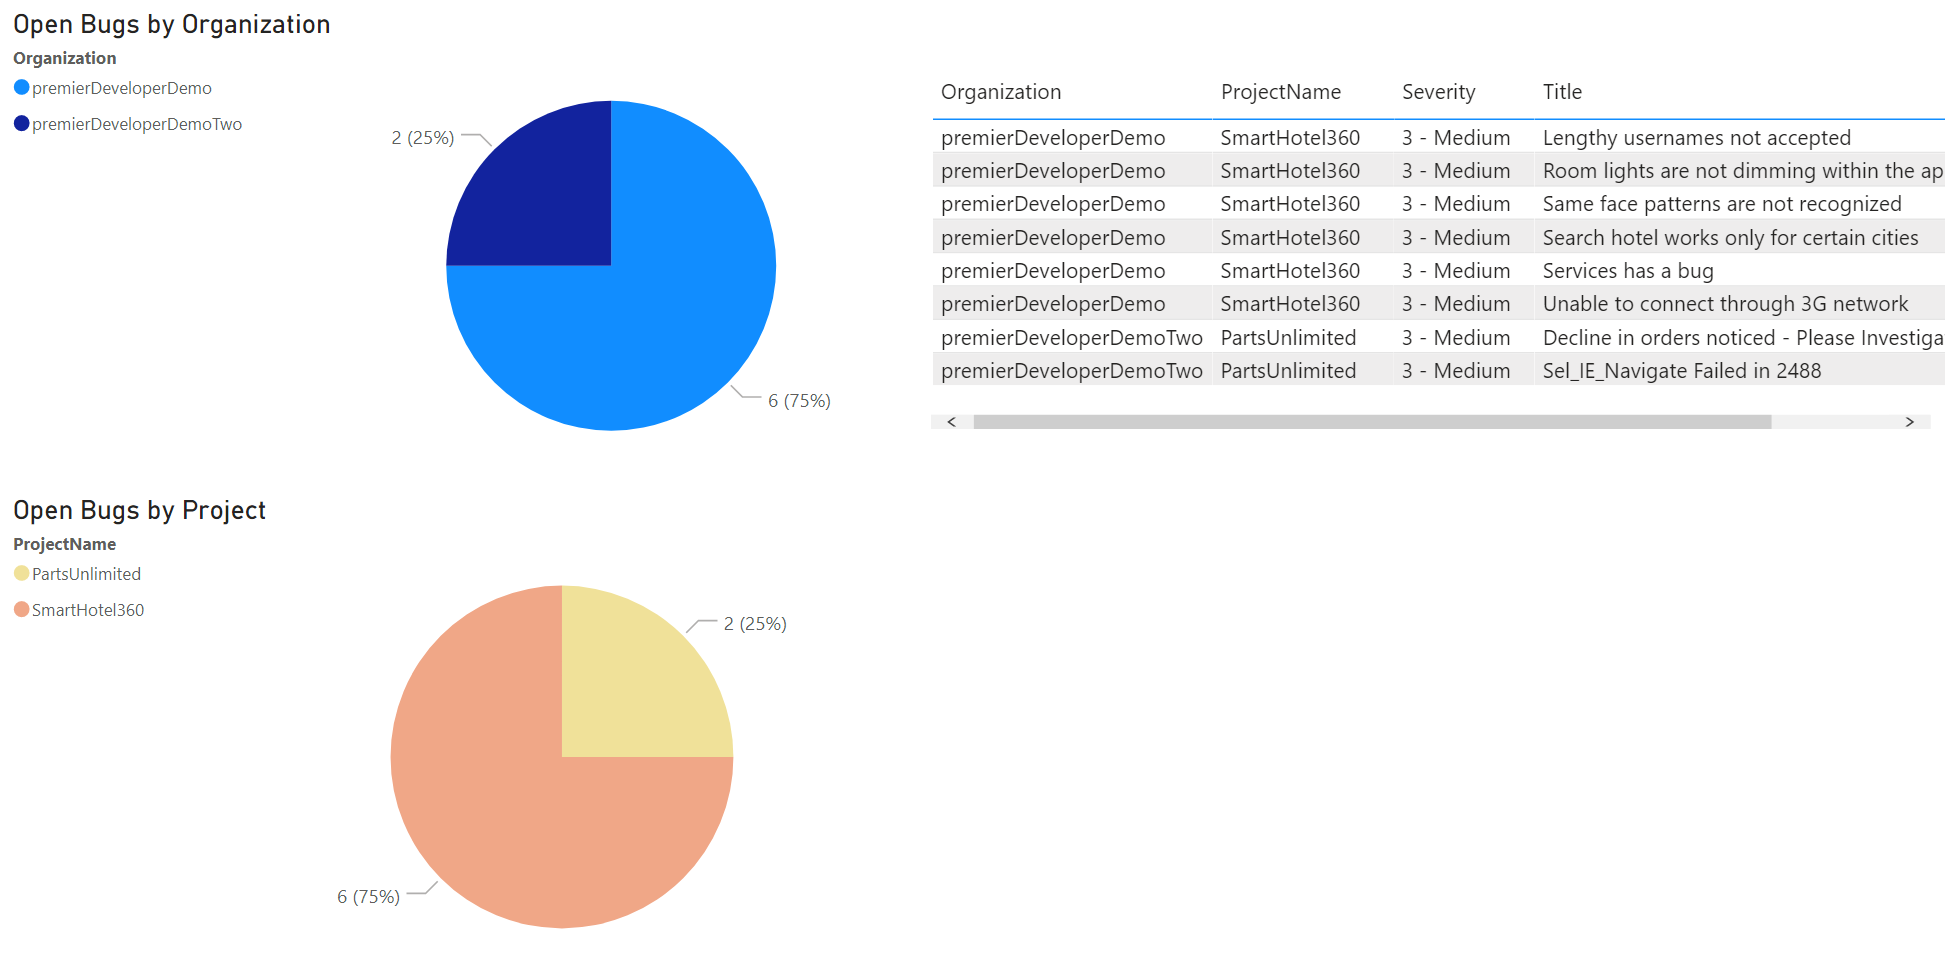
With these results Power BI visualizations can be constructed which provide for quick analysis and evaluation across Azure DevOps organizations, project, and teams.
As demonstrated, data retrieval from Azure DevOps using OData is a straightforward process and with Power BI can easily be aggregated and presented through reports and dashboards. With greater visibility, teams can continue to better collaborate, improve, and deliver.
For additional information on the various topics covered in this post:
- About Power BI integration: https://docs.microsoft.com/en-us/azure/devops/report/powerbi/overview?view=azure-devops
- Create a Power BI report with an OData Query: https://docs.microsoft.com/en-us/azure/devops/report/powerbi/create-quick-report-odataq?view=azure-devops
- Extend Analytics with OData (Preview) quick reference: https://docs.microsoft.com/en-us/azure/devops/report/extend-analytics/quick-ref?view=azure-devops
0 comments