The Metrics view in New Timing Captures allows you to graph the duration of PIX CPU events and any counter values that are reported using the PIXReportCounter API. Graphing event durations is fairly discoverable in the UI, but I think it’s less well-known that counter values can be graphed as well.
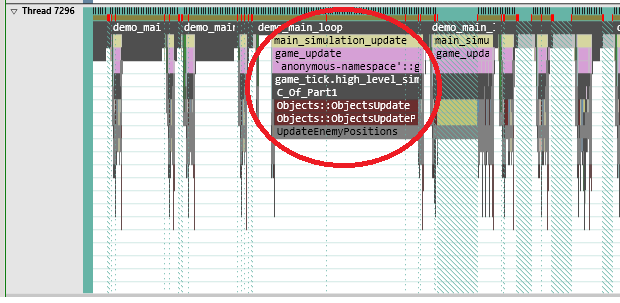
Annotating your title with calls to PIXReportCounter and graphing the resulting custom data in the Metrics view can be very helpful when investigating performance outliers. For example, in the following picture, when looking at the frame that is highlighted, it’s fairly obvious that the duration of the UpdateEnemyPositions PIX event is responsible for the unusually long frame time. In the neighboring frames, the UpdateEnemyPositions PIX event is of small enough duration that it doesn’t even appear at this zoom level, while in the longer frame, the duration of UpdateEnemyPositions really stands out.

Even though we can see that the duration of UpdateEnemyPositions in this frame is an outlier when compared to other frames, we still don’t know why. There are a few alternatives for gathering more detailed information. First, if you collected CPU samples when the capture was taken, you might be able to glean some useful information by looking at the sample callstacks in the Element Details view. Another approach would be to go back to your title and add additional calls to PIXBeginEvent in functions called by UpdateEnemyPositions (if there are any).
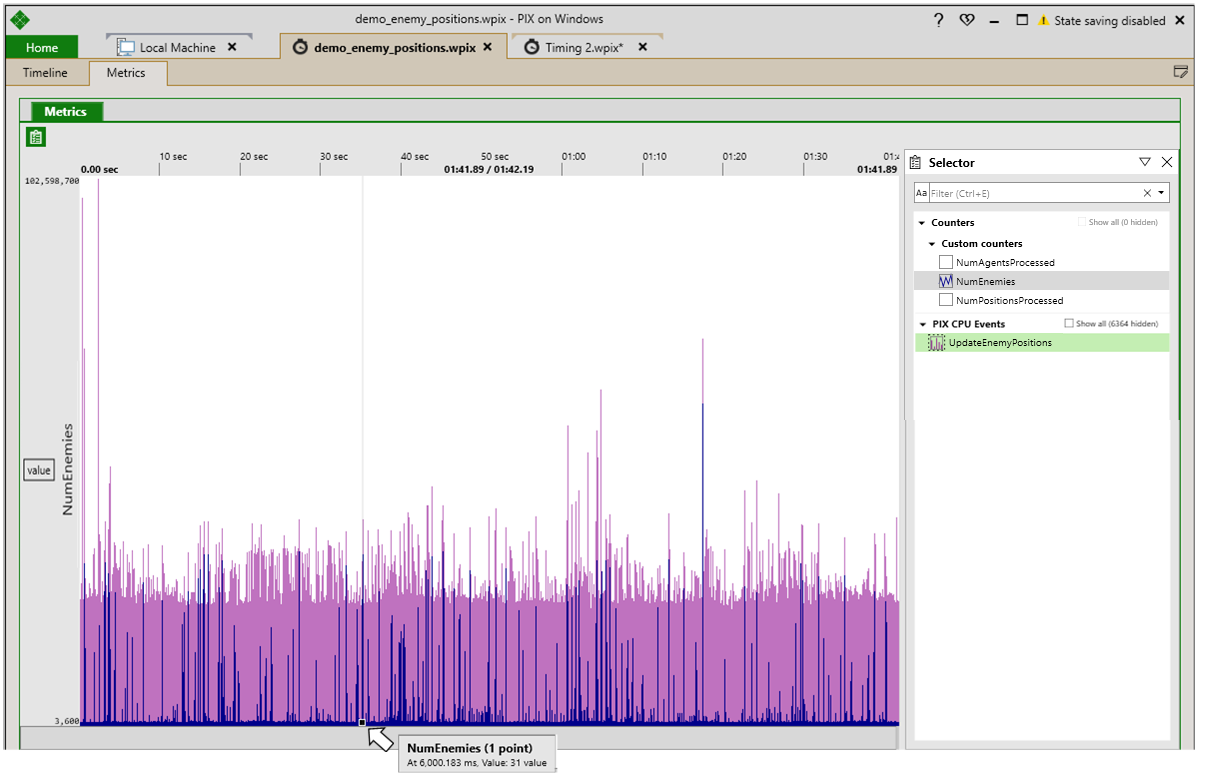
Sometimes, however, more than just a call stack or an event duration is needed to diagnose an issue. In this case, if the title reported custom data using PIXReportCounter, I can graph that data, along with the duration of UpdateEnemyPositions to see if that helps me establish some correlations that will help determine what’s going on.
For example, say that my title is reporting custom data related to updating enemy positions such as “the number of enemies”. PIXReportCounter let’s you specify custom data such at this by specifying string/value pairs:
PIXReportCounter(L”NumEnemies”, m_numEnemies);
Now, I can use the Metrics view to graph the custom counter data. All counters added with PIXReportCounter show up under a Custom counters node in the Metrics view Selector panel. By graphing my custom data along with the duration of related events, I can start to determine whether a correlation exists between the value of my custom counter and the duration of an event. In our example, we can see if spikes in the duration of UpdateEnemyPositions always correlate to relatively large values in the NumEnemies counter. If so, that probably provides a clue on the algorithm in your title to optimize.

Steven Pratschner
PIX Team

0 comments