
GPU Captures
A PIX GPU capture records all the Direct3D 12 API calls made by the game, including their parameter data. These calls can later be replayed, which enables a range of debugging and analysis features.
It is not always possible for PIX to successfully take a GPU capture if a game is calling Direct3D 12 in invalid ways. We make a best effort to be robust even in the case of incorrect usage patterns, but this is inevitably sometimes a case of garbage in, garbage out. If you are having difficulty taking GPU captures, try using the D3D12 Debug Layer and GPU-Based Validation to find and fix any bad API calls.
Windows GPU captures are not in general portable across different GPU hardware and driver versions. In most cases a capture taken on one machine will play back correctly on other similar GPUs from the same hardware family, and captures of some games may even work across GPUs from entirely different manufacturers, but it is also possible that something as trivial as a driver upgrade could break compatibility with older captures. We can only guarantee playback will succeed when the GPU and driver are exactly the same, so PIX will warn before starting analysis if there is not a perfect match. Proceed past this at your own risk!
PIX has limited support for multiple GPUs. It will always play back GPU captures on a single adapter, regardless of how many adapters the application used. PIX allows you to select the playback adapter from a drop-down in the PIX toolbar. PIX will attempt to auto-select the playback adapter if the application used only one adapter.
When you first load a GPU capture, data is loaded and parsed but the API calls are not yet actually played back on your GPU. Not all parts of PIX are fully functional while in this state. To enable complete functionality you must start analysis, which instructs PIX to create a Direct3D 12 device and play back the capture in the various ways necessary to extract information. The analysis Start button is found in the PIX toolbar:
![]()
Event List
The Events view shows all the API calls that were recorded into a GPU capture. There is a separate list for each Direct3D 12 queue (graphics, compute, or copy) that was used by the game:
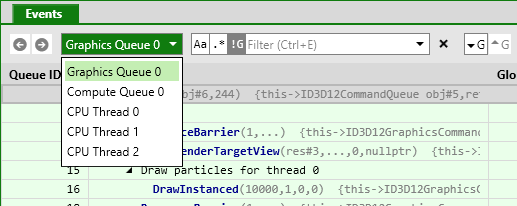
The event list can be filtered, optionally using regular expressions. By default it only shows events that resulted in actual rendering work for the GPU hardware, as opposed to simply preparing state for use by later operations. To include non-GPU events, click the button labelled !G.
The event list works best when the game has been instrumented with the PIX event runtime.
More information about each event, such as the full set of API call parameters, is available in the Event Details view. This is not included in the default PIX layout, but can be accessed via the Views button in the upper right corner of the main PIX window.
Timing Data and Counters
The Collect Timing Data button (top right of the Events view) instructs PIX to replay the captured API calls a number of times, measuring how long each operation takes to execute on the GPU. Results from more than one replay are averaged to reduce measurement noise.
For best results, do not interact with your computer while PIX is collecting timing data, and close any other applications that might be using the GPU.
There are two sources of GPU timing information:
- Start-of-pipe timestamps report when the GPU starts processing each piece of work. Note that this data is only available when running Windows 10 build 14393 or greater with a suitable graphics driver. Timing data takes longer to collect if start-of-pipe timestamps are not available.
- End-of-pipe (EOP) timestamps report when the GPU has finished processing each piece of work.
Because GPUs are massively parallel and deeply pipelined, it is common for more than one piece of work to be executing at the same time, and for adjacent operations to overlap. PIX measures time in two different ways that can offer insight into the parallel execution model of the hardware:
- Execution Duration is measured from the start-of-pipe to the end-of-pipe timestamp of each separate piece of work. When measured in this way, GPU work items that run in parallel with prior items may appear longer than if they were run in isolation due to contention on the GPU.
- EOP Duration is measured from the previous item’s end-of-pipe (EOP) timestamp to this item’s EOP timestamp. Work items that run in parallel with prior items will therefore appear shorter than if they ran in isolation, and some items may even be reported as zero duration if they completed entirely in parallel with the previous item.
The Timeline view displays one or more lanes showing the timing of each GPU operation. There is a separate lane containing EOP Duration data for each queue (graphics, compute, or copy) used by the game, plus a single lane showing Execution Duration data (where available) combined across all the queues.

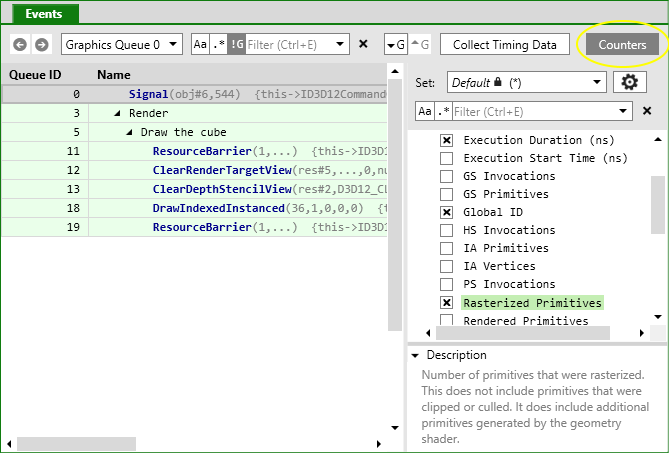
A range of counter values including Execution Duration, EOP Duration, Execution Start Time, and other values such as Samples Rendered or VS Invocations can be added to the Events view by clicking the Counters button at the top right of that view. When running on a supported AMD, Intel or NVIDIA GPU with a recent driver, you will also have access to a large number of GPU counters, which can provide much deeper insight into the rendering and performance characteristics of your workload.
Note that PIX on Windows does not currently overlap GPU work on different queues while analyzing timing in GPU Captures. Consider taking a Timing Capture if you want to see overlapping async compute timing data. In GPU Captures, if a game uses async compute to execute rendering and compute work simultaneously, then PIX will instead measure first one and then the other. This may result in shorter reported durations for each part of the work compared to how it would execute inside the original game (due to reduced contention on the GPU) but a longer total time (due to reduced parallelization).
GPU Occupancy
On NVIDIA GPUs, in addition to timing data, PIX can gather information about shader execution within a single event.
GPUs are usually constructed as a hierarchy of repeated blocks, where each level might share a resource. For example, an imaginary GPU might be structured like this:

GPUs execute shaders by breaking up the shader work into waves (these are also called warps or wave fronts). In the above diagram, each blue block is capable of executing one wave. Each green block could execute up to four waves.
As all the blues share a single set of registers, if a workload needs all the registers then only one wave at a time can execute in the green block. In this case the occupancy of the green block would be 1, out of a total possible occupancy of 4.
At any point in time, all the green blocks may be executing different number of waves. Of the four green blocks above, one might be executing 3 waves, another 2 waves, and the remaining 1 wave. PIX boils all this data down to a single value – the maximum occupancy, which would be 3 in this example.
This is presented in PIX in the Occupancy lane, which shows the maximum occupancy, separated by shader stage. This is an indication of how much work the GPU is able to do in parallel – higher bars show better GPU utilization. Here is an example from a relatively large capture:

Selecting an event will overlay the maximum occupancy for just that event (this example is from a very small capture that has just a couple of draws):
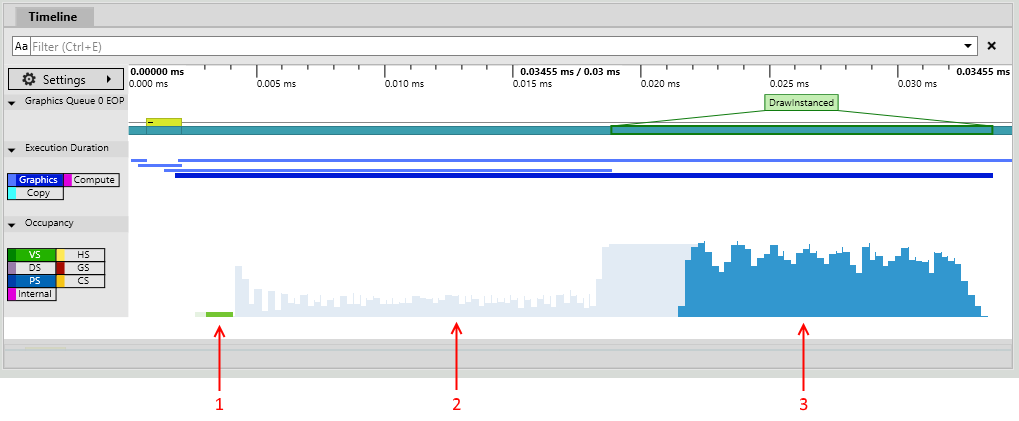
The annotations on this image show:
- Vertex shader work for this event.
- Pixel shader work for events other than this one.
- Pixel shader work for this event.
Pipeline State
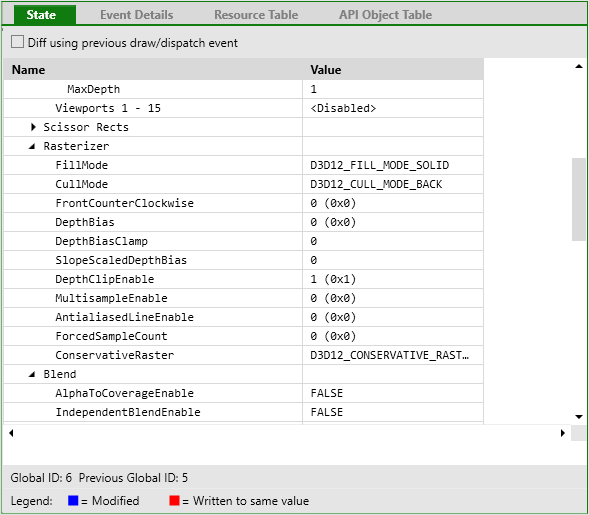
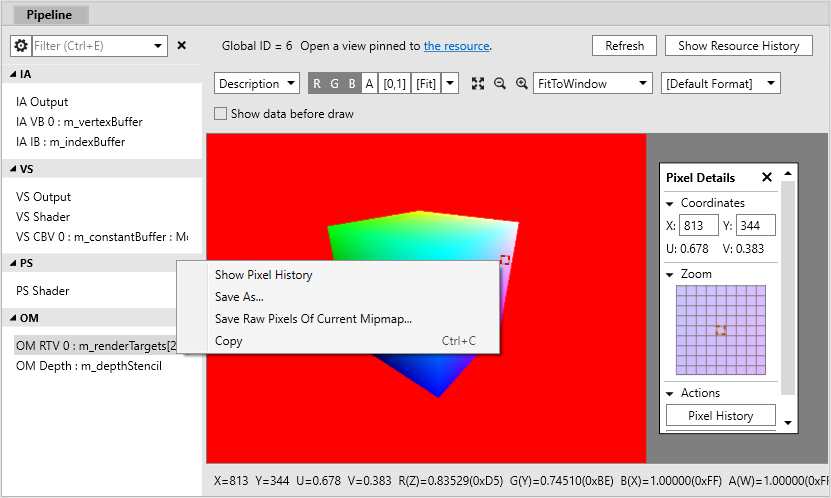
After selecting an event in the Events view, the State and Pipeline views (found in the Pipeline tab) will show details of the Direct3D state at the time of that event. Here you can view what resources are bound to the pipeline, shader code, inputs, outputs, and the currently bound rendertarget(s).

Right-clicking on part of the rendertarget (OM RTV) and choosing Show Pixel History will bring up a view showing all the draws that affected the selected pixel.
To debug a pixel shader: right-click on one of the entries in the Show Pixel History list, and choose Debug This Pixel.
To debug a vertex shader: right-click on one of the vertices shown under VS Output, and choose Debug This Vertex.

Shader Edit & Continue
HLSL shader code can be edited directly inside PIX, allowing you to immediately see the effect of your changes on rendering results or performance. This can be useful for prototyping and optimizing shaders, as it can greatly reduce the turnaround time when trying out different ideas.
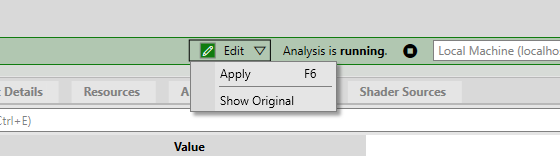
Edit & continue is accessed from the Pipeline view. After selecting a shader you can edit its code however you like, then click Edit->Apply:
Other views (such as OM RTV 0) will update to show the effect of your change. You may find it useful to dock more than one instance of the Pipeline view next to each other in order to view rendertarget results at the same time as editing shader code.
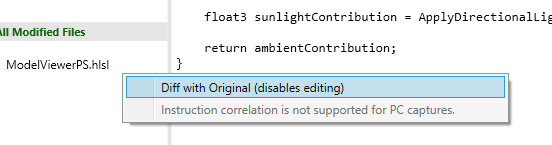
If you lose track of exactly what you have changed, right-click on the shader code and choose Diff with Original:
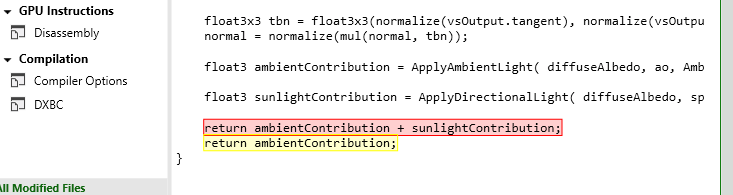
This will bring up an inline diff view, showing the original code in red with your changes in yellow:
Note that PIX on Windows (unlike Xbox) does not yet support saving modified shaders back into the .pix3 file.
Visualizers
Rendertarget visualizers are available in the Pipeline view when inspecting the contents of a rendertarget. The default Image visualizer just shows the image as normal:

The Wireframe visualizer highlights whatever geometry was rendered by the currently selected draw call in wireframe. Visible pixels are shaded green, while culled pixels (eg. backfacing triangles or failed depth test) are red:

The Overdraw visualizer colors the scene according to how many pixels were shaded and written to the framebuffer after passing the depth test. This is useful for understanding how well things like front-to-back sorting or a z prepass are working to reduce overdraw:

The Depth Complexity visualizer is similar to Overdraw, but disables the depth test so the results indicate only how many triangles overlapped each pixel, regardless of sorting or z prepass:

Finally, the Pixel Cost visualizer colors the scene according to the approximate rendering cost of each pixel. The brightest areas of the resulting image indicate which parts were the most expensive to render. Pixel cost is estimated by dividing the Execution Duration of each draw call by the number of resulting pixel shader invocations, and accumulating that average each time a pixel is written. This includes the cost of other pipeline stages, but it is divided evenly across all pixel shader invocations in the draw without accounting for varying vertex density, etc.
Warnings
PIX can automatically detect and warn about inefficient D3D12 usage patterns, and can also analyze captures using the D3D12 Debug Layer. To check for warnings, use the Run Warnings Analysis, Run Debug Layer or Run GPU Validation buttons in the Warnings view (GPU validation is a superset of the debug layer, but can take longer to run).

We would greatly appreciate feedback about whether useful warnings are reported for your title, any false positives, suggestions for other things you would like PIX to warn about, etc.
PIX currently provides the following warnings:
- Redundant transitions to unused state
- Resource can be transitioned to more constrained state
- Unnecessary DEPTH_WRITE to DEPTH_READ transitions
- Subresource transitioned multiple times within ResourceBarrier() call
- Redundant resource transitions due to resource decay or promotion
- Split Barrier recommendations
- Various other resource barrier warnings (e.g. consecutive calls, potentially incorrect)
- Back-to-back ExecuteCommandLists calls
- Command allocator usage warnings
- Various SetPipelineState warnings (e.g. unused, already set)
- Various D3D12_RESOURCE_FLAGS recommendations (e.g. add DENY_SHADER_RESOURCE)
- ResolveQueryData usage recommendations
- Unnecessary UAV barriers
- Redundant root state updates
- “all_resources_bound” compiler switch recommendations
- High ExecuteIndirect MaxCommandCount values
- Small command lists executed
- High number of ID3D12Fence::GetCompletedValue() calls
- Unused root parameters
- Redundant Set*RootSignature calls
- No Resource Heap Tier 2 usage (if capture device supported Tier 2)
- Device removal (TDR) at capture
- Device removal (TDR) during analysis
- Shader attempted to access out-of-bounds register index
- Descriptor table recommendations (e.g. split parameter up into smaller ranges)
- Recommendations to have more-specialized root signatures
- Descriptor duplication detected
- SRVs that may perform better as CBVs on NVIDIA
- Root sig v1.1 flag usage recommendations
- Structured buffer size recommendations
- Large total number of descriptors detected
- Potential clear color optimizations
- Potentially slow depth/stencil copies on NVIDIA
Accessing the D3D debug layer inside PIX can be useful if you want to take advantage of GPU validation to verify correctness of your Direct3D 12 API usage, but the overhead of the validation makes your game too slow to easily reach the point of interest. Rather than running GPU validation directly against the game itself, you can take a GPU capture of a single frame, then use the PIX Run GPU Validation button to validate only this one frame in isolation.
Dr. PIX
Dr. PIX provides a set of queries which analyze GPU workloads in different ways, measuring statistics and seeing how performance is affected by different ways of modifying the workload. It is accessed in the Tools tab after opening a GPU capture. It will analyze only the selected region of the event list, or the entire capture if nothing is selected. To repeat the analysis on a different part of your capture, change the event list selection, then click the Run Query button inside Dr. PIX.
The Basic Information page measures the GPU time of the selected workload, and compares this against two modified versions of that workload:
- Only 1 pixel changes viewport sizes to 1×1, thus removing almost all pixel shading work and framebuffer/depth writes. The resulting performance improvement indicates how much the workload was bottlenecked by pixel fill work.
- Disable MSAA removes any use of multisampling. The resulting performance improvement indicates how much the workload was bottlenecked by MSAA overheads.

The Depth/Stencil page measures the performance impact of forcing early Z testing.
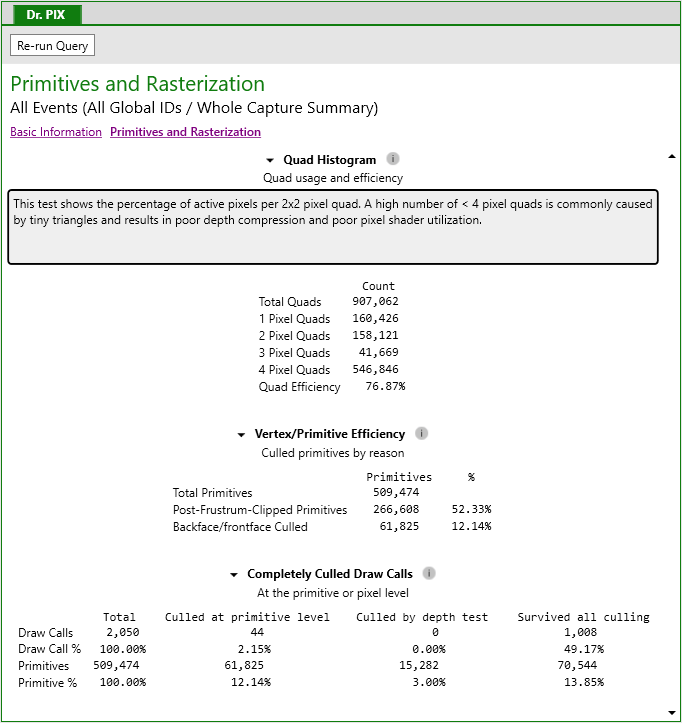
The Primitives and Rasterization page measures how many 2×2 pixel quads were fully vs. partially covered by geometry during triangle rasterization, and how many primitives were culled at different parts of the rendering pipeline:
The Bandwidth page reports statistics about memory and cache utilization.
TDR Debugging
TDRs (aka GPU hang / device removal) can be captured, analyzed, and debugged using PIX GPU captures. PIX requires some additional configuration before this functionality can be used: details here.