


Today we released PIX version 2605.28-preview, which can be downloaded here.
This release complements the new D3D12 Agility SDK that was released today, version 721. This PIX release also includes initial preview versions of a lot of the exciting PIX features that we announced in our GDC session in collaboration with AMD, Intel, NVIDIA and Qualcomm. You can read more about those announcements here, and you can watch our session in the GDC vault.
Please try out these new features and let us know your thoughts. The best ways to reach us are via the Send Feedback button in the PIX UI, and via the #pix channel on the DirectX Discord.
Note: we announced DirectX Dump Files at GDC but they are not quite ready for public use yet. Stay tuned for more announcements in early June!
Features in this release include:
Agility SDK 721 Support
This release includes full capture/replay support for the new D3D features in the preview Agility SDK 720 released today. This includes GUID texture layouts and UAVs of Depth Buffers. For Partial Programs, PIX has full capture/replay support, as well as:
- Visualizers (except below)
- NURI Dr Pix experiment
- Culled Prim Dr PIX experiment
PIX features that don’t currently support partial programs include:
- VS and IA output
- Visualizers: Overdraw, Depth complexity, VRS, Helper lane, Gold image
- Shader Edit and Continue
- Shader Access Tracking (i.e. the ability to see dynamically-indexed resources in your shaders)
- Shader Debugging
Shader Explorer
Shader Explorer is a new tool (though familiar if you have used Xbox PIX) that enables profiling and iteration of shader development across a variety of hardware targets by utilizing IHV offline shader compilers, the same ones that enable Advanced Shader Delivery.
This preview release includes support for static profiling on AMD and Intel hardware. Static profiling includes features such as ISA to HLSL correlation, register pressure, register lifetimes, and more. By utilizing the IHV offline shader compilers, static profiling can target any supported hardware even if you do not have that hardware available in your machine.
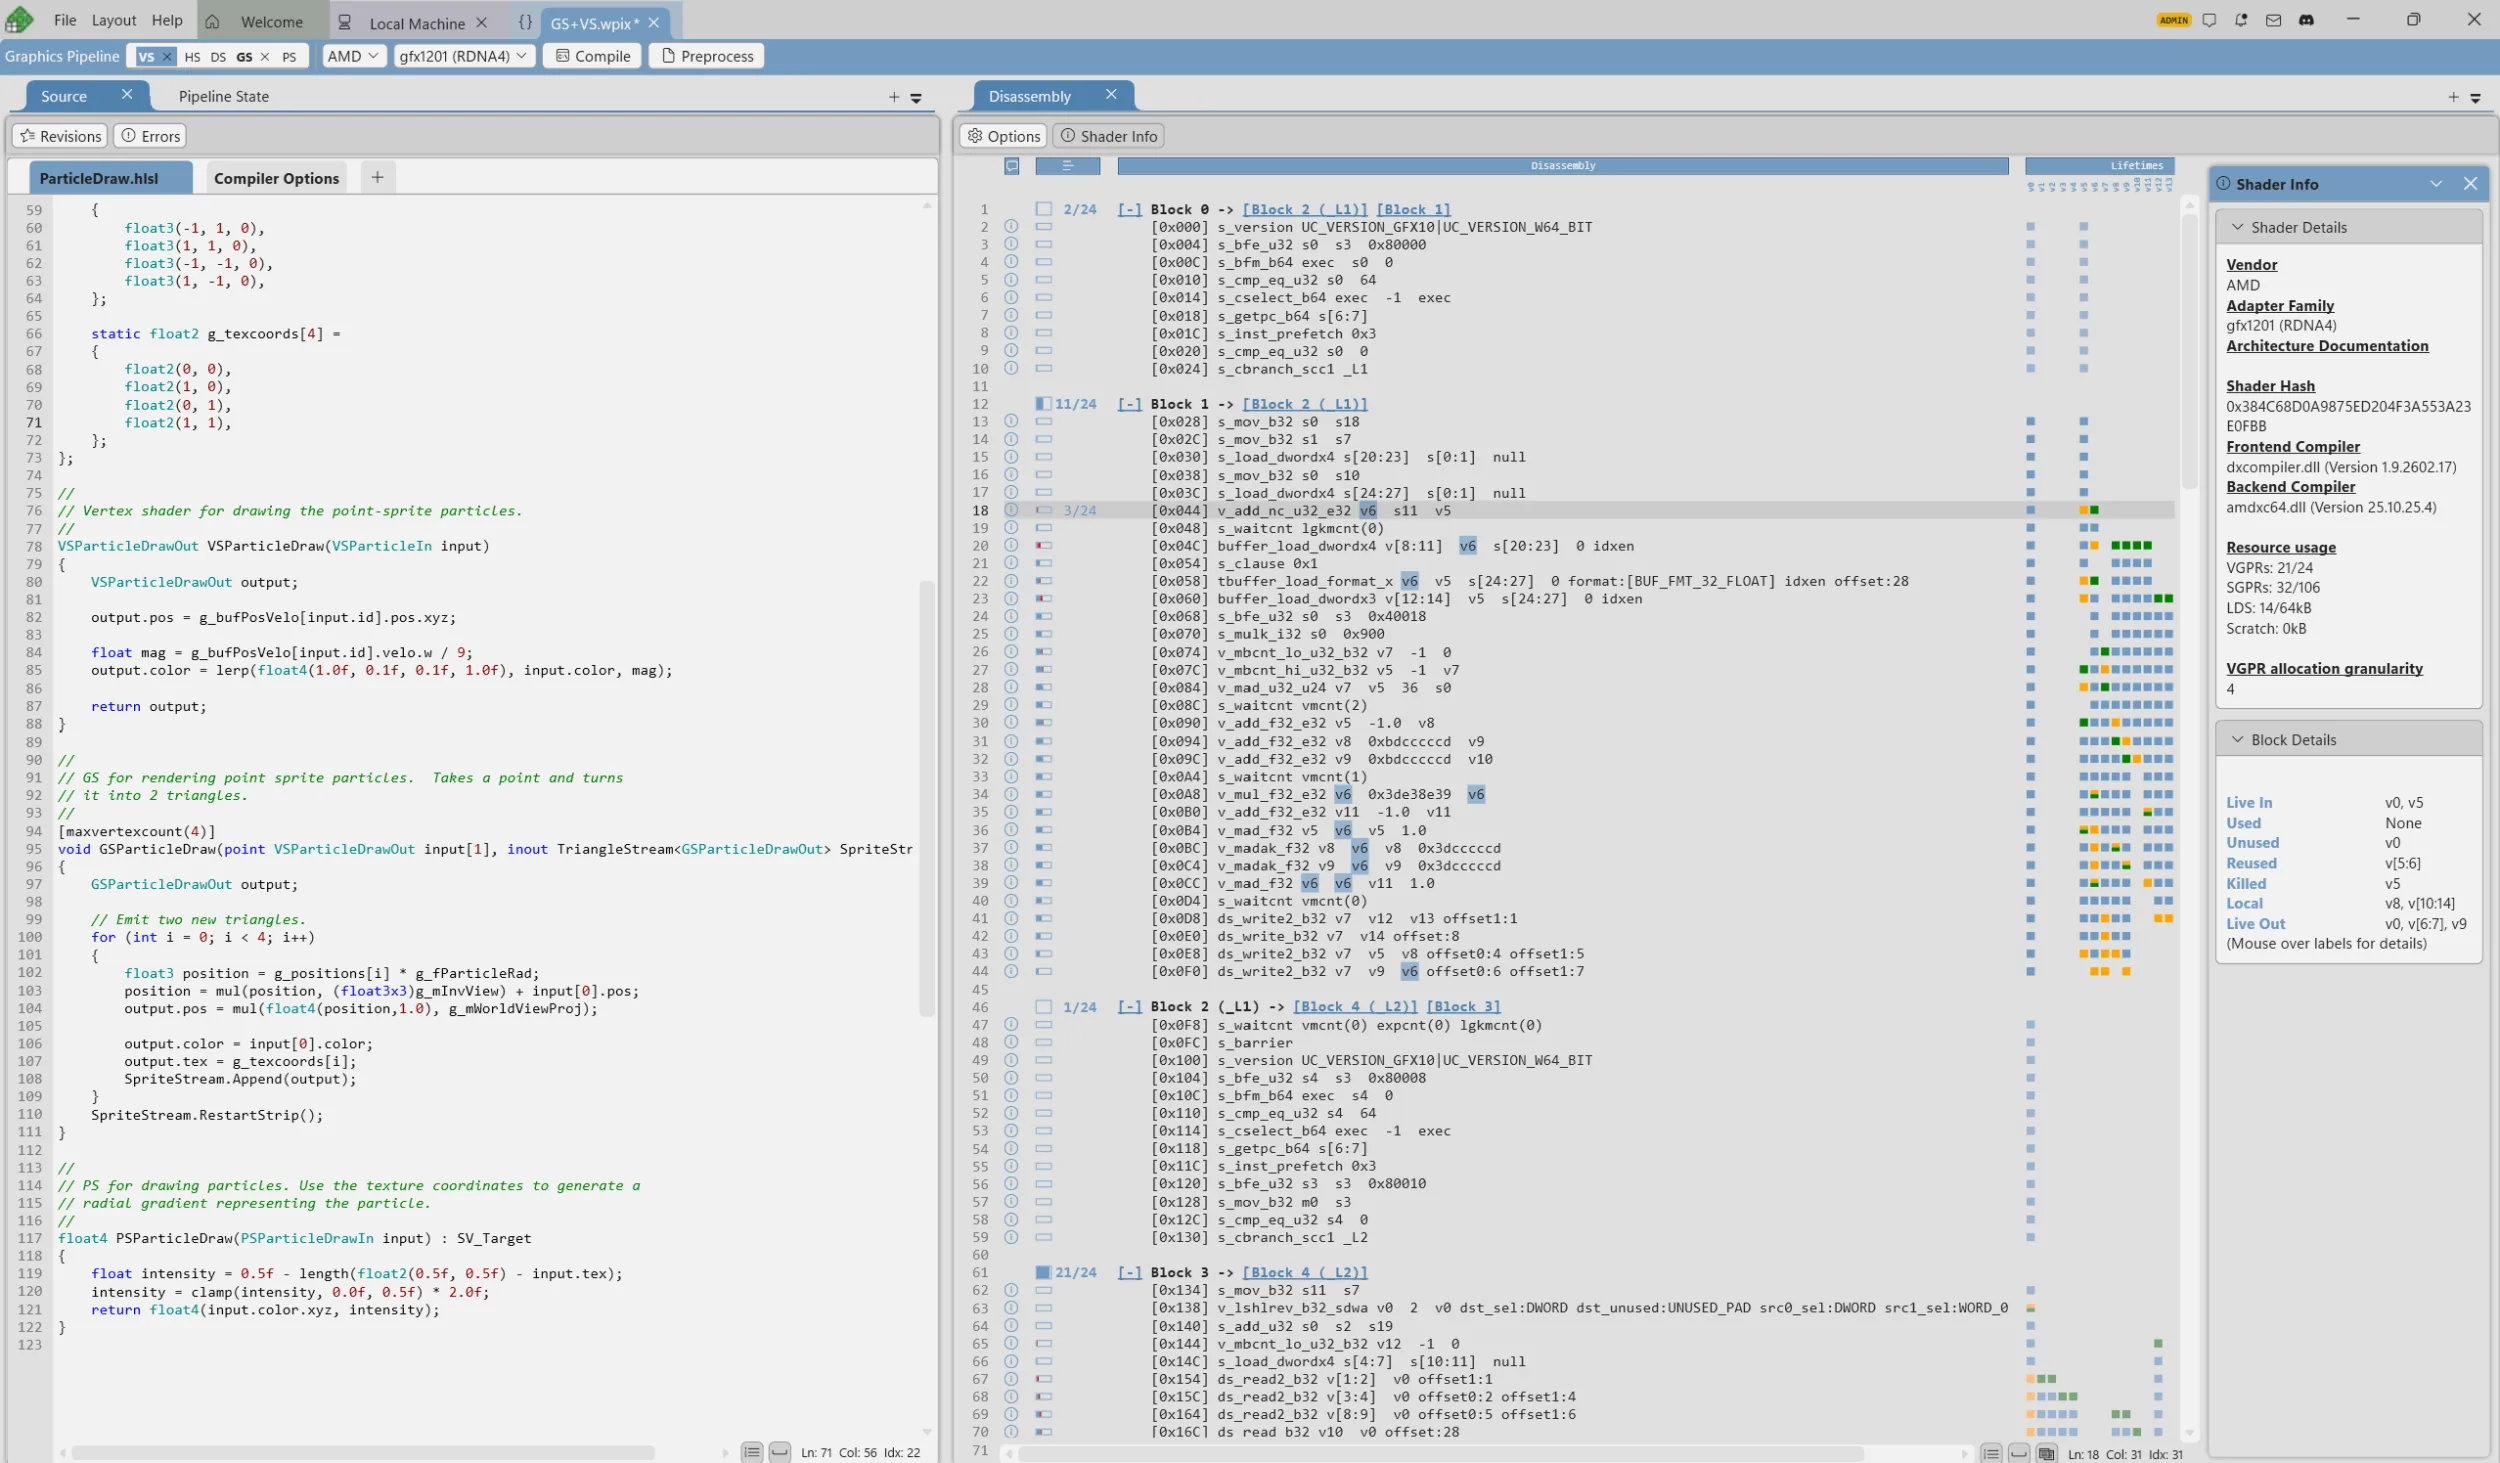
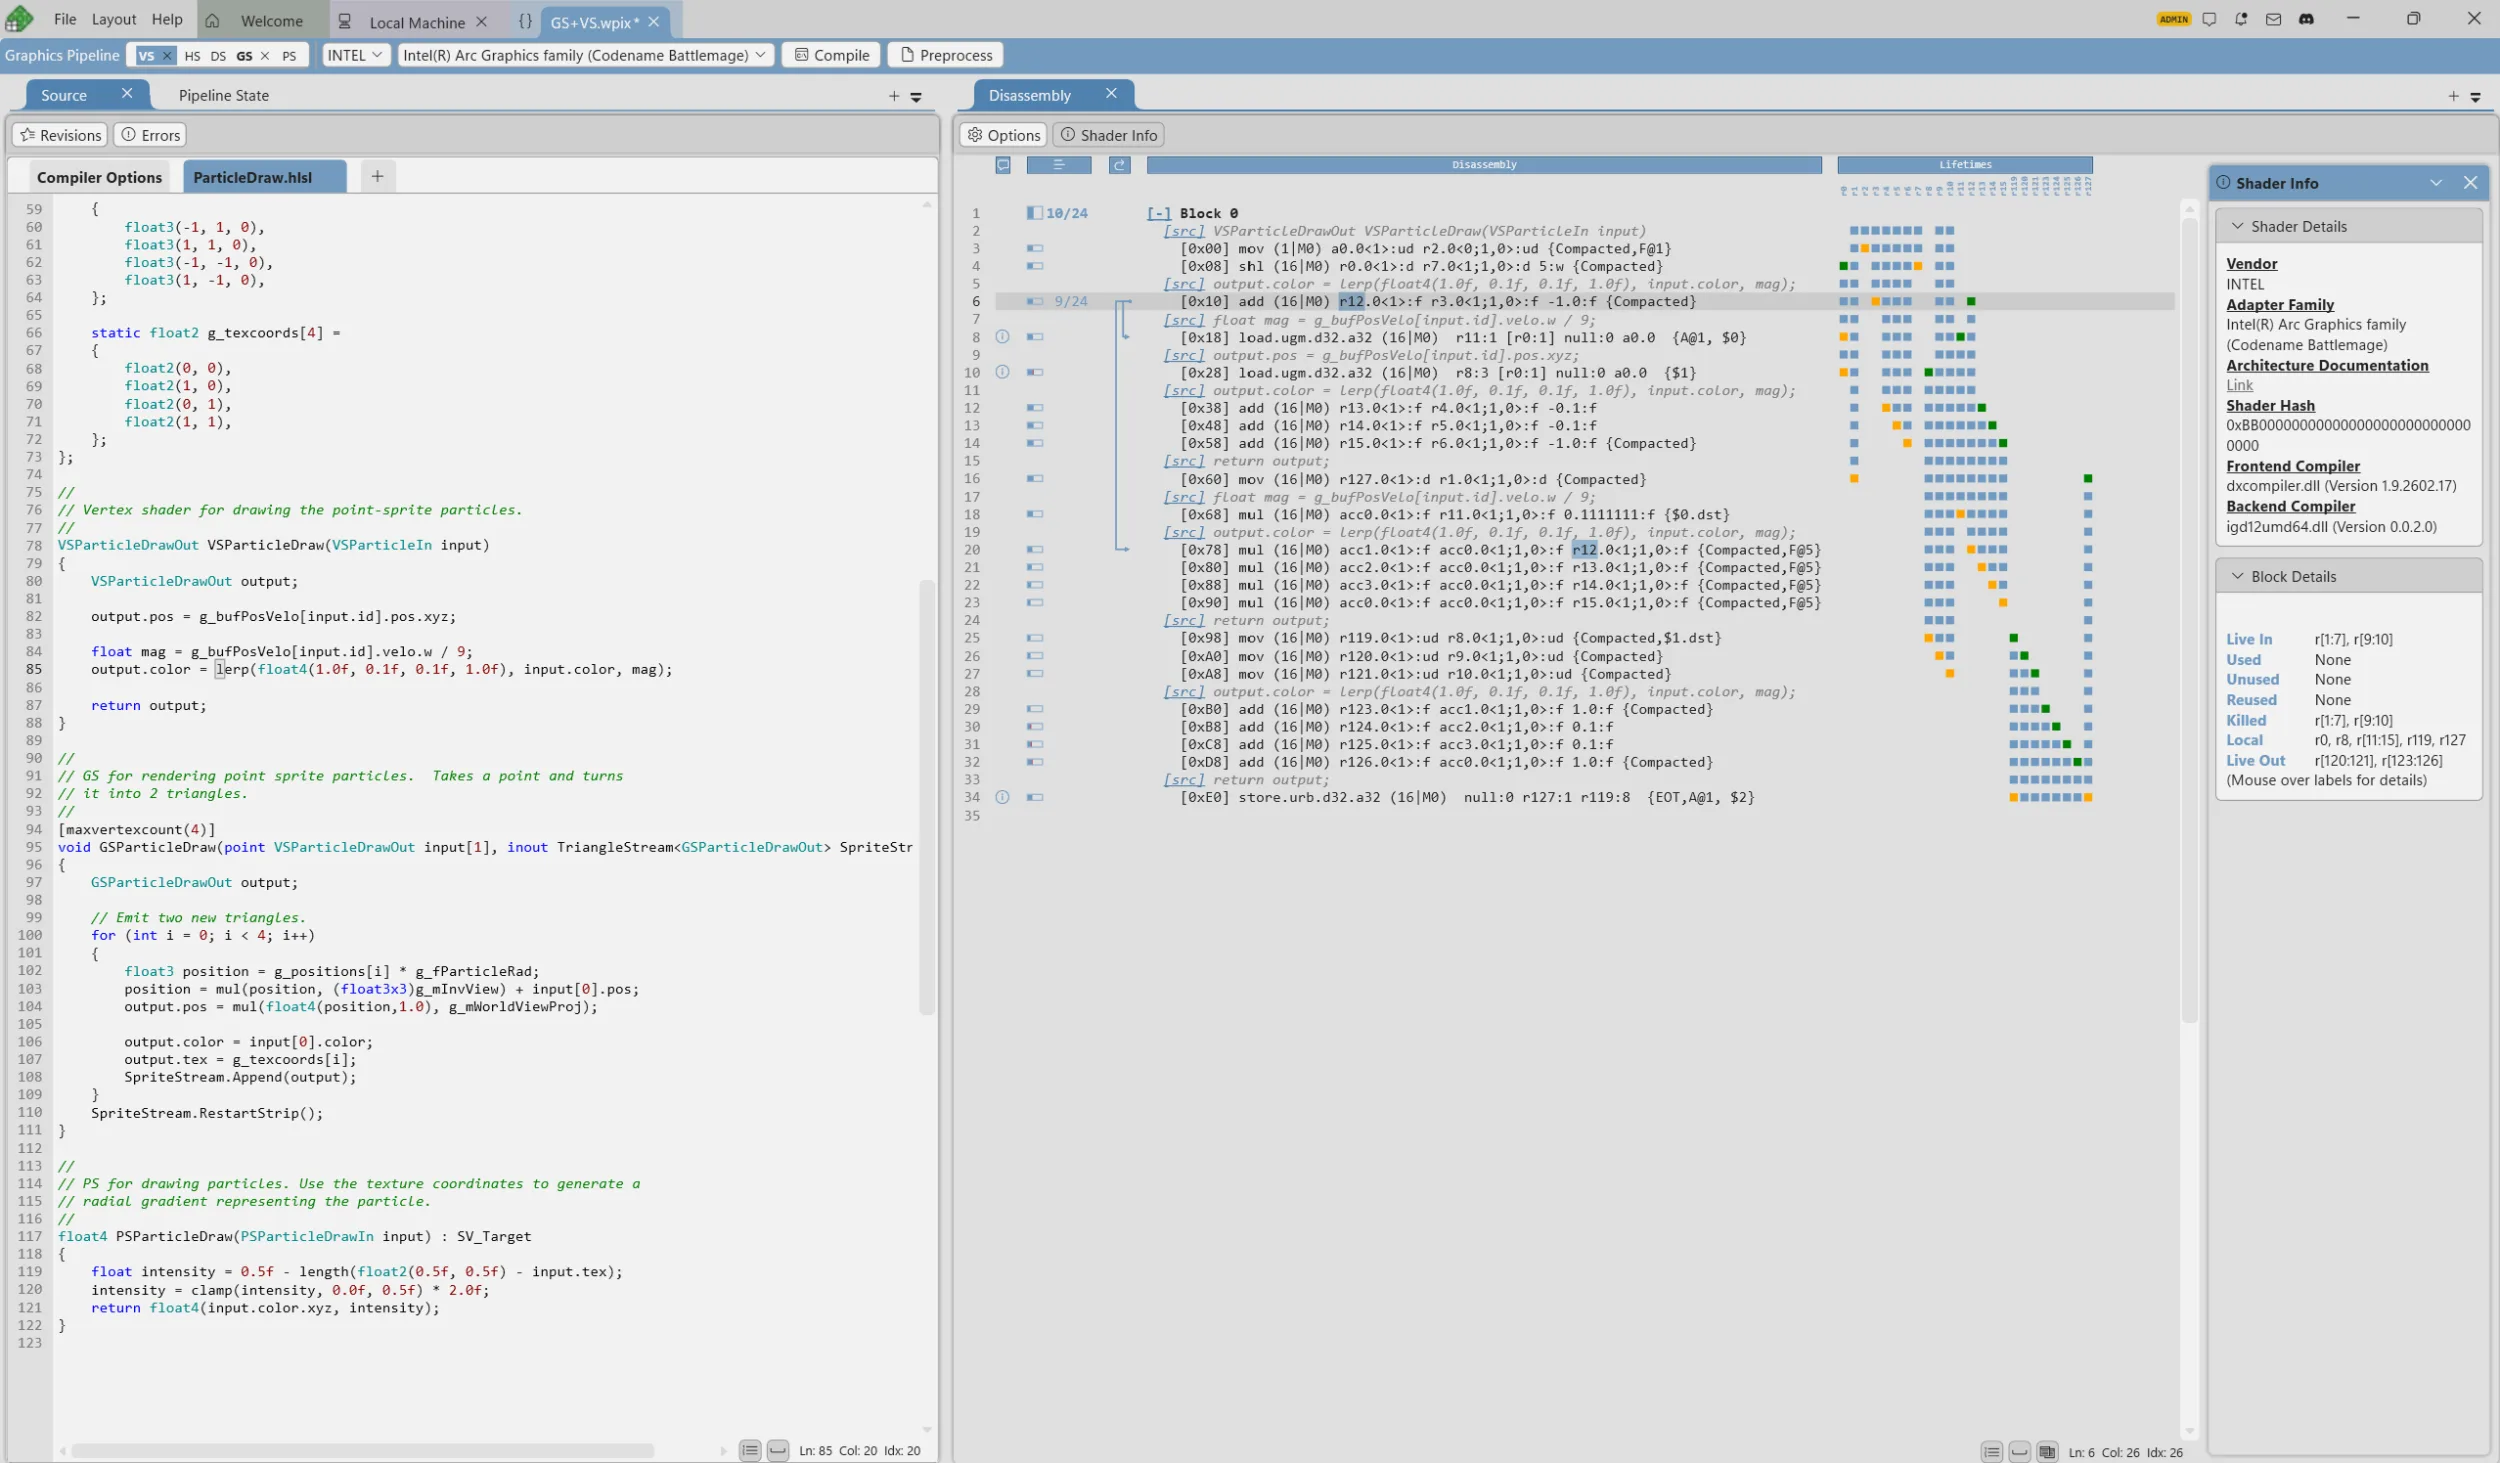
To get started, create a new Shader Explorer project from the File -> New menu by selecting the type of pipeline that you would like to work with (Compute, Graphics, Mesh).

Once your project is open, add shader stages to the pipeline, import or write HLSL, use the Pipeline State view to modify the pipeline state to match your shaders, select a hardware family to target using the vendor and adapter dropdowns, and click Compile. You can use the Revisions panel to manage multiple iterations of your pipeline and compare them.

Future releases will build upon this preview and include features such as:
- Exporting your shader pipeline from a GPU capture into Shader Explorer so that you don’t have to manually create or import the shaders and pipeline state
- ISA syntax highlighting
- ISA register to HLSL variable correlation
- Live profiling (instruction sampling, stalls, and more)
- Much more! This is just the beginning of Shader Explorer on PC and many more investments in it are in the pipeline
Known Issues for this release:
- AMD
- ISA to HLSL line mappings are not available for AMD hardware targets
- Intel
- ISA to HLSL line mappings are not available for Pixel Shaders.
- Mesh Pipelines fail to profile due to a driver bug
As always, please get in touch with us with any feedback or suggestions on this exciting new feature.
PIX API
A beta release of the PIX API is now included in this installer. If you are interested in using this, then please contact us for onboarding instructions. We will publicly document this in a future version of PIX.
Tile Mappings Viewer
PIX now supports inspecting tile mappings for reserved resources and heaps. When viewing a reserved resource in the Texture Viewer you’ll have a new Mapping Details panel. Selecting a pixel will also draw an overlay around the selected tile and information about that tile will be displayed in the panel. This includes:
- Tile index and coordinate.
- If mapped, to which heap and at what offset.
- Any other aliased tiles from other reserved resources.
- General resource tiling information (like what you’d get from ID3D12Device::GetResourceTiling).

And, if you really need to drill into your tile mappings, you can navigate to the new Resource Mappings and Heap Mappings views which, after selecting a resource or heap and an event, feature:
- A pivot table view of the mappings, allowing you to slice the mappings you see in the table by Mapped Object Id, Event Id, or Subresource Index.
- A visualizer panel that shows which tiles are mapped and allows slicing by mip level, array slice, or depth slice depending on resource dimension. The fill of each tile represents whether the tile is mapped or not and the border thickness represents whether that tile was affected by the currently selected event.
- The same Mapping Details panel from Texture Viewer.
- A Mapping Events panel which shows the mapping events relevant to the selected object. The Initial Mappings event represents the mappings at the beginning of the capture and will always be present. UpdateTileMappings and CopyTileMappings are the other event types.

We’re looking forward to any feedback you have or features you’d like to see to help you debug issues with tile mapping. Some ideas we have:
- Add an overview of mapping status per resource/heap for each event and per subresource so you can quickly get a sense for whether particular resources or heaps are fully, partially, or not mapped at a glance.
- Add more colors to the visualizer to help identify individual resources/heaps (eg each resource/heap is assigned a distinct color) or a heatmap of aliased tiles (to indicate the degree of aliasing).
- An overlay or visualization mode in the TextureViewer to easily distinguish between unmapped tiles and mapped-but-empty tiles.
Let us know via Discord or askwinpix@microsoft.com which of these would be most helpful or if there’s something even better we could do!
GPU Hardware Counters in System Monitor
This release includes new counters in System Monitor that let you view low-level hardware-specific counters in realtime as your application runs. This initial preview release adds support for counters on recent NVIDIA and AMD GPUs. Many thanks to our hardware partners for making this happen!

New Remote Deployment Workflows
As more game developers target a wider range of Windows-powered devices, including handhelds and other non-domain-joined hardware, the current PIX remote profiling flow has shown its age: manual setup on the target device, repeated UAC prompts, Windows-account authentication that doesn’t fit handheld scenarios, and the need to physically plug a keyboard and mouse into the target just to get connected. With this release we are introducing improvements to the secure remote profiling experience that bring the Windows remote profiling story closer to what you already expect from console development.

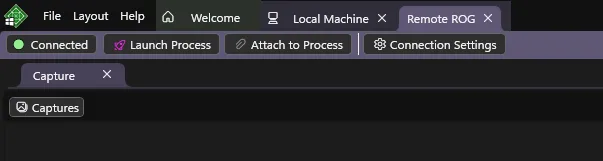
The new flow builds on the device provisioning and secure transport provided by the Xbox PC Remote tools. Pair your development PC and your remote target device once through the Toolbox (PIN pairing plus certificate exchange, no Windows accounts and no domain join required), then connect from PIX the same way you always have: File > Device Manager > Add device, enter the IP and connect. Alternatively, you can also connect from the Device Connections section of the new Welcome page shown at PIX startup. PIX first tries the current PIX link connection mechanism and transparently falls back to the secure transport set up by the Toolbox if needed, so there’s nothing new to learn in the UI and no separate connection mode to select.
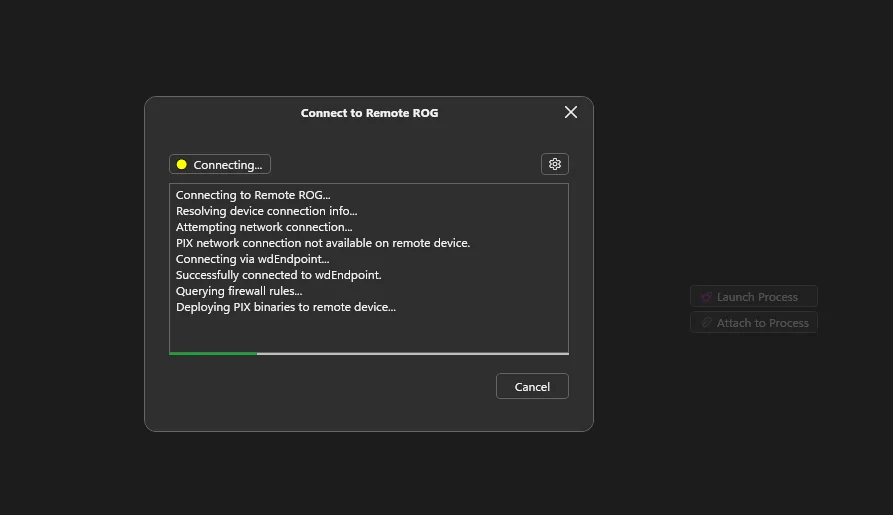
The legacy WinPIX Remote Monitor flow is still fully supported in both secure and insecure modes for users who prefer to keep using it.
New DirectStorage Mapping Files Support
PIX Timing Captures already let you see exactly when your title reads from disk, whether through DirectStorage for Windows or the classic Win32 file APIs. But if your title packages its assets into large composite archives (.pak, .bundle, .dat, and similar), those reads show up by file name, offset, and size only, leaving you to mentally reverse-map offsets back to individual assets to figure out what a hot read actually touched. With this release, PIX can do that mapping for you.

Point PIX at a small CSV mapping file that describes the ranges inside each of your archives, and PIX will decode every file IO range that falls inside a known archive back to the underlying asset name. This works for both DirectStorage batches and Win32 file reads, and it lights up in the same places you already look: archive reads are annotated with asset names in Element Details and in Range Details, and a diamond shaped indicator is included in the Timeline to show you the start of the events. That means you can finally sort the reads in a Timing Capture by duration and immediately see which assets (not which byte ranges) are dominating your load time.

0 comments