Starting with the 2408.05 release of PIX on Windows, performance data from multiple processes can be analyzed with a single Timing Capture. The ability to analyze multiple processes simultaneously is useful in scenarios where multiple copies of a game server are running on the same machine, for example.
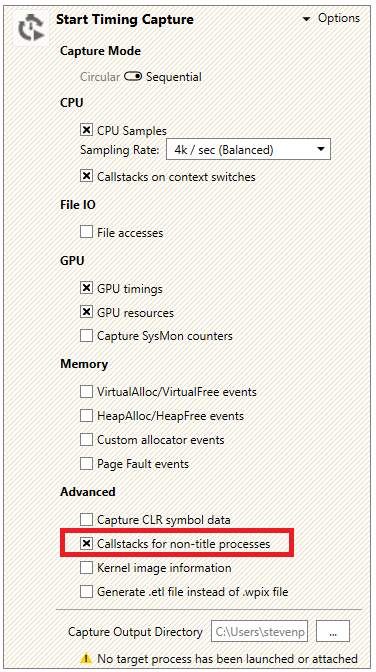
PIX will capture data from all running processes on a machine when a Timing Capture is taken. However, callstacks are only captured for the title process that you started, or attached to, from the PIX UI. In multi-process scenarios, you’ll want to check the Callstacks for non-title processes checkbox before starting a capture.
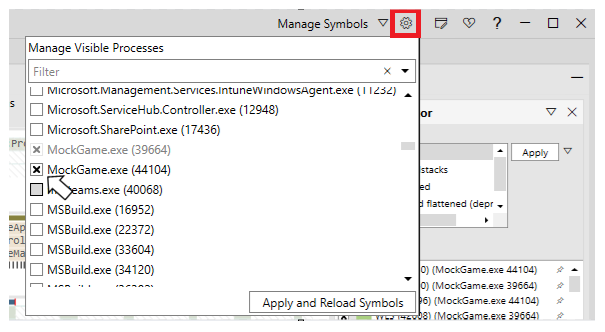
By default, the performance data from the title you started, or attached to, from the PIX UI will be displayed in the Timing Capture. Access the Manage Visible Processes dropdown from the gears icon in the upper right corner of the PIX UI to specify additional processes for which to view performance data.
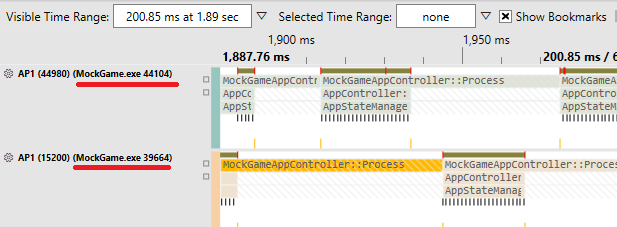
When performance data from multiple processes is viewed, PIX appends the name of the executable and the process ID in all places where information about CPU threads is shown. For example, the following figure shows a thread named AP1 from two different processes in the Timeline.
You’ll see the executable name and process ID in various places in the other views as well, including the Range Details and Element Details view.
There are a few things to keep in mind when viewing data from multiple processes in the Range Details view. First, memory allocations are only captured for the game you launched or attached to, not for all processes. The volume of memory data, especially for heap allocations, makes it impractical to capture for all processes. Second, file io data is not filtered by process at all.
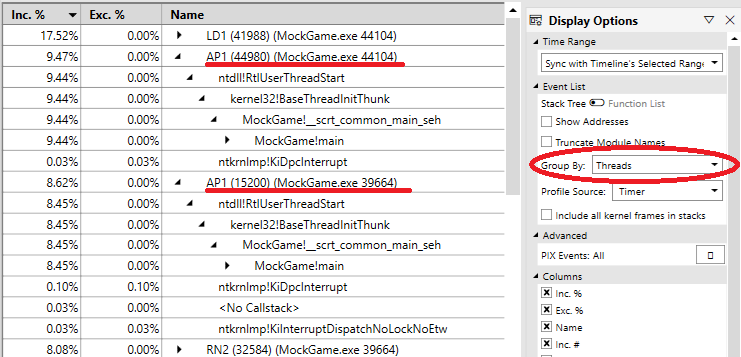
Finally, when viewing Sampled Functions data, use the Group By dropdown in the Display Options panel to group the stack trees by Threads, Cores, or Cores and Threads. Without this grouping, you’ll likely see the same stack tree displayed multiple times, with no indication of which process it came from.
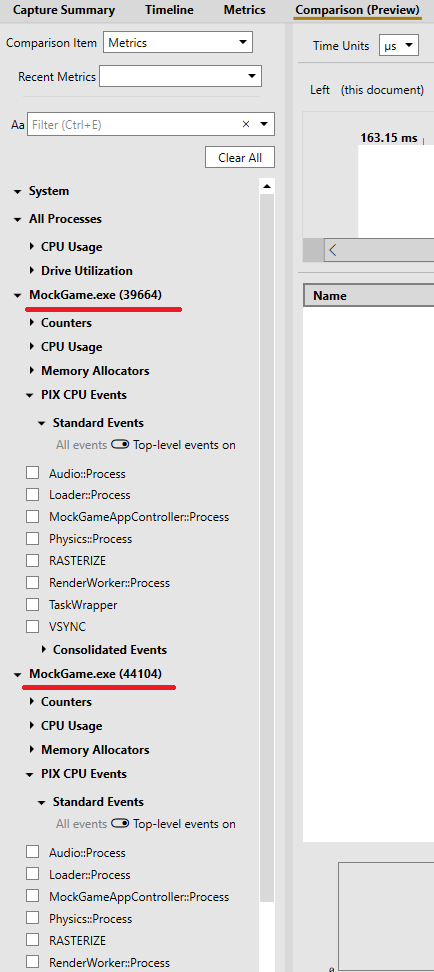
The tree in the Metrics selector panel in both the Metrics layout and the Comparison layout is partitioned by process as well.
As always, please continue sending us feature requests and bug reports using the PIX Feedback button in the upper right corner of the UI.
Thanks,
Steven.



0 comments