

This is the first post in a multi-part series about authoring custom profiles for Windows Performance Recorder (WPR.)
In a previous post, we have looked at how to start a trace with built-in profiles. The built-in profiles offer wide variety of preset profiles that we can use for different scenarios. There are built-in profiles for CPU usage, Networking I/O activity, VirtualAlloc usage, Xaml activity, and many more. However, none of the built-in profiles will collect any custom instrumentation you may have added to your code. To record a trace capturing your specific events you will need to author a custom profile.
A WPR profile is a file that describes the characteristics of the recording session and lists out the events to be recorded. WPR profiles are XML files with the extension “.wprp”. There are two types of profile, built-in profiles and custom profiles. WPR provides convenient presets (built-in profiles) because many parts of Windows OS are already instrumented using Event Tracing for Windows(ETW). It is one reason among many other why you should consider using ETW as the instrumentation framework over other solutions. Not only can you collect your own events, you can collect events from the well known event providers to correlate activities between your software and other software in the OS. Let us find out how to author the custom profile.
The simplest custom profile
Instead of going through the schema of the profile, let us first start by looking at an example of a minimum custom profile.
<?xml version="1.0" encoding="utf-8"?>
<WindowsPerformanceRecorder Version="1.0" Author="WPT team">
    <Profiles>
        <EventCollector Id="EventCollector_WPR" Name="SimpleEventLogger">
            <BufferSize Value="256"/>  <!-- Optional. Default value is 128-->
            <Buffers Value="64"/>      <!-- Optional. Default value is 64 -->
        </EventCollector>
        <EventProvider Id="EventProvider_WPR_Status" Name="36b6f488-aad7-48c2-afe3-d4ec2c8b46fa">
            <Keywords>   <!-- Optional. Default value is 0xFFFFFFFFFFFFFFFF -->
                <Keyword Value="0x40000"/>
            </Keywords>
        </EventProvider>
        <Profile Id="WPRTest.Light.File" LoggingMode="File" Name="WPRTest" DetailLevel="Light" Description="WPR Test">
            <Collectors>
                <EventCollectorId Value="EventCollector_WPR">
                    <EventProviders>
                        <EventProviderId Value="EventProvider_WPR_Status"/>
                    </EventProviders>
                </EventCollectorId>
            </Collectors>
        </Profile>
        <!-- Optional other flavors of the profile-->
        <Profile Id="WPRTest.Light.Memory" Base="WPRTest.Light.File" LoggingMode="Memory" Name="WPRTest" DetailLevel="Light" Description="WPR Test"/>
        <Profile Id="WPRTest.Verbose.File" Base="WPRTest.Light.File" LoggingMode="File" Name="WPRTest" DetailLevel="Verbose" Description="WPR Test"/>
        <Profile Id="WPRTest.Verbose.Memory" Base="WPRTest.Light.File" LoggingMode="Memory" Name="WPRTest" DetailLevel="Verbose" Description="WPR Test"/>
    </Profiles>
</WindowsPerformanceRecorder>
The example above specifies: One EventCollector, one EventProvider, and four flavors of Profiles. The easy way to understand the relationship of those elements is treat them as nested containers. Profiles hold Collectors(<EventCollector> and/or <SystemCollector>), and Collector hold Providers. Collectors and providers are defined once per Profile collection, and are then referenced in each profile as desired. This allows you to use the same provider in multiple collectors, or the same collector in multiple profiles, without having to duplicate their definitions. These three types of elements defines a custom profile file. Let us look at each elements in little more details.
Profile Element
The <Profile> element is like the title of a document. The element defines the tracing session’s properties such as the session name and logging mode. Most importantly, this element defines the collectors for the session. <Profile> elements’ attributes are the Name, Id, LoggingMode, DetailLevel, and Description. WPR takes <Profile> element’s Name, Loggingmode, and DetailLevel in the start command as detailed in the previous post. For example wpr -start [<filename.wprp>!]<profile name>[.{light|verbose}]. If unspecified, verbose and memory mode are selected by default.
wpr -start WprTrace.wprp!WprTest.Light -filemode  (Starts light, filemode WprTest profile)
wpr -start WprTrace.wprp!WprTest  (Starts verbose, memory mode WprTest profile)
wpr -start WprTrace.wprp  (Starts verbose, memory mode WprTest profile)
In example above, only one profile “WPRTest.Light.File” contains any elements. The other three profiles (“WPRTest.Light.Memory”, “WPRTest.Verbose.File”, and “WPRTest.Verbose.Memory”) are actually the same since they are based off “WPRTest.Light.File”. This is called inheritance. By using inheritance, we can add or remove collectors and providers per profile. For simplicity in this example, we kept the profiles the same, but we will develop the profiles further eventually.
We recommend that you define at least two profiles, one for the memory logging mode and one for the file logging modes in your custom profile. If a profile defines only one logging mode, i.e. LoggingMode=”File”, then you can only start filemode traces, i.e wpr -start WprTrace.wprp!WprTest.Light -filemode. If we start the profile flavor that is not in the custom profile file, WPR complain with errors.
Case 1. The custom profile has only the file mode profile and tried to start memory mode trace.
c:\wpt>wpr -start wpr.wprp!wprtest
One or more profiles does not support memory mode. Did you forget to add -filemode?
        The Logging Mode does not match with the profile passed.
        Error code: 0xc5584017
Case2. The custom profile has only the verbose logging level and tried to start the light level.
c:\wpt>wpr -start wpr.wprp!wprtest.light -filemode

        The Level does not match with the profile passed.
        Error code: 0xc5584016
Therefore, it is just easier to define all the flavors even if they are the same.
Collector Elements
The collector element defines the event tracing session. The required attributes are Id and Name. The important child elements are <buffersize> and <buffers>. The event session reserves a pool of buffers for the events. The <buffersize> configures the size of the buffer in KB, and the <buffers> sets the maximum number of buffers. Essentially, the values set the buffersize and MinimumBuffers and MaximumBuffers members in EVENT_TRACE_PROPERTIES.
In above example, “EventCollector_WPR” EventCollector sets 64 buffers, each with a size of 256KB. System will reserve a 64 x 256 KB (16 MB) size circular buffer for the memory mode session, and a 256 KB buffer sequentially or as needed in the file mode. The WPRTest profile uses one EventCollector with the id “EventCollector_WPR” and the collector uses one provider with the id “EventProvider_WPR_Status”.
ETW writes events to a session’s buffer, and when the buffer is full, it flushes to a file in filemode. If incoming event rate is faster than the speed of flushes, ETW allocates another buffer up to the maximum number of buffers. Beyond that, events will be lost. For a memory mode session, the buffer size times the maximum number of buffers sets the total memory size of the circular buffer. If the data rate is slow, the value of <buffersize> and <buffers> doesn’t matter much but if not, then the values have impact on resulting trace as well as disk io/memory. The following articles go into more details on buffers and the buffersize in a trace session.
- EVENT_TRACE_PROPERTIES – buffersize, MinimumBuffers, MaximumBuffers, and Remarks
- Sessions – explains the logging modes and buffers
There are two types of collectors, <SystemCollector> and <EventCollector>. A <SystemCollector> defines a tracing session for the predefined kernel events where as an <EventCollector> defines a generic session listening to the event providers. If you develop a driver or application that writes ETW events, your provider should be collected by <EventCollector>.
Both <SystemColletor> and <EventCollector> are limited resources in the system. In Windows 8 or later versions, there may be up to eight system logger session running simultaneously, and up to 64 logger sessions in total. Although the latter number is configurable, more sessions will consume more resources on the system and can impact performance.
Provider Elements
A provider is a generic term representing whatever is emitting the events. It could be a kernel writing low level system events, such as context switching or thread creation, or a driver, or an application. The system events are represented in <SystemProvider> and non-system event providers are represented as <EventProvider>. Because the different types of providers have different schemata, please refer to System and Event provider doc in MSDN for their elements and attributes. In above example, “EventProvider_WPR_Status” is a manifested event provider by WPR and Name is the guid of the provider.
If your provider is a kernel mode driver
Make sure to set optional attribute NonPagedMemory=”true”.Keyword is an optional element. If omitted, the default value is 0xfffffffffffffff. If you write your own event provider, assigning keywords to events is a good practice so that they can be controlled by the tracing applications like WPR or Xperf.
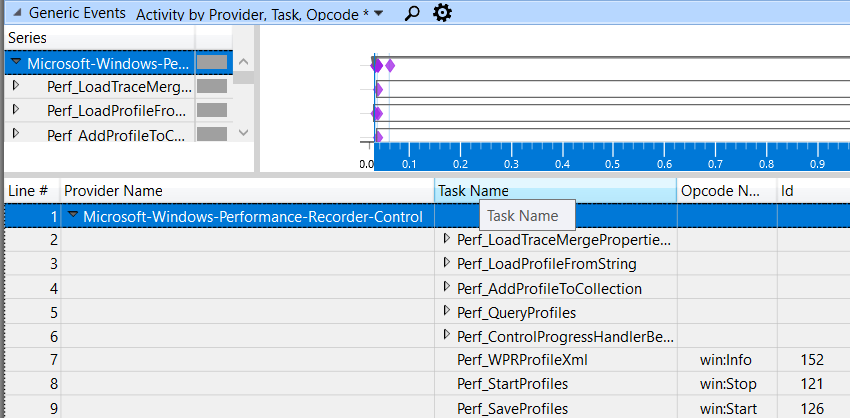
Try taking the trace using the example custom profile and open the trace in WPA. You will see the events from ‘Microsoft-Windows-Performance-Recorder-Control’ provider. Interestingly, WPR is generating events and also capturing its own events.
Closing
In this post we showed the simplest custom profile. With this profile, we can start an event session listening to events from the ‘Microsoft-Windows-Performance-Recorder-Control’ provider. You can adjust the properties of the collector and add more providers as needed. Although this simple profile is good for collecting events from providers, the trace can be much more valuable if the kernel events provide system context. In the next post, we will develop this simple profile further, taking a closer look at the <SystemCollector> and <SystemProvider> elements.
0 comments