

This is the second post in a series about authoring custom profiles for Windows Performance Recorder (WPR).
In the previous post, we introduced a simple custom profile that collects events from a single provider. If you are only interested in the events from your module, that profile would be sufficient. Yet why would you write ETW events from your software and use WPR and profiles to collect them if printing some messages to a text file could do the same trick? Because ETW gives us much more than just printingdebug messages.
One of the most important benefits of using ETW comes from the existing instrumentation in many parts of Windows OS including kernel components. Because kernel components provide ETW events, you can correlate events from your software and the system context. In a WPR custom profile, a SystemProvider represents the kernel event provider. A SystemCollector represents the special ETW session collecting predefined kernel events. Let us add a SystemCollector and a SystemProvider to the simplest profile to collect kernel events as well as the WPR events.
The custom profile with SystemCollector and EventCollector
<?xml version="1.0" encoding="utf-8"?>
<WindowsPerformanceRecorder Version="1.0" Author="WPT team">
    <Profiles>
        <SystemCollector Id="SystemCollector_Wpr" Name="WprTest_SystemLogger">
          <BufferSize Value="1024"/>
          <Buffers Value="32"/>
        </SystemCollector>
        <EventCollector Id="EventCollector_WPR" Name="SimpleEventLogger">
            <BufferSize Value="256"/>
            <Buffers Value="64"/>
        </EventCollector>
        <SystemProvider Id="SystemProvider_Base" Base="">
          <Keywords>
            <Keyword Value="ProcessThread"/>
            <Keyword Value="Loader"/>
            <Keyword Value="CPUConfig"/>
          </Keywords>
        </SystemProvider>
        <EventProvider Id="EventProvider_WPR_Status" Name="36b6f488-aad7-48c2-afe3-d4ec2c8b46fa">
            <Keywords>   <!-- Optional. Default value is 0xFFFFFFFFFFFFFFFF -->
                <Keyword Value="0x40000"/>
            </Keywords>
        </EventProvider>
        <Profile Id="WPRTest.Light.File" LoggingMode="File" Name="WPRTest" DetailLevel="Light" Description="WPR Test">
            <Collectors>
                <SystemCollectorId Value="SystemCollector_Wpr" >
                  <SystemProviderId Value="SystemProvider_Base"></SystemProviderId>
                </SystemCollectorId>
                <EventCollectorId Value="EventCollector_WPR">
                    <EventProviders>
                        <EventProviderId Value="EventProvider_WPR_Status"/>
                    </EventProviders>
                </EventCollectorId>
            </Collectors>
        </Profile>
        <!-- Optional other flavors of the profile-->
        <Profile Id="WPRTest.Light.Memory" Base="WPRTest.Light.File" LoggingMode="Memory" Name="WPRTest" DetailLevel="Light" Description="WPR Test"/>
        <Profile Id="WPRTest.Verbose.File" Base="WPRTest.Light.File" LoggingMode="File" Name="WPRTest" DetailLevel="Verbose" Description="WPR Test"/>
        <Profile Id="WPRTest.Verbose.Memory" Base="WPRTest.Light.File" LoggingMode="Memory" Name="WPRTest" DetailLevel="Verbose" Description="WPR Test"/>
    </Profiles>
</WindowsPerformanceRecorder>
Only the bold-italic lines are added to the simplest custom profile. Like <Profile>, <EventCollector> and <EventProvider>, the same syntax rule applies. <SystemCollector> and <SystemProvider> are defined first then referenced in <Profile>. The major difference is that the system event provider is the kernel and there is only one kernel in the OS. Having a single system provider consequently leads to a single system collector.
SystemCollector
The elements and attributes of <SystemCollector> are practically same as <EventCollector>. The only difference is that you can reference <SystemCollectorId> only once within <Profile>. You can define the system collectors as many times as you want but you can only start one system session per profile. Not only because a limited number of system sessions can run simultaneously, but also because there is really no reason to start multiple sessions to collect events from a single provider.
SystemProvider
The elements of <SystemProvider> are widely different from the ones of <EventProvider>. <SystemProvider> has three groups of elements which are: <Keywords>, <Stacks> and <PoolTags>. The keywords of the system provider are also known as “kernel flags”. Because there are many kernel flags (keywords) and stackwalk events, most tracing applications provide friendly names for the flags and stackwalk events. WPR also lists out the names of flags and stackwalk events and their descriptions on MSDN.
The kernel flags are defined in the evntrace.h file in EVENT_TRACE_FLAG_* format. If the friendly name is not provided for the kernel flag, you can use <CustomKeyword> to pass in the hexadecimal value.
WPR merges the keyword values and passes the value in the EnableFlags member of an EVENT_TRACE_PROPERTIES structure when calling StartTrace function. If you want to know more about the keywords, Event Tracing MOF classes lists out the kernel event classes.
Basic system keywords
Among system keywords, ProcessThread and Loader are important keywords. We can almost say they are required because those events play a crucial role in analyzing the trace. ProcessThread enables kernel events for process/thread creations and deletion. The process/thread events are essential and many other tables in WPA use the events. Without ProcessThread keyword, the ‘Process Name’ column in WPA would only show process ids. The Loader keyword enables kernel events for loading and unloading of modules. During the trace merge time, WPR generates ImageID events that enable symbol loading in WPA. Without symbol information, trace analysis is challenging. For example, the stackwalk events would be a bunch of hexadecimal values instead of resolving to module and function names.
Being essential keywords, early WPR used to always add ProcessThread, Loader, and CPUConfig whenever starting a system trace session. Later in Windows 10, WPR changed its behavior not to add those keywords automatically. Therefore, unless you have specific reason not to, we suggest that you always add these flags whenever starting a system session.
What keywords and stacks do I need to use?
You would need to know what each of the kernel flags does in order to use them. Explaining what the kernel flags provide is beyond the scope of this post. However, we can take a look at the group of flags used in built-in profiles for each scenario.
We can use the command to display the built-in profile names and their target scenarios.
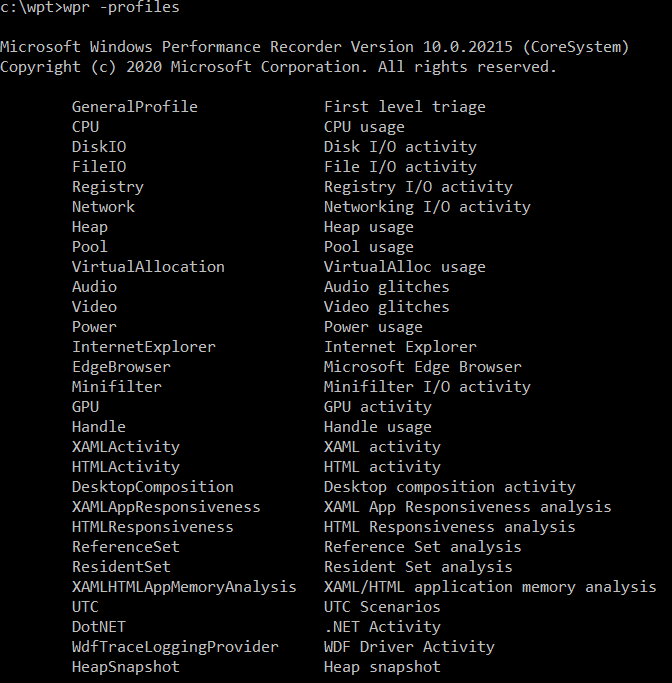
We can find out what kernel flags, stacks, and event providers each profile includes in its system and event collectors by using the wpr -profiledetails <profilename> command.
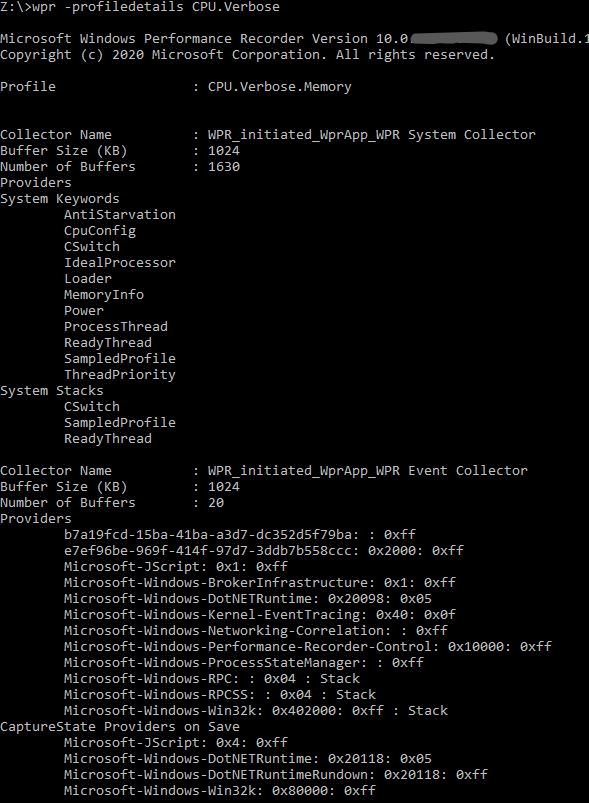
You can reference the list of system keywords and system stacks and use them in your custom profile. Note that some keywords are more verbose than others. Usually, CPU related system keywords make verbose events and adding <stacks> would quickly grow the trace size. You will have to adjust <BufferSize> and <Buffers> according to the expected volume of events.
Closing
We added SystemCollector and SystemProvider to the simplest profile we discussed in the previous post. The SystemCollector is the special mode trace session for kernel. Because the events are provided by a single provider, the kernel, we can reference the collector once per profile. Because kernel events provide critical information about processes, threads, modules, and more, collecting the system events greatly extends your ability to analyze traces and diagnose issues.
0 comments