The first step is always the hardest. It is true for WPR too. It becomes even more apparent if you try to get help text for the start command. WPR spits out a page full of texts with complex syntax options. It is like the first time we bought a fancy camera, eager to take a nice shot of a bird in flight but then discovering that choosing the right settings requires reading the manual. This is exactly why WPRUI exists today. It is the “Auto” setting in the Camera. Though the “Auto” setting of the fancy camera would take good pictures for the most time, sooner or later, the time comes to spin the dial away from the “Auto”. For that inevitable time, let us decipher the words.
If you are not familiar with WPR, check out the previous WPR intro post.
The first step
The first step is to type wpr -help in the command prompt. WPR provides 2 tiers of help, where the first help tier gives a list of commands about which you can request further help.
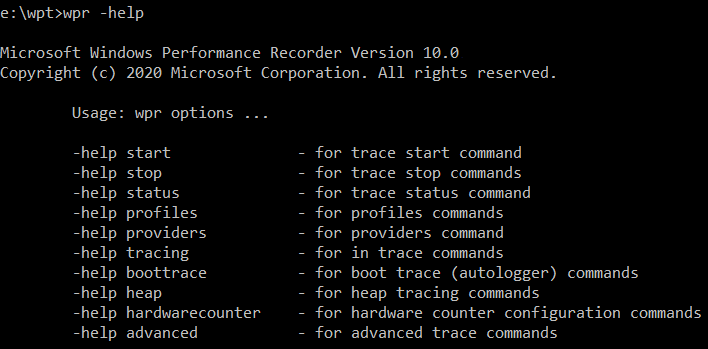
If your WPR prints out much longer list of help text, that is because you are running an older build of WPR. Current WPR in Windows ADK Insider Preview – Build 20215 (or later) should give you the above text but, the text from older build is okay and should also give you the same help.
The next step is to get help on the start command, by typing wpr -help start. The command prints out a very long list of options and explanations. Again, if your WPR prints out much shorter texts i.e. no -onoffscenario related options, that is also fine. It is probably because you are executing WPR from the Windows directory where the axeonoffhelper module does not exists. OnOffScenarios are used in measuring preset performance scenarios such as Boot, Standby or Shutdown. We do not need -onoffscenario option for the purpose of this post.
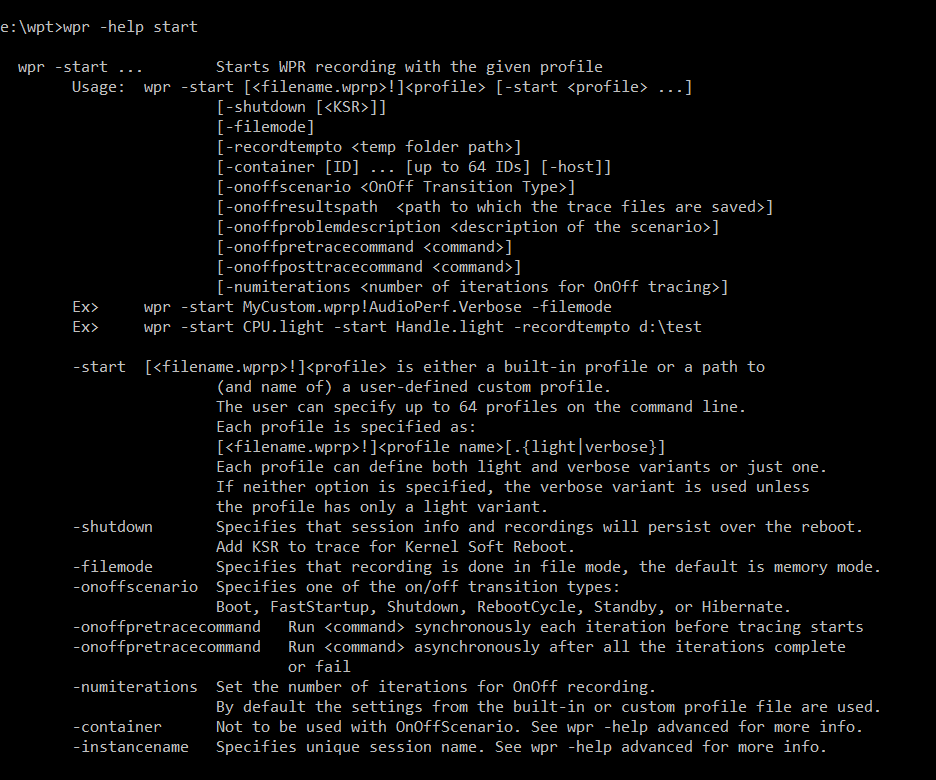
If we remove -onoff*** options, the start command becomes much less intimidating. The help text says -start [<filename.wprp>!]<profile> over and over. It looks like WPR needs a profile to start with. What is the profile? Is it the file with .wprp extension or something else?
Profiles : Built-in and Custom
Profile is basically a preset that describes what we want to collect in the trace. There are two types of profiles, built-in and custom. The built-in profiles are like the modes in camera. The most digital camera provides modes such as Macro, Portrait, and Landscape that the camera manufacturer preset optimum shutter speed, aperture, and etc to take good photo based on the situation. WPR also provides the presets for the well-known areas such as Audio, Video, CPU, Network, and File IO to focus the trace for.
The custom profiles are like the manual mode in camera. You need to know the events and the characteristics of the events. Making custom profiles are not very difficult. Just as with understanding the concept of camera lenses and shutter are the start of the manual mode shot, a few concepts in ETW would give you enough to start authoring the profile. The custom profile uses .wprp as the file extension. However, for the beginners, let us start looking at the presets, the built-in profiles.
WPRUI conveniently shows the built-in profiles in the start UI within the check-box list whereas wpr -profiles command lists out all built-in profiles.
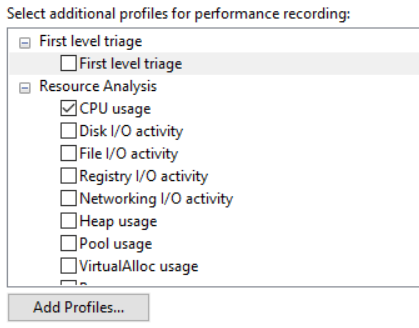
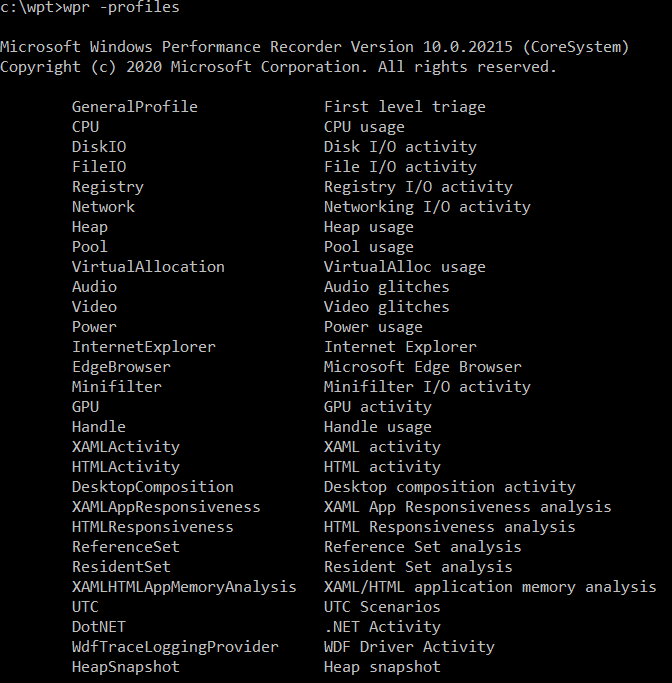
The left side is the name of the profiles and the right side is the description of the profiles. Now, we got the <profile> part of the command wpr -start [<filename.wprp>!]<profile> . Since the custom profile <filename.wprp>! part is optional, we can start a trace by simply providing any built-in profile name, like below.
To start one profile:
wpr -start CPU
wpr -start VirtualAllocation
Wpr -start Network

To start multiple profiles in merged sessions:
wpr -start CPU -start VirtualAllocation -start Network
Verbosity of Profile : Verbose and Light
A profile can define two verbosity levels, verbose and light. It is like children’s building block toy where it comes with either the basic block set or a complete set. It is up to the profile author to decide what events are included in verbose and light variants. In WPR, the difference between the light and verbose variants in built-in profiles are usually the addition of stackwalk events and chatty event providers in verbose profile. One can start with the light profile and if the trace doesn’t give enough clues to investigate, then proceed with the verbose profile. The verbosity level is the last portion of the cryptic start command format in the help text [<filename.wprp>!]<profile name>[.{light|verbose}].
wpr -start CPU.verbose (starts verbose CPU profile)
wpr -start CPU (same as above. If verbosity is omitted, verbose is selected)
wpr -start CPU.light (starts light CPU profile)
Logging Mode : File and Memory mode
Whether to log to a file or to memory is a decision we have to make. Many factors can influence the decision. In file mode, events are first collected in the buffer then flushed to the file on the disk sequentially. In memory mode, the events are written to the circular buffers in memory and only at the last moment it becomes a file through the trace merge phase. The file mode is essentially setting EVENT_TRACE_FILE_MODE_SEQUENTIAL to the session property and the memory mode is setting EVENT_TRACE_BUFFERING_MODE.
Which mode to use is really based on the nature of the events and the potential impact on the system where the recording is captured. If I need to capture the trace without losing events for a long period of time, with less impact on memory, then I would use the file mode so that I can keep all the events while avoiding the circular wrap problem. If I need to capture over long period of time but only the end part is important, then I would use the memory mode or the circular file mode. Unless the events are particularly verbose that the writing to file would result in lost events or there is tight storage room for the file to grow, using the file mode make sense for most cases. There are two good articles that explain about the modes and buffers further.
- Logging Modes – explains the modes in WPR context
- Sessions – explains the modes and buffers deeper in ETW context
By default, the memory mode is selected unless -filemode is specified in the command line. When I collect a trace for testing, I use the memory mode almost always for this reason. I don’t have to type -filemode at the end since I have the beefy computer that can spare some memory without a hitch.
At this point we can start any built-in profile in memory or file mode.
wpr -start GeneralProfile.Light -filemode (starts GeneralProfile.Light in file mode)
wpr -start GeneralProfile.Verbose (starts GeneralProfile.Verbose in memory mode)
If we want to start a profile from the custom profile file, assuming that CustomProfile.wprp file has WPRTest profile in Verbose/Light, and File/Memory mode, we can start the profile like below.
wpr -start CustomProfile.wprp!WPRTest -filemode (starts WPRTest in verbose, file mode)
wpr -start CustomProfile.wprp!WPRTest.light (starts WPRTest in light, memory mode)
The Stop Command
The last step would be stopping the trace. This is a straight forward step to save the trace to a given file name.

Optionally you can give the problem description string, which will be inserted to running trace as an event.
wpr -stop myrepro.etl "repro MyApp slowdown in stop"
You can find your custom problem description string in Marks table, WPA GraphExplorer under System Activity.
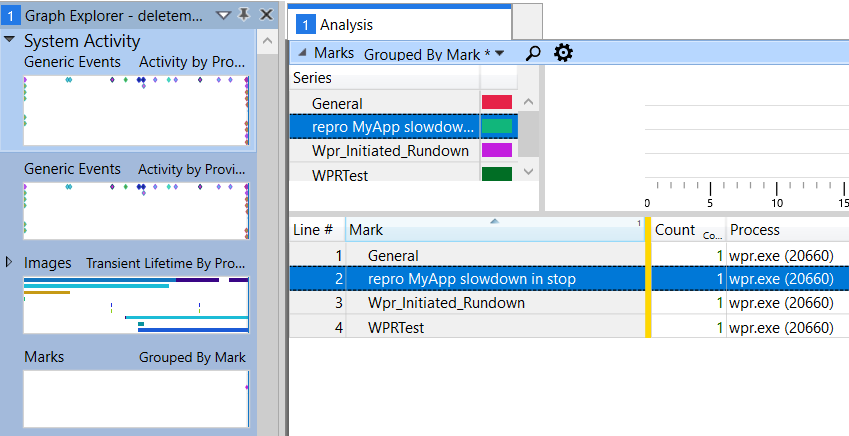
In the example Mark table seen above, each line means
- General – This is a general trace, not one of the onoff scenario
- repro MyApp slowdown in stop – <problem description>, the optional parameter
- Wpr_Initiated_Rundown – Marker to show where the rundown operation started
- WPRTest – the profile name
-skipPdbGen is an optional parameter to avoid ngen and embedded pdb generation in trace merge time. It is useful to skip those pdb generations, if you are not collecting trace for .NET apps. The pdb generation only happens for the .NET modules. The pdb generation can take quite a while (multiple 10s of seconds).
One thing I want to point out is that the stop operation can take a while. If WPR just stops the trace, then the operation wouldn’t take long at all. Once the running session is stopped, WPR processes the trace and inserts more events such as image ids, and system information. We call this “Merge”. Most other trace apps require a separate command to merge the traces after stopping, but wpr does this automatically when stopping the trace. The culprit of the long merge time is the “Loader” kernel flag, but it is very important flag that tells about module load/unload. Without this flag the trace has no symbol information, and without symbols, WPA shows just numbers for processes and stacks.
If wpr -stop command fails with Error code: 0x80010106
Please use the insider version of ADK Windows Performance Toolkit, build 19650 or laterClosing
In this post we have looked at the format of wpr -start command and reviewed the optional parameters. Now, what seemed to be cryptic format in wpr -help start command should make clear sense to you. I didn’t explain how to start/stop trace using WPRUI because it is already written in MSDN, and it should be pretty straight forward if you read this post. If you want to look at those articles, here are the links.

Hi,
When recording on a 64-bit Win10, should I set Disablepagingexecutive to “on”?
According to the documentation it should only be done pre Win8. However, when analyzing miniport driver on 64-bit Win10, it appears that the stack trace sometimes does not make sense (functions calling unrelated functions). Only after setting Disablepagingexecutive to “on”, the stack trace works well.
Thanks
I believe Disablepagingexecutive must be set to “on” when collecting stacks for 3rd-party drivers that have not been recompiled to include additional function unwind information (so, compiled against the Win8+ WDK).
The exact compiler magic involved is outside of my area of expertise, but I’m fairly confident that only drivers built for older versions of Windows will require the use of Disablepagingexecutive when collecting stacks on Windows 8 or later.
I don’t think you need to but you can keep the value to “on”. If the stack doesn’t make sense, it could be symbol (pdb) mismatch issue. If you are getting the event from your driver, make sure to set NonPagedMemory attribute to true. ex) \< EventProvider . . . NonPagedMemory="true" Stack="true" >