
This article covers the process of combining two data sets extracted via an Azure Synapse pipeline using Microsoft Graph Data Connect (MGDC). The steps to deploy the baseline Azure Synapse Analytics workspace to follow this demo are described in my blog here. For users who are not familiar with Azure Synapse analytics, it is a solution that provides a full Extract/Transform/Load (ETL) stack for your data.
We will demo two different approaches to combining data sets via Azure Synapse Analytics pipelines. The first approach will use Synapse Spark Notebook with PySpark scripts, while the second one will use the no-code Data flow approach instead. In both cases we will demo how to effectively combine the Microsoft 365 Messages data set, which contains emails, with the Microsoft 365 Users data set. We will be joining the two data sets on the pUser property which is common to both sets and identifies the record of specific users.
Option 1 – Using Synapse Spark Notebook
To get started, we will need to create a new Synapse pipeline. To do so, navigate to your Azure Synapse workspace, and open the Synapse Studio. From the main workbench, click on the Integrate button in the left navigation bar.

Figure 1 – Azure Synapse Analytics’ Integrate feature
Beside the Integrate header, click on the + button and select Pipeline from the drop-down menu.

Figure 2 – Creating a new Azure Synapse Analytics pipeline
We now need to add two Copy Data activities to our pipeline: one that will copy the Users (BasicDataSet_v0.User_v1) data set and one that will copy the Messages (BasicDataSet_v0.Message_v1) one. In our case, we have defined both activities so that they will return all fields from both data sets. For more details on how to configure Microsoft Graph Data Connect via the Copy Data activity, you can refer to the following article: Build your first Microsoft Graph Data Connect application.
For our demos, the extracted data will be copied to an Azure Data Lake Storage Gen 2 location. Also, it is important to note that the activity to extract information about messages will have a dynamic filter on the sentDateTime so that it only extracts information from the past 24 hours. Figure 3 below shows the new pipeline with the 2 Copy Data activities on the workbench.
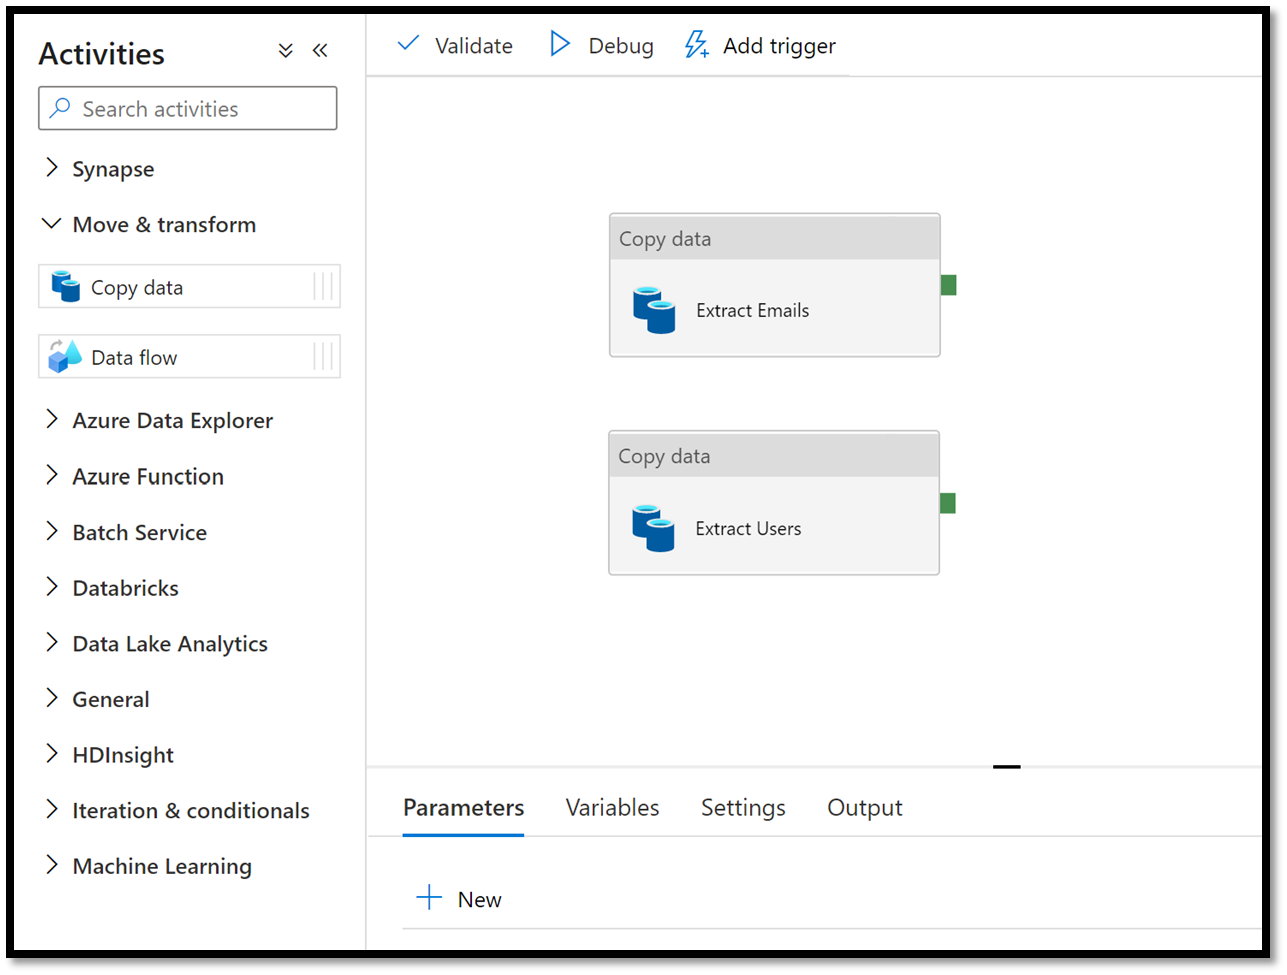
Figure 3 – Azure Synapse Analytics pipeline with MGDC copy data activities
Every time our pipeline executes, it will retrieve all emails that were sent in the past 24 hours (based on the dynamic filter mentioned previously) and will retrieve information about all users and have it stored in our storage account as binary files with JSON rows. We’ve configured our pipeline so that each activity copies its extracted data in a folder named accordingly (e.g., messages and users folders). For our scenario, we will schedule our pipeline to automatically get triggered every 24 hours, which means that every day it will generate a new binary file containing all emails from the past day. The issue, however, is that the same thing will happen with the users data extract, which will result in duplicate users being listed across files. We want to make sure that every time we run our pipeline we start with a fresh and most recent list of all users in our environment. To enforce this, we will add a new Delete activity (under the General category) and ensure all files are deleted from our users folder as a prerequisites to extracting the users data set.
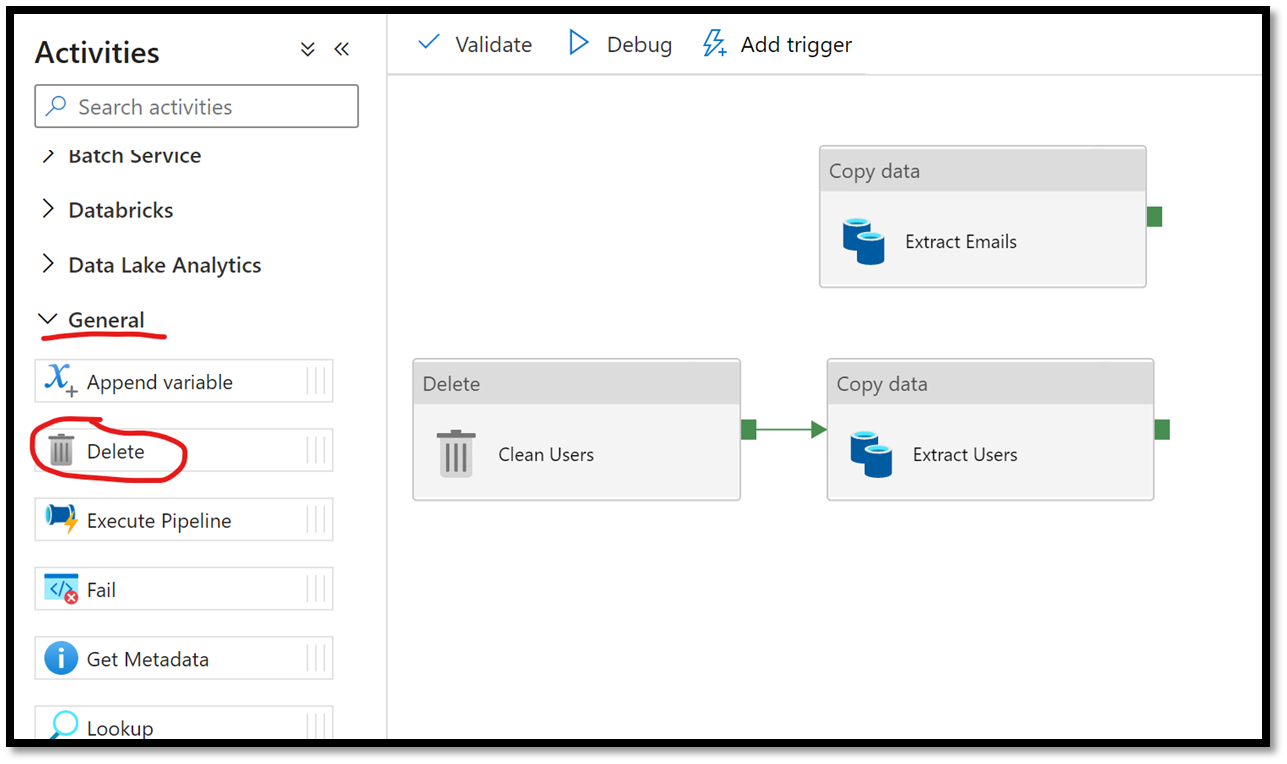
Figure 4 – Adding a new Delete activity to our pipeline
We will configure the delete activity to delete every file under the specified location as shown in Figure 5 below.

Figure 5 – Delete all files in the specified location
Under the Logging settings tab, we will simply uncheck the Enable logging checkbox.
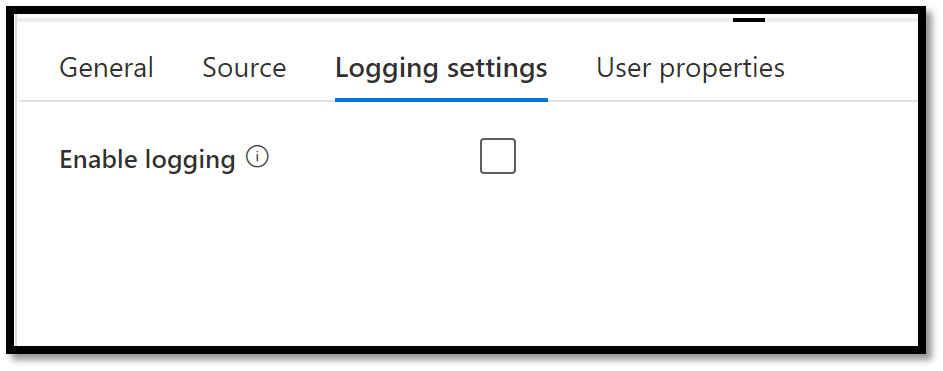
Figure 6 – Disabling logging on the delete activity
We are now ready to tackle the bulk of pipeline’s logic. From the Activities list, under the Synapse category, drag and drop a new Notebook activity onto the workbench, and make the two copy data activity prerequisites (see Figure 7).

Figure 7 – Add a new Synapse Runbook to the pipeline
From the workbench, select the newly added Notebook activity and in the property panel at the bottom, select the Settings tab. From there, click on the + New button to create a new notebook.
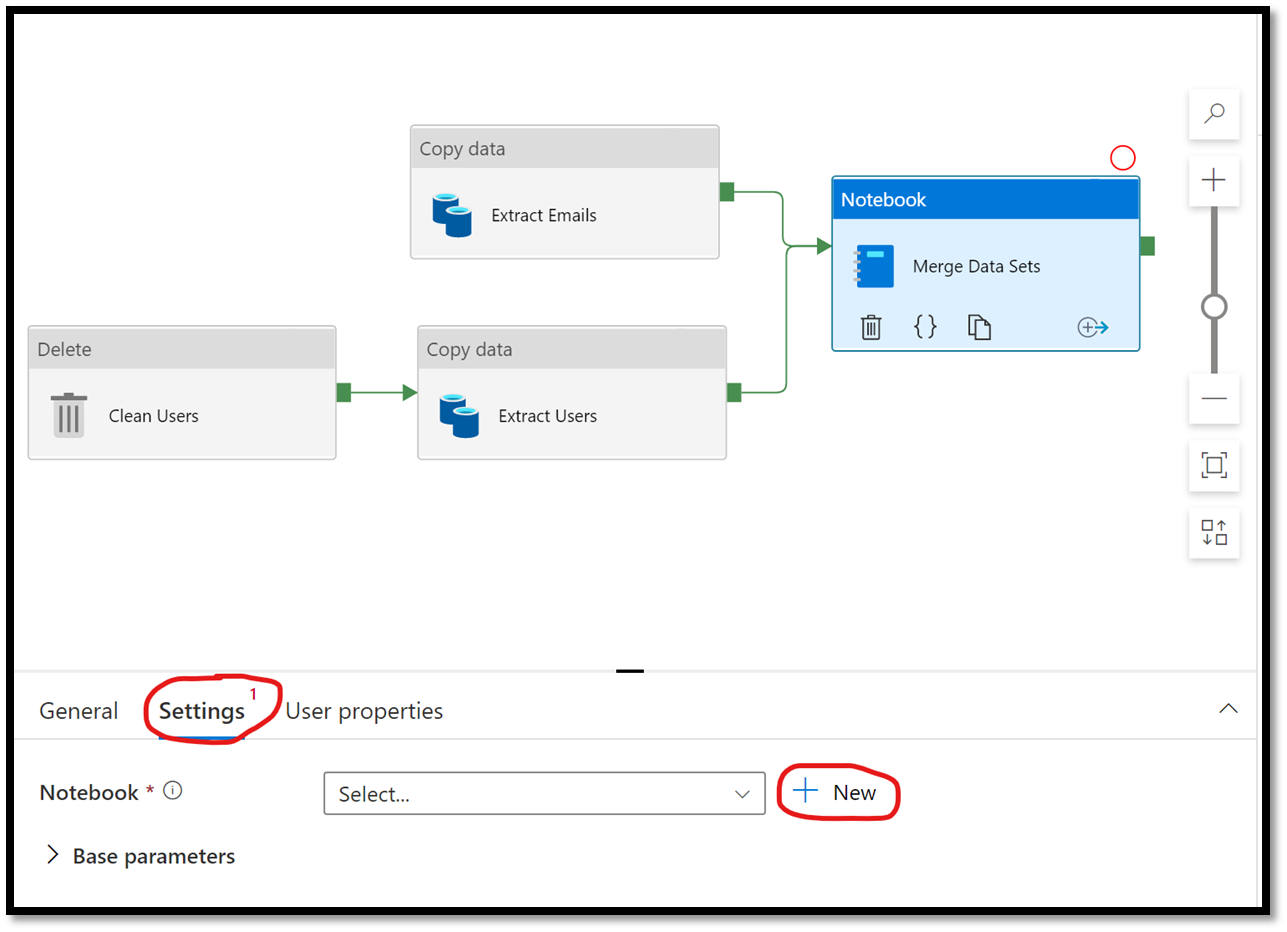
Figure 8 – Creating a new Azure Synapse Notebook
This will launch the Synapse Notebook editor. In the top menu bar, click on Attach to and select your Apache Spark pool from the list.
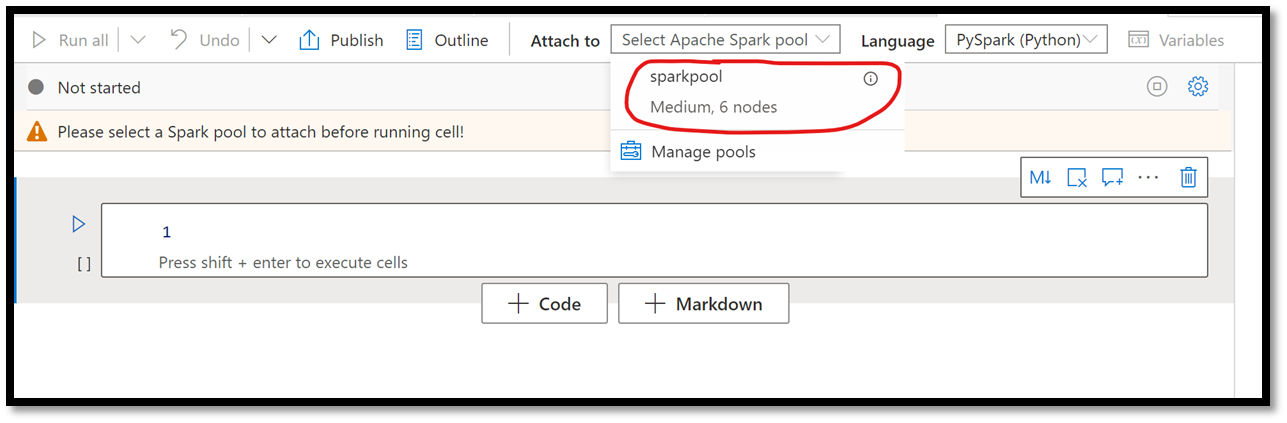
Figure 9 – Selecting Apache Spark Pool to run an Azure Synapse Notebook
In the script editor, copy and paste the following PySpark script, making sure to update the value of the filePathMessages and filePathUsers variables with the path to the location where your data is being extracted.
from pyspark.sql import functions as f
filePathMessages = "wasbs://<messages folder location>"
filePathUsers = "wasbs://<users folder location>"
storageAccountName = "<storage account name>"
storageAccountKey = "<storage account key>"
fileStorageUrl = "fs.azure.account.key." + storageAccountName +
".blob.core.windows.net"

spark.conf.set(fileStorageUrl, storageAccountKey)

messageDataframe = spark.read.json(filePathMessages).withColumn("sender_name",
f.col("sender.emailAddress.name")).withColumn("sender_address",
f.col("sender.emailAddress.address")).withColumn("from_name",
f.col("from.emailAddress.name")).withColumn("from_address",
f.col("from.emailAddress.address")).withColumn("to_name",
f.col("toRecipients.emailAddress.name")).withColumn("to_address",
f.col("toRecipients.emailAddress.address"))
try:
      # There is a chance that all entries in the ccRecipients column be empty
which will detect the schema as being a string array.
      # If it's the case, simply add the derived name and address columns as null
      data_type = dict(messageDataframe.dtypes)['ccRecipients']
      if data_type == "array<string>":
            messageDataframe = messageDataframe.withColumn("cc_name", f.lit(""))
            messageDataframe = messageDataframe.withColumn("cc_address",
f.lit(""))
      else:
            messageDataframe = messageDataframe.withColumn("cc_name",
f.col("ccRecipients.emailAddress.name"))
            messageDataframe = messageDataframe.withColumn("cc_address",
f.col("ccRecipients.emailAddress.address"))

      # There is a chance that all entries in the bccRecipients column be empty
which will detect the schema as being a string array.
      # If it's the case, simply add the derived name and address columns as null
      data_type = dict(messageDataframe.dtypes)['bccRecipients']
      if data_type == "array<string>":
            messageDataframe = messageDataframe.withColumn("bcc_name", f.lit(""))
            messageDataframe = messageDataframe.withColumn("bcc_address", f.lit(""))
      else:
            messageDataframe = messageDataframe.withColumn("bcc_name",
f.col("bccRecipients.emailAddress.name"))
            messageDataframe = messageDataframe.withColumn("bcc_address",
f.col("bccRecipients.emailAddress.address"))
finally:
      messageDataframe = messageDataframe.drop("from", "sender", "toRecipients",
"ccRecipients", "bccRecipients")

usersDataframe = spark.read.json(filePathUsers).withColumn("skuIds",
f.col("assignedLicenses.skuId")).withColumn("assignedPlanDates",
f.col("assignedPlans.assignedDateTime")).withColumn("assignedPlanServices",
f.col("assignedPlans.service")).withColumn("puser2",
f.col("puser")).drop("createddatetime","datarow","id","padditionalInfo","ptenant",
"rowInformation", "userrow", "puser", "pagerow")
results = messageDataframe.join(usersDataframe, messageDataframe.puser ==
usersDataframe.puser2,"inner").drop("puser2")

results.write.mode("overwrite").saveAsTable("Results")
The script will flatten the JSON’s hierarchy and rename some fields that are duplicated between the two data sets. It will then merge the two data sets and store them in a new table named Results in our default Synapse Lake database. We are now ready to publish our pipeline and then trigger its execution.
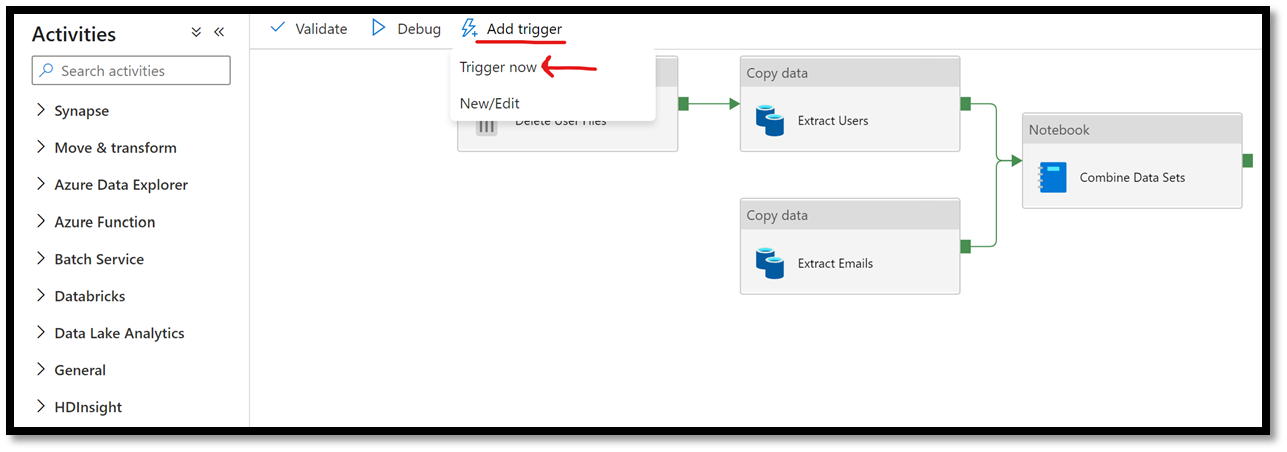
Figure 10 – Manually trigger an Azure Synapse pipeline
Executing the pipeline can take several minutes to an hour to complete its execution once approvers have approved the request, depending on the size of the data you are trying to export. Make sure you do not have any pending approvals for your pipeline so that the pipeline can successfully execute. Once its execution succeeds you can go and browse the default Synapse Lake database to visualize the combined data. To do so, click on the Data button in the left navigation (database icon), expand the Lake database menu, then the default database. Expand the table folder and click on the ellipses beside the newly created Results database. From the flyout menu, select New SQL Script and then Select TOP 100 rows.
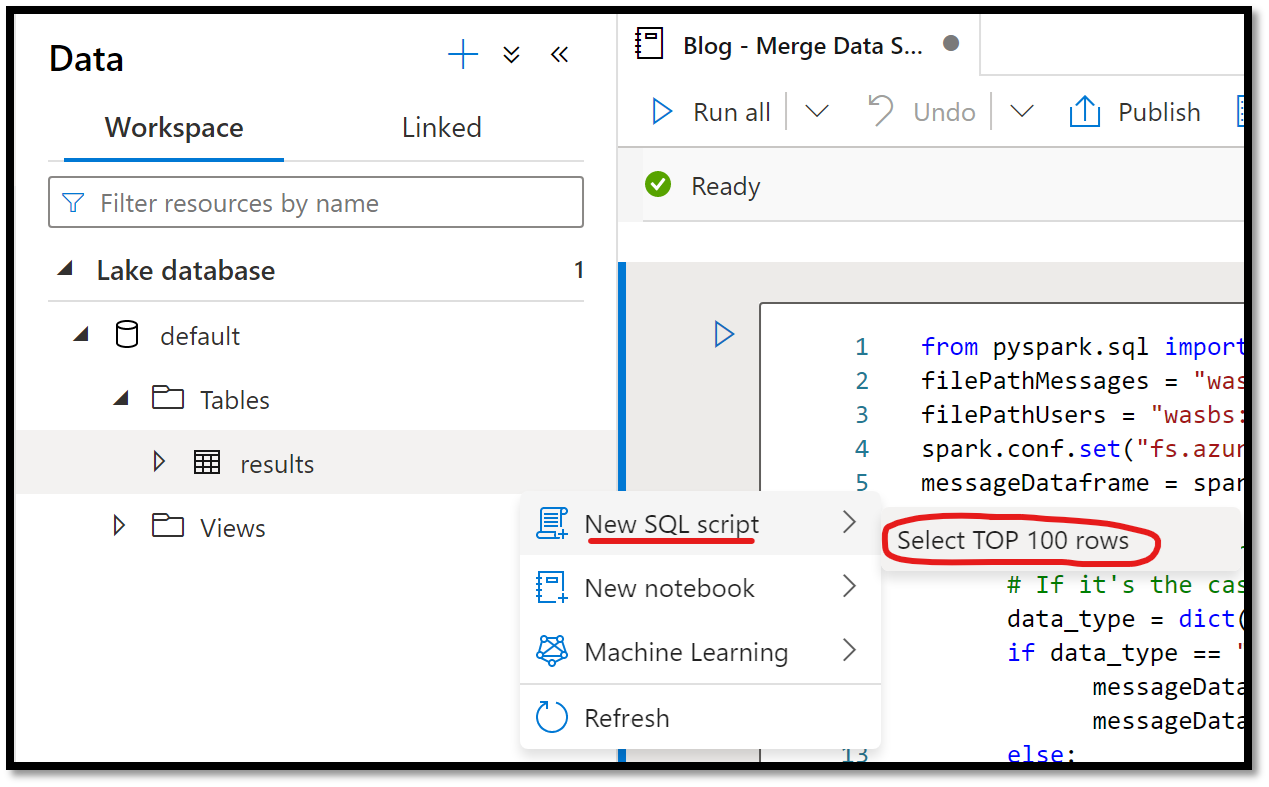
Figure 11 – Select Top 100 Rows in Lake Database
Next, execute the query by clicking on the Run button at the top of the query editor.

Figure 12 – Executing a SQL query in Azure Synapse Analytics
This will take a few seconds to execute. Once it succeeds, you should be able to review the merged data in your lake database.
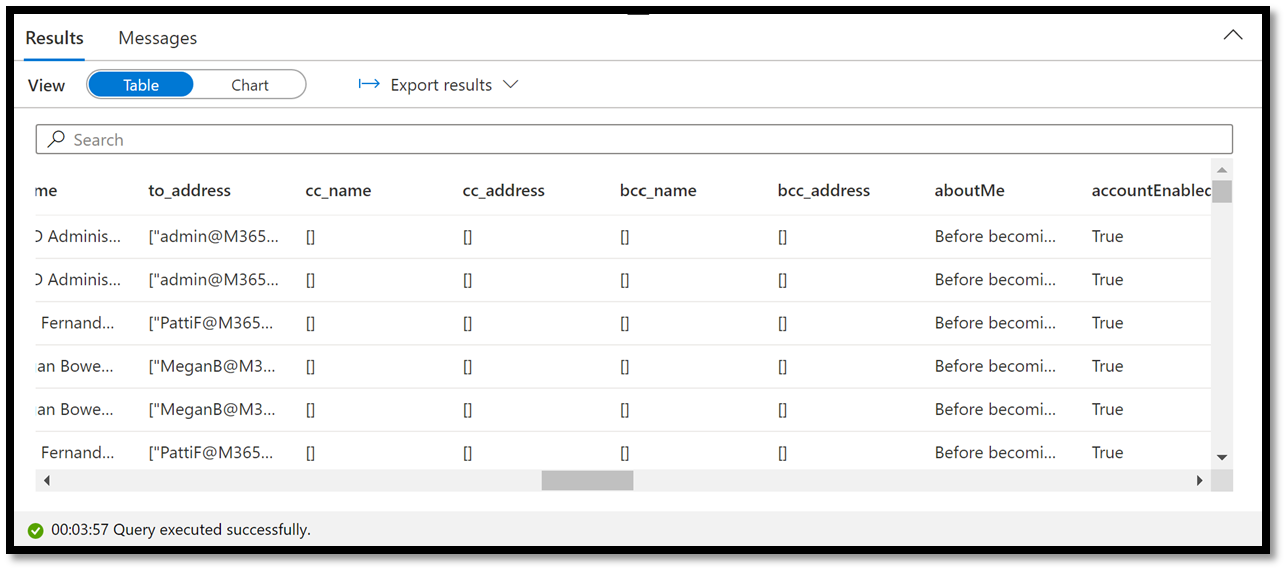
Figure 13 – Reviewing Merge Data in Query Editor
Option 2 – Using the No Code Data Flow Activity
If you are less familiar with Spark coding or if you simply want a no code solution for your pipeline, you can use the Data Flow activity inside of your pipeline to perform transformation on your extracted data. For this demo, we will clone the pipeline we created with Option 1 above, with the one difference that we will remove the Notebook activity and replace it with a Data flow activity instead. The figure below shows the overview of what the pipeline will look like.
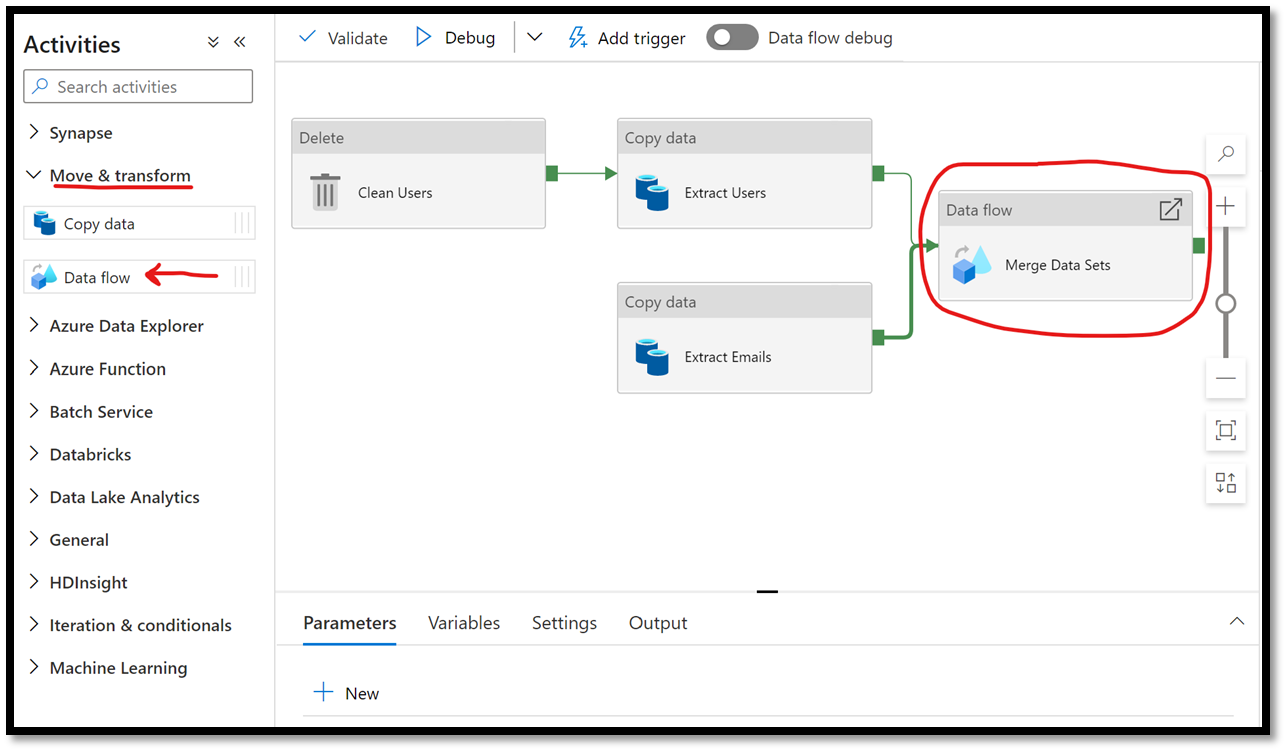
Figure 14 – Replacing the Notebook activity by a Data flow activity
To edit the flow’s logic, select the new Data flow activity from the workbench and in the property panel at the bottom navigate to the Settings tab. From there, click on the + New button to create a new flow.
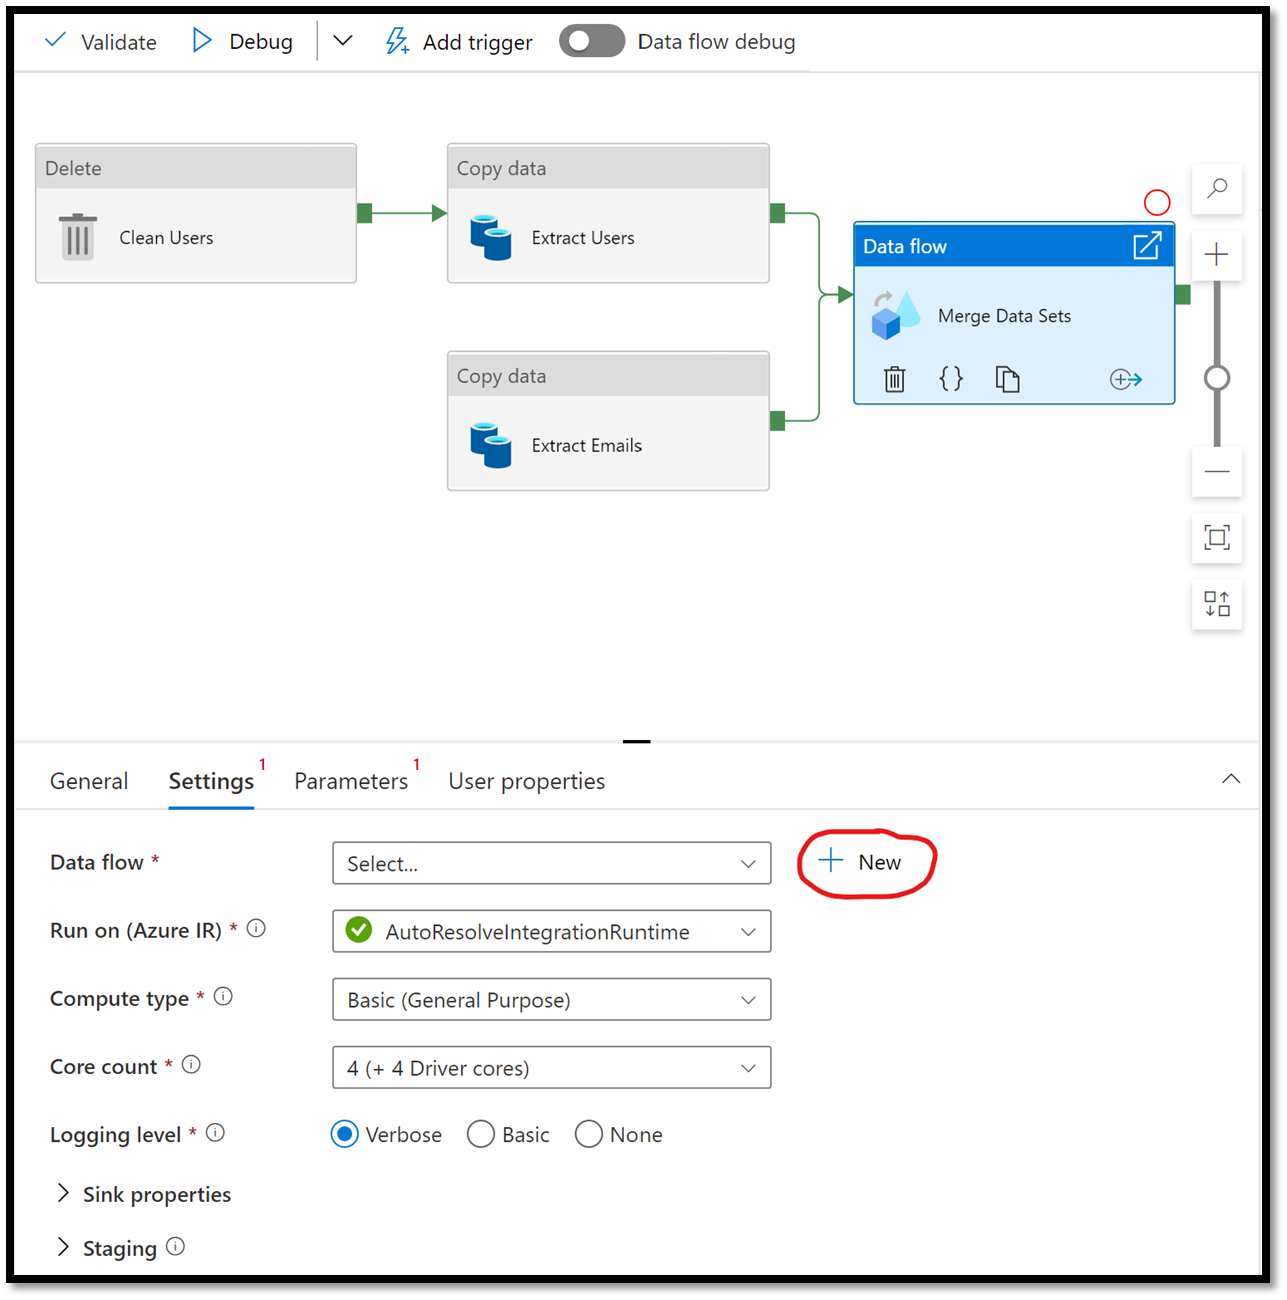
Figure 15 – Creating a new data flow
This will launch the data flow editor. The first thing we want to do is load the data we’ve exported as binary file and flatten their hierarchies. Let us start with the Messages data set. From the workbench, click on the arrow beside the Add Source shape and select Add Source from the flyout menu.
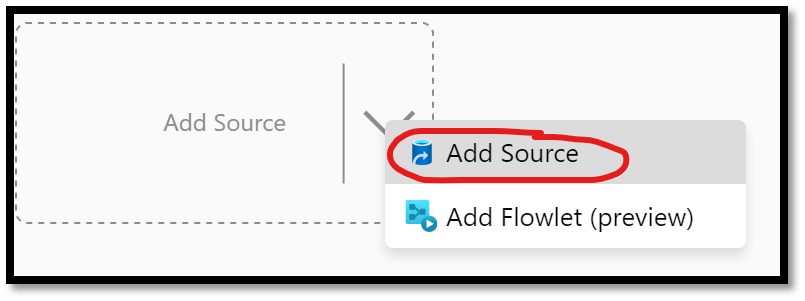
Figure 16 – Adding a new data source to our flow
From the property panel at the bottom, click on the + New button beside the Dataset field.
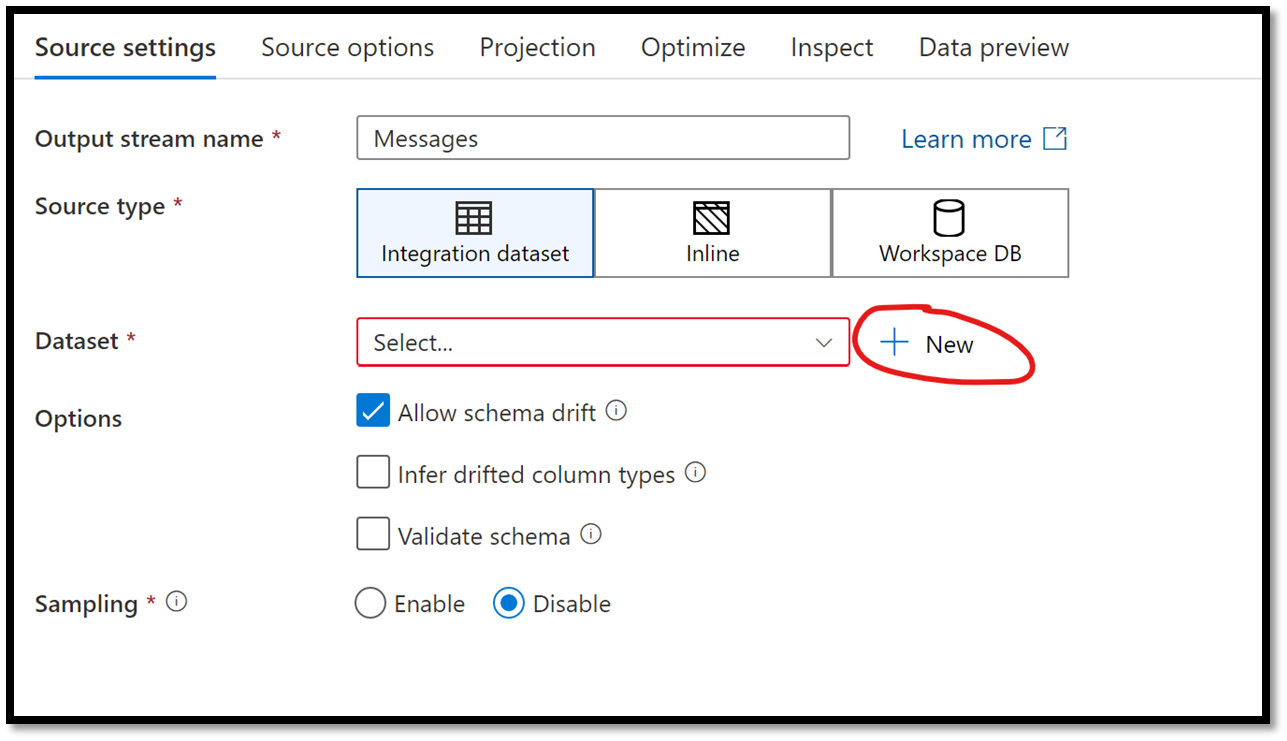
Figure 17 – Creating a new data set link
From the Integration data set blade, select Azure Data Lake Storage Gen2 and click on the Continue button at the bottom.

Figure 18 – New Azure Data Lake Storage Gen2 integration data set
On the data format selection blade, select JSON and click on the Continue button at the bottom.
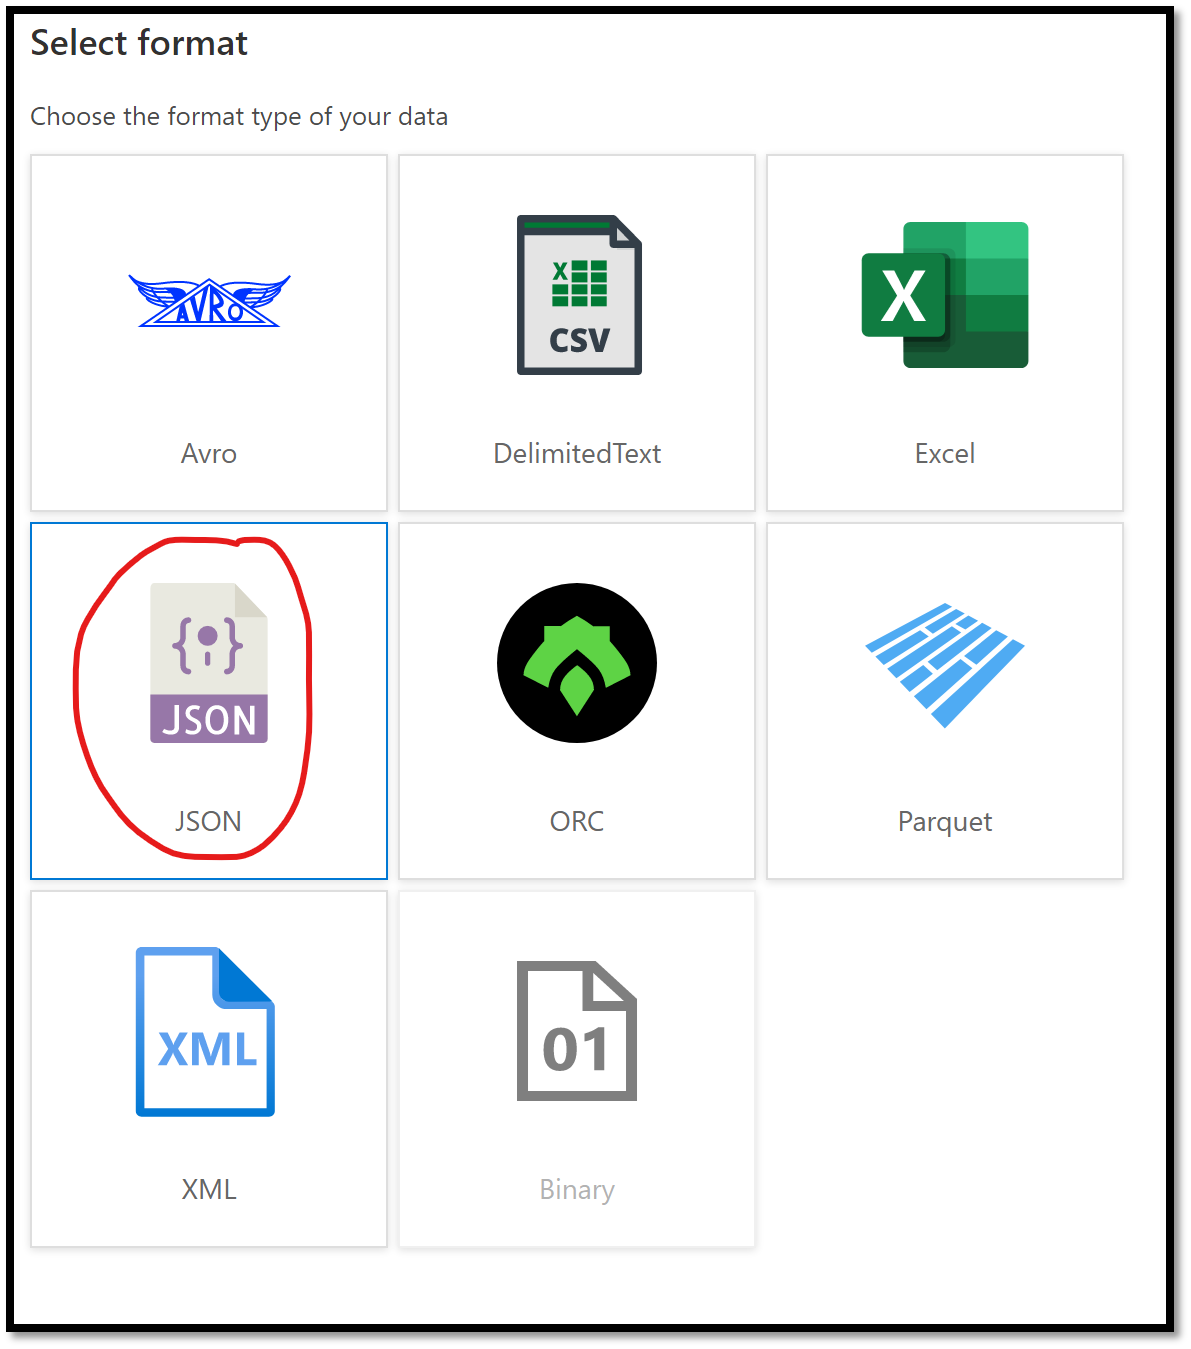
Figure 19 – Selecting JSON format for our integration data set
On the Set properties blade, select the linked service you’ve previously created to your Azure Data Lake Storage location, specify the path to the folder where your messages data is being exported and click on the OK button at the bottom.
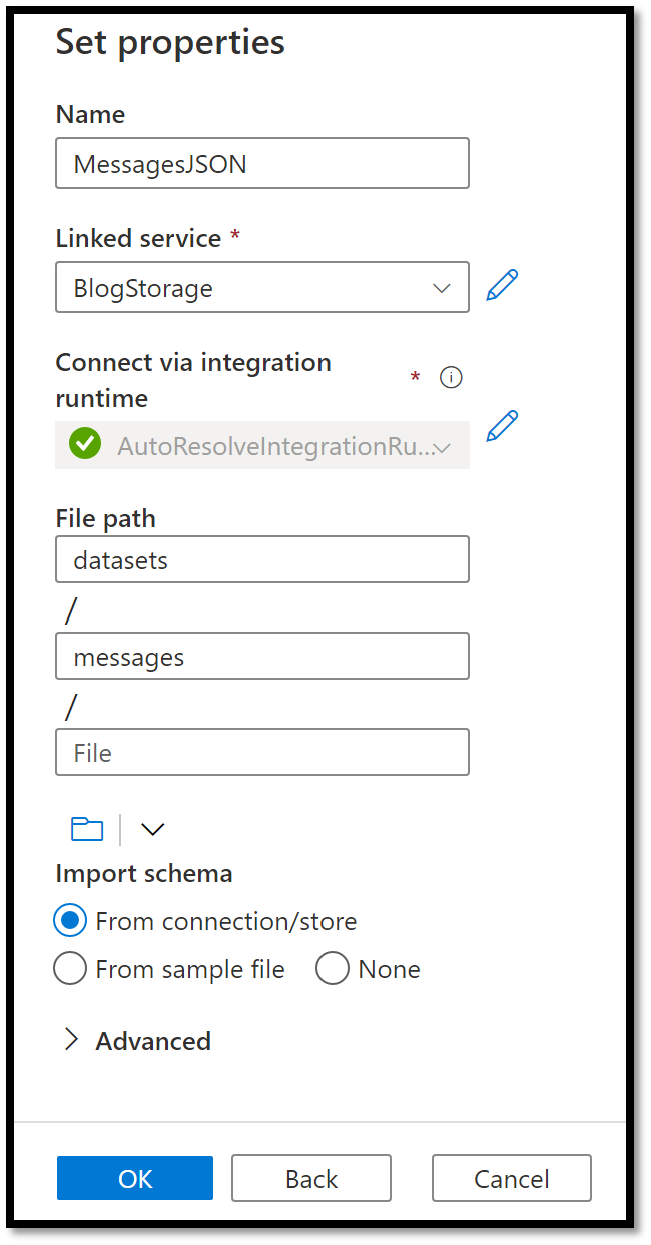
Figure 20 – Selecting files location for our integration data set
Repeat the same process, but this time for the Users data set. Make sure you set the path to point to the Users folder. At this stage, you should have a Data Flow that looks like the following:
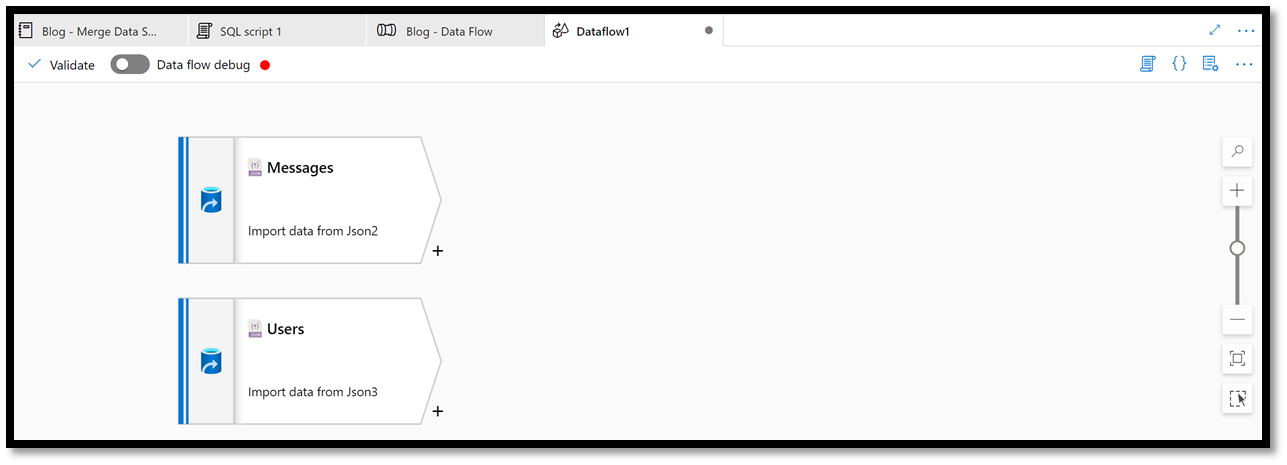
Figure 21 – Data flow with just two sources
Next, we need to combine the two data sources. To do so, click on the + sign on the right of the Messages source in the workbench. From the list of actions, select Join.
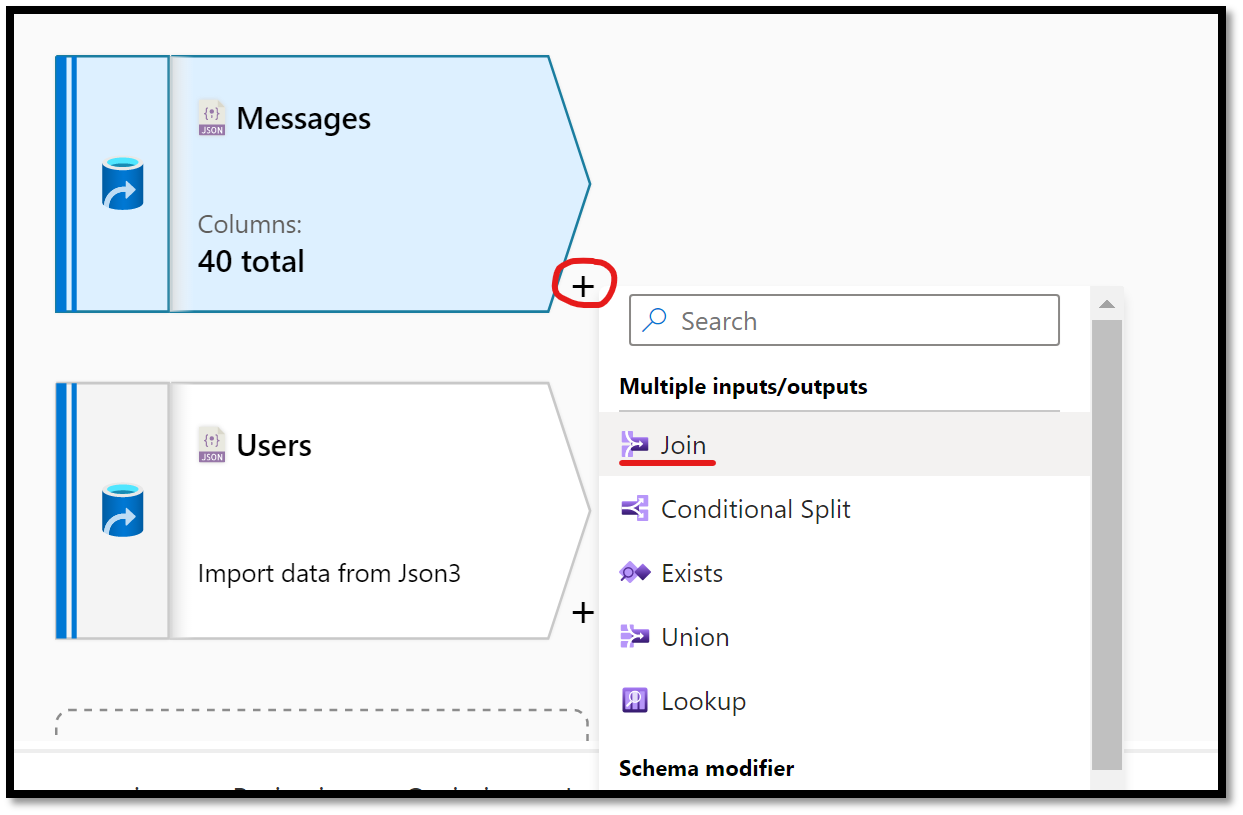
Figure 22 – Adding a Join Action to a data flow
In the editor panel at the bottom, select the Users source in the Right Stream drop down. For the Join condition make sure to select the pUser field for both sources.
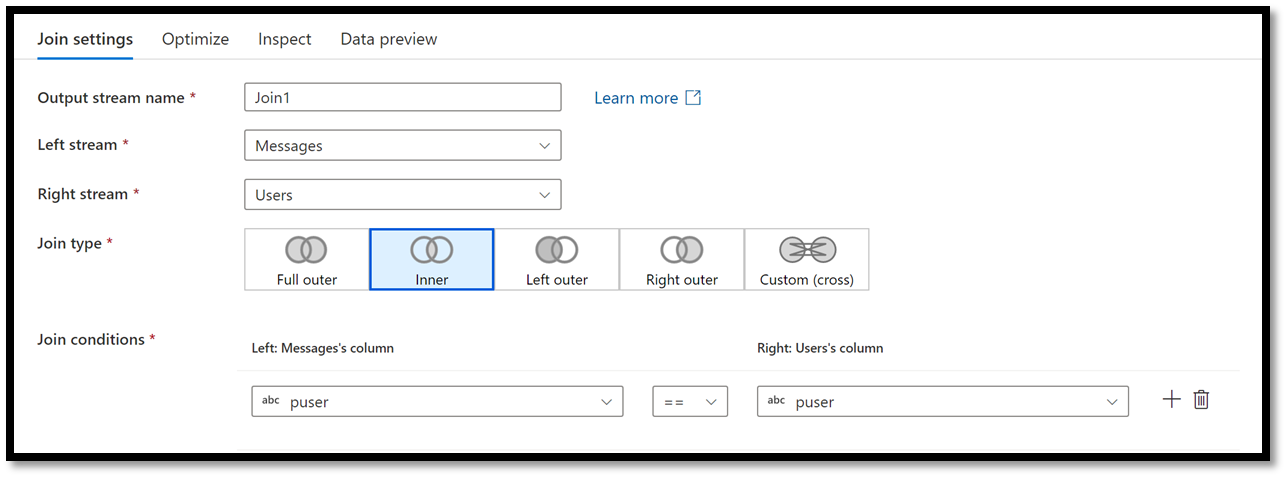
Figure 23 – Configuring a Join Action on the pUser Field
Because both data sets will contain fields that are named the same, running the flow as-is would throw errors complaining about duplicate columns (e.g. pageRow). To remediate to the issue, we will need to add a select action after the Join action to skip duplicate columns since we do not need them both for our scenario. In the workbench, beside the Join action added above, click on the + sign and select the Select action from the list.
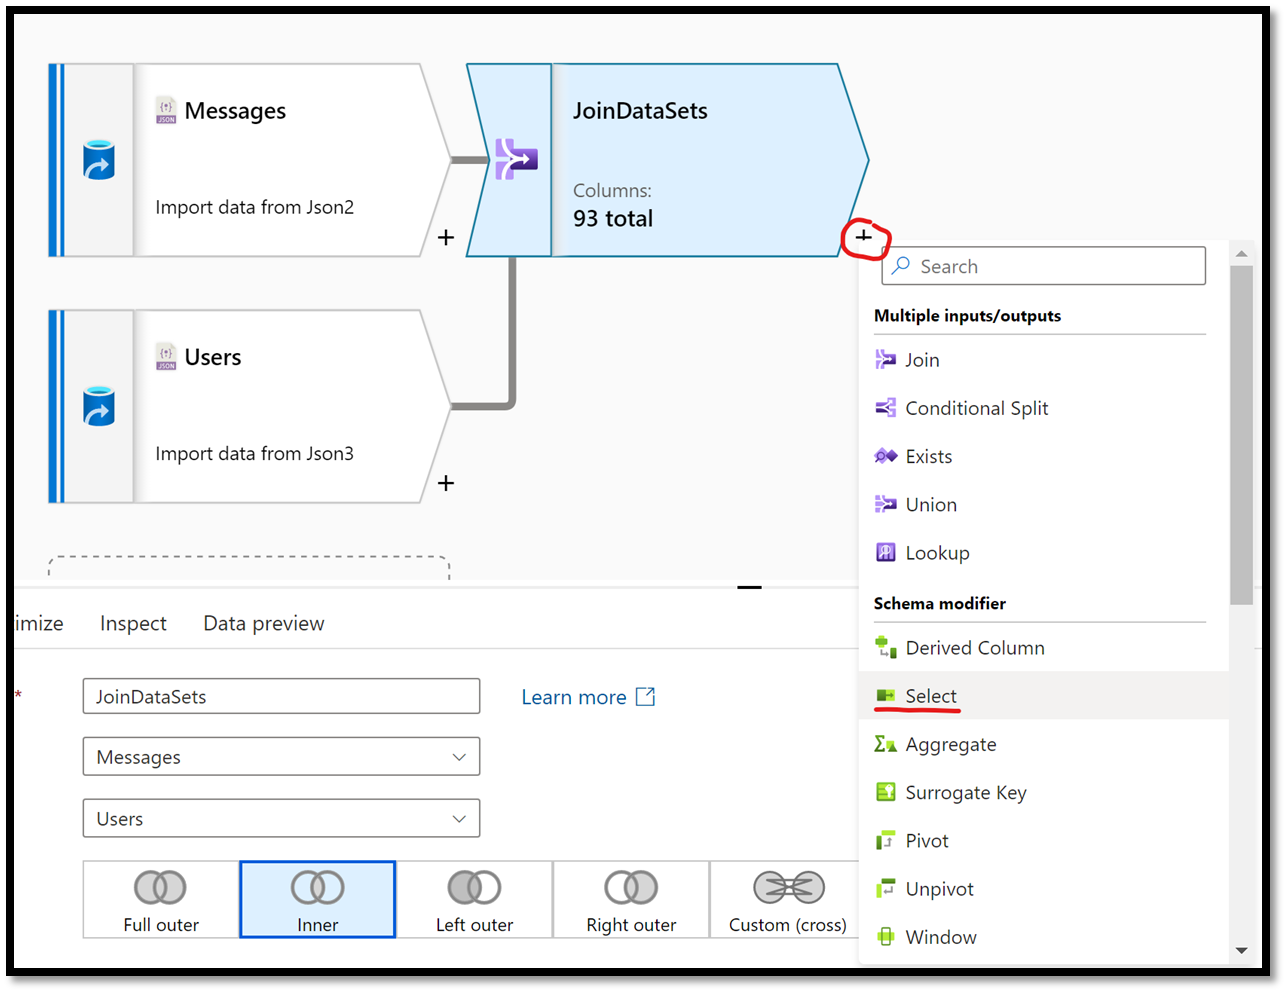
Figure 24 – Adding a Select Action to a data flow
Simply leave the default values, which by default will skip the duplicate columns.
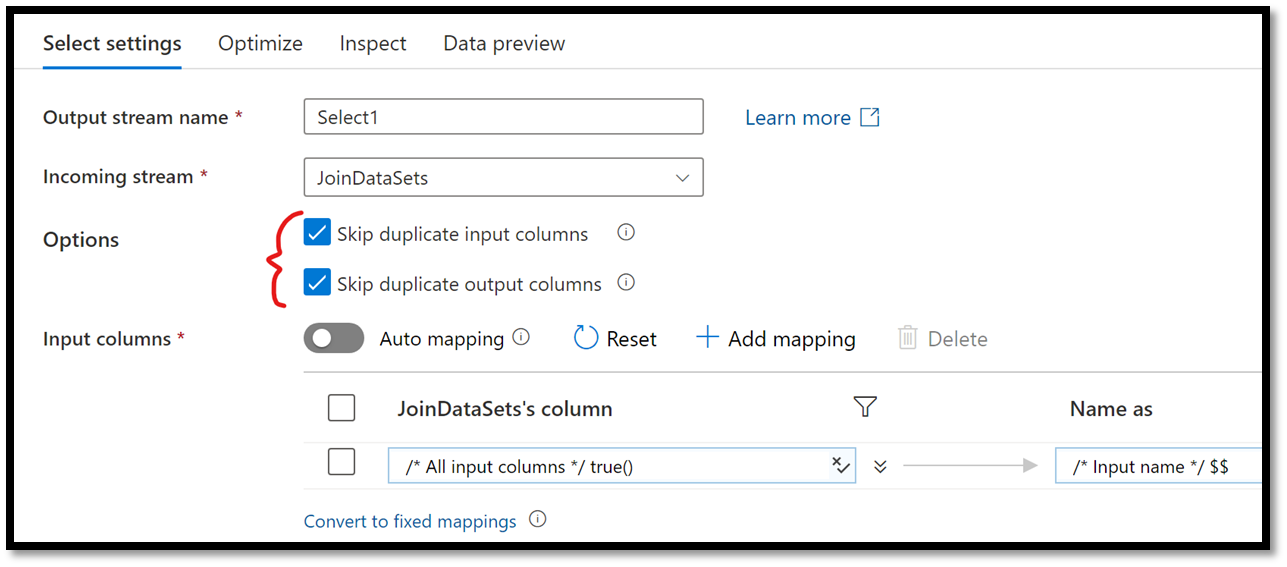
Figure 25 – Configuring the Select Action
The last step in our data flow is to determine where to store the combined data. In our case, we will be selecting a new workspace as the data sink. In the workbench, beside the newly added Select action, click on the + sign and select Sink from the list.
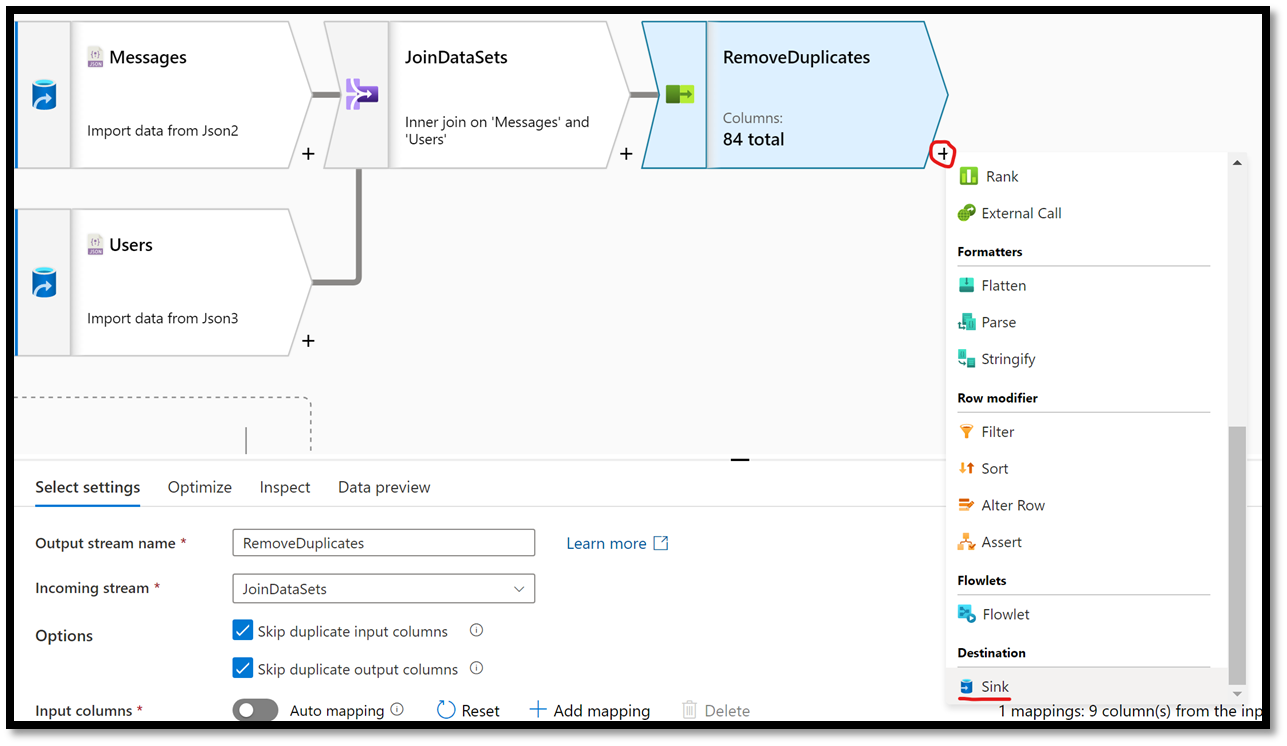
Figure 26 – Adding a Sink Action to a data flow
In the editor panel at the bottom, select Workspace DB from the Sink type list, select the default database from the database list, and type in Results as the name of the table. Note that this will create a new table named Results in the default database and store the combined data sets in it.
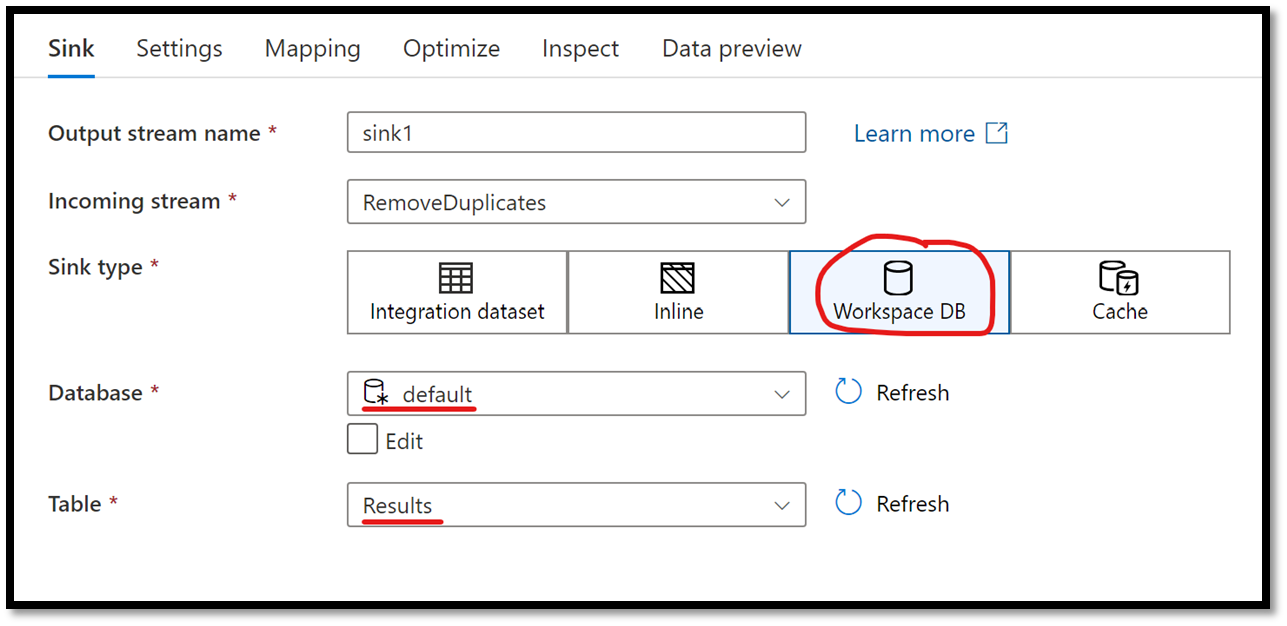
Figure 27 – Configuring the Sink Action for our data flow
This completes the steps required to combine our data sets using a Data flow activity. You can now publish your pipeline and execute it. Once it successfully completes, you can follow the steps from the previous section (Option 1) to check the merged data using the SELECT TOP 100 ROWS query.
Conclusion
In this article, we have shown you two ways of combining data sets extracted from Microsoft Graph Data Connect using Azure Synapse Analytics. While developers may tend to prefer the Spark Notebook approach (Option 1) over the low-code approach described in Option 2, note that both approaches will result in the same outcome. You should choose the approach you and your organization are more familiar with. The data we have exported and combined could then be connected to a Power BI dashboard using its Azure Synapse Analytics connector to generate valuable Insights and Analysis for your organization.
0 comments