

We are happy to announce that we have released the Embedded Tools extension for Visual Studio Code. These capabilities are the same as what we recently announced for Visual Studio 2022. Used in conjunction with the new vcpkg artifact capabilities you can quickly bootstrap an embedded development machine and get started.
In this post we will walk you through how to acquire embedded tool dependencies with vcpkg, then demonstrate edit, build, deploy, and debugging directly in VS Code with new peripheral register and RTOS object views. We will demonstrate all of this with an Azure RTOS ThreadX project.
Azure RTOS ThreadX is a widely used Real Time Operating System (RTOS) used on billions of microcontrollers (MCUs) in products around the world. We have dedicated pages for VS Code usage in the getting started guides for the Azure IoT DevKit, NXP 1060, and STMicro STM32L4_L4+ IOT01A boards (L475E or L4S5I). The techniques used for interacting with these boards should be applicable to other targets by changing configuration information we’ll highlight throughout.
Installation
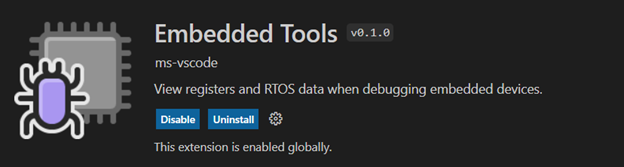
To get started install VS Code, then in the extensions side bar search for Embedded Tools and install it.
Using vcpkg to acquire embedded tools
One of the challenges in embedded development is getting the tools necessary installed and configured. It is not uncommon to have different compilers used for different projects, custom debug tools, etc. This is where the new artifact capabilities in vcpkg can help us. Today we’ll demonstrate using vcpkg from a PowerShell prompt to activate our embedded development environment, but you can use the shell you prefer on your platform. In a future release this will be integrated into a Visual Studio Code extension for a more seamless experience.
From a PowerShell prompt, clone the Azure RTOS getting started repo. This sample will serve as our example project for the remainder of this post.
git clone --recursive https://github.com/azure-rtos/getting-started.git
Navigate to the subfolder for the board you are using, here I’m using the Azure IoT DevKit.
cd ./getting-started/MXChip/AZ3166
If you haven’t already, install vcpkg.
Linux/macOS
. <(curl https://aka.ms/vcpkg-init.sh -L)
PowerShell
iex (iwr -useb https://aka.ms/vcpkg-init.ps1)
CMD Shell
curl -LO https://aka.ms/vcpkg-init.cmd && .\vcpkg-init.cmd
In the project folder, there is a file vcpkg_configuration.json. This manifest file was created with vcpkg and has recorded the tools you need to build and debug this project. See the vcpkg artifacts post for details on how to create your own manifest. Running the vcpkg activate command will use this file to determine if I have those tools, install them if I do not, then activate them in my environment for use.
vcpkg activate
So, in three commands we have cloned our embedded project, installed vcpkg, acquired and activated the necessary tools for building the project.
Using VS Code for embedded development
In the previous section we used vcpkg to acquire the tools for our embedded project. Today vcpkg is not integrated in Visual Studio Code. So, at present we need to launch VS Code from the environment we activated at the command line so those tools are available for its use as well.
code .
Now that we have the project open in VS Code it is ready to go as any other CMake project. VS Code can run the CMake build using the preconfigured CMakePresets file with the compilers vcpkg acquired. Select the preset arm-gcc-cortex-m4 when prompted on opening the folder.
All the editing power of VS Code is now available for use with the embedded project. With this Azure RTOS project we’ll cover code navigation, IntelliSense, build, deploy, debugging. We’ll also cover new diagnostic capabilities around peripheral registers and RTOS object views.
Code Navigation and IntelliSense
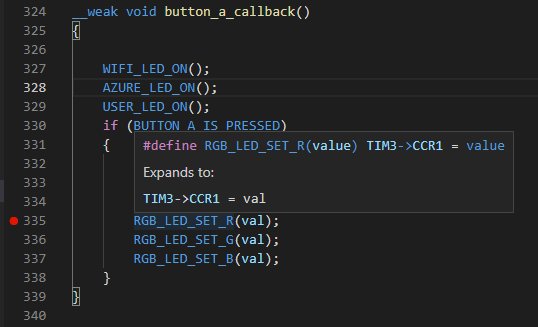
Use Ctrl + T to open symbol search and type button_a_callback, select the button_a_callback function to navigate to it. Note on hover that this function expands to TIM3->CCR1 which is a peripheral register on the board which we’ll inspect while we are debugging.
Build, Deploy, and Debug on hardware
Set a breakpoint on RGB_LED_SET_R().
To see how the launch is controlled in the sidebar open .vscode/launch.json and look at the launch configuration. You can see the miDebuggerPath set to use arm-none-eabi-gdb while the debugServerPath is set to invoke openocd with the configuration script in debugServerArgs. The information for describing peripheral registers is provided by the MCU manufacturer in an SVD file that we point to with svdPath. This project is configured to break on entry with the property stopAtConnect.
Now, with your board plugged into the PC with ST-LINK drivers installed, select the debug icon in the activity bar and make sure Run and Debug is set to Launch. Now F5 will work using openocd acquired by vcpkg to flash and debug the attached board. Execution stops at the entry function, so here we see the assembly code for that. We can also view the disassembly by right clicking the function in the call stack window, Open Disassembly View.

Press continue to let execution continue.
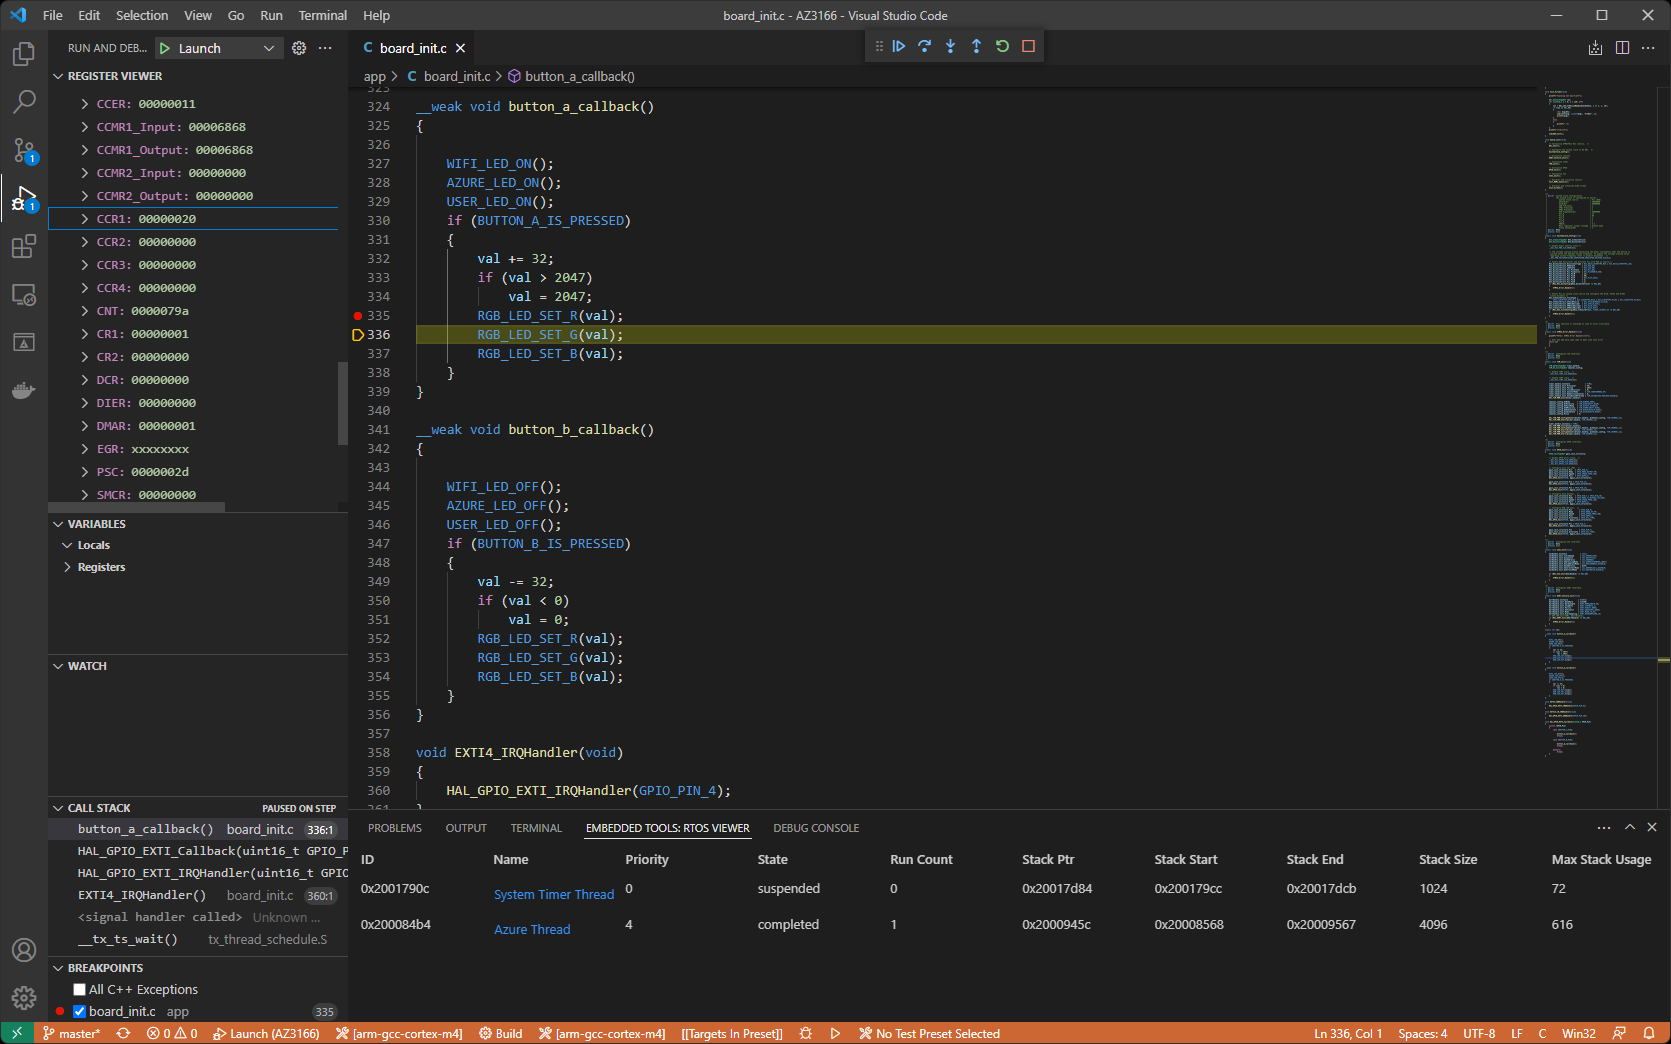
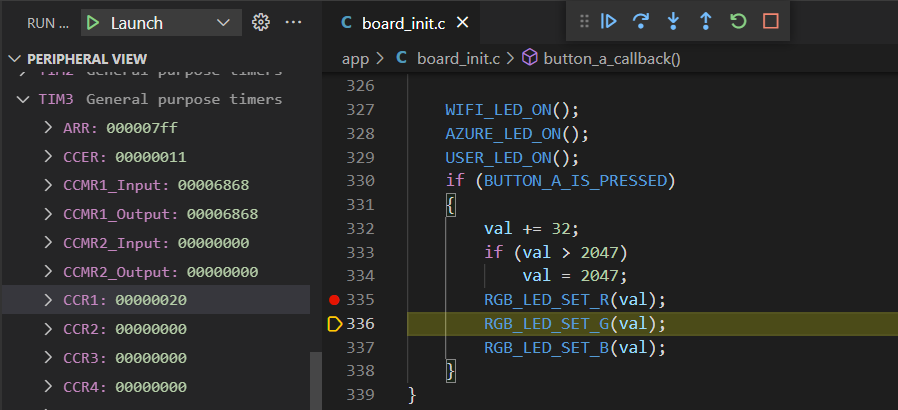
Peripheral Registers
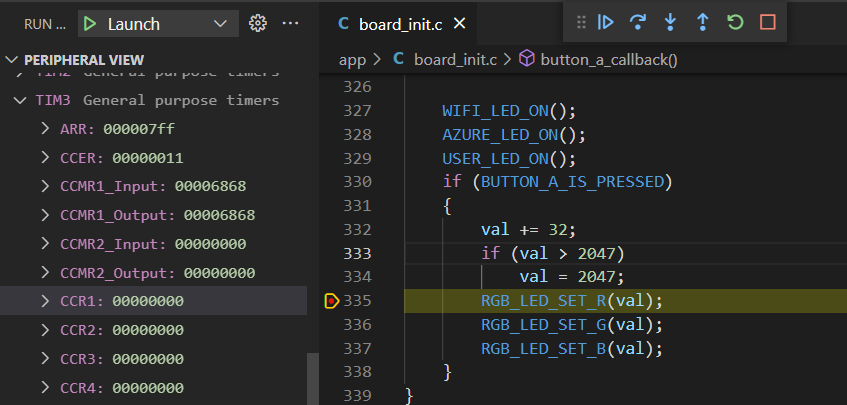
Now press the A button on the board. This has triggered our breakpoint. We can now go to the command palette Ctrl + Shift + P and enter “peripheral”, select Focus on Peripheral View View. This opens the peripheral register view using the information from our SVD file specified in the launch configuration. We can now scroll through this list to find the register we are interested in, here TIM3->CCR1 which will update when we step over the RGB_LED_SET_R function.
On break
After stepping
RTOS Object Views
VS Code threads view won’t show you the threads in our Azure RTOS application. Why not? A good explanation can be found in this white paper on Real Time Operating Systems.
“A Real-Time Operating System is system software that provides services and manages processor resources for applications. These resources include processor cycles, memory, peripherals, and interrupts. The main purpose of a Real-Time Operating System is to allocate processing time among various duties the embedded software must perform. This typically involves a division of the software into pieces, commonly called “tasks” or “threads,” and creating a run-time environment that provides each thread with its own virtual microprocessor (“Multithreading”). Basically, a virtual microprocessor consists of a virtual set of microprocessor resources, e.g., register set, program counter, stack memory area, and a stack pointer. Only while executing does a thread use the physical microprocessor resources, but each thread retains its own copy of the contents of these resources as if they were its own private resources (the thread”s “context”).”
So for embedded development ideally you would have views that could show you information about these RTOS objects. To see the new available RTOS objects views, go to the command palate Ctrl + Shift + P and enter “rtos” then select Focus on RTOS viewer view
This will open the threads view that shows at a glance much of the information you would commonly need during embedded development, thread ids and names, how many times they have run, where the stack starts, ends, and its size as well as the maximum stack usage.

There are other views for additional ThreadX objects like block and byte pools, events, mutexes, queues, and timers. You can find these by selecting the three dots in the RTOS Viewer panel.
We also have RTOS object views for FreeRTOS though the available objects there differ based on what it supports.
Hardware breakpoint limits
One last debugging capability to call out is that embedded hardware targets commonly have a limited set of hardware breakpoints available. Setting too many can corrupt the debugger state. As such we have added hardwareBreakpoints to launch.json. For this board that is set to what it supports which is 6. If we set more than that we will see the breakpoint is not set but will show as a gray empty circle.
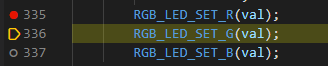
If you mouse over the breakpoint in the breakpoints view you will see a warning that it won’t be hit. This prevents corrupting the connection to the board and allows us the opportunity to unset some other breakpoints and continue debugging uninterrupted.
Send us your feedback
We hope that these new capabilities will enable you to choose VS Code for your embedded development needs and make you more productive. We are very interested in your feedback to continue to improve this experience. The comments below are open, or you can find us on Twitter (@VisualC), or via email at visualcpp@microsoft.com.
how does this correlate or add up to Platformio?
This looks great and it's definitely a start. I'm stl praying for the day that VS code let's you drag tabs out of the main windows like every modern IDE in the world. Having multiple displays for your code and only one vs code instance is not fun. As far as register views that's great ,I've watch for variables and the ability to graph variables as they change like eclipse and visual studio IDE do would be great also. Searchable registers would great sometimes finding the exact thing you'reooming for and going through all registers is daunting. And highlighting what...
Hi Marc, I am from PRC marketing team. Our dev audience in China will be interested in this content. Would you mind if I translate it into Simplified Chinese and publish in our managed social platform? We won’t change any wording for sure. Thank you.
Much appreciated to see developments on embedded support. It will be interesting to see how this will stack up against the de-facto debugging plug-in “cortex-debug”.
One critical feature would be multi-threading support in the call stack. Is this supported or planned?