
Hopefully you’ve seen our support for debugging C++ code on Android in Visual Studio 2015. Now in our RC release we’re pleased to announce that we’ve added support for natvis files to help visualize your native types.
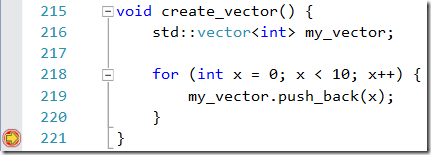
Customers using our previous CTP versions let us know that having natvis support for common classes such as the Standard Template Library (STL) container classes (e.g. vector, map, stack, queue, etc.) would be extremely helpful when debugging. To see natvis in action, let’s look at a quick example of what inspecting a vector looks like with and without natvis. For the purposes of this sample I created an Android Native Activity project, and added a function that creates a vector and pushes 10 values into it.
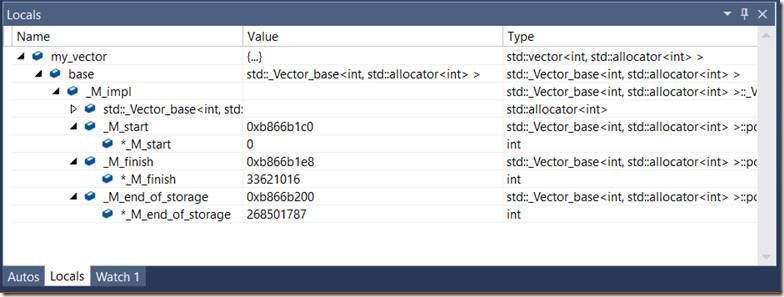
First let’s look at the experience without natvis. It turns out that finding the count and individual items in the vector is actually not possible by just browsing the object in the debugger.
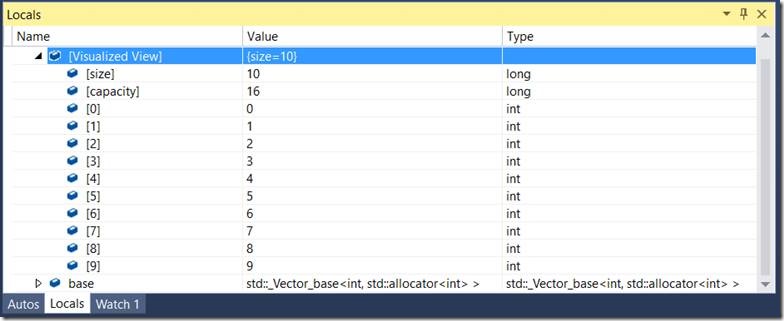
Now I’ll do the same exercise with a natvis file for the vector. When I first expand the vector I see two options, “[Visualized View]”–the view natvis will give me, and “base”—the view that represents the non-visualized view I had previously. Immediately you can see the “Value” column for the [Visualized View] shows me the number of objects in the vector (size).

Expanding the [Visualized View] shows me the size, capacity, and individual values stored in the vector.
If you’re familiar with the windows natvis experience you’ll notice that you have to explicitly choose to expand the natvis view rather than having it applied by default. This was due to the fact that gdb can be very slow to evaluate the expressions which would severely impact the performance of stopping at breakpoints and stepping if we automatically applied it.
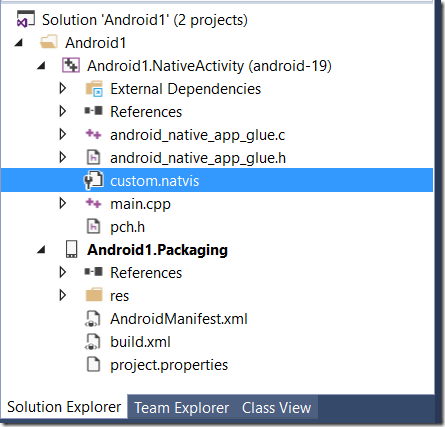
You can of course create your own natvis files for any classes for which you need better visualizations (I recommend reading this blog post on how to write maintainable native visualizations). You can add these entries to the Microsoft.Android.natvis file that installs with Visual Studio (see below). However, the easier and recommended way is to create your own natvis file, and add it to the root of the project you are debugging (this also allows you to check it into source control with the project).
We’ll be including visualizations for common containers with Visual Studio 2015 in future releases, but to get started quickly with RC use the attached file that contains definitions for implementations of:
- std::list
- std::vector
- std::map
- std::set
- std::array
- std::forward_list
- std::queue
- std::priority_queue
- std::bitset
- std::valarray
- std::__1::vector
- std::__1::map
To use it, download the attached Microsoft.Android.natvis file and replace the copy that installed to [Visual Studio 14 Root]\Common7\IDE\CommonExtensions\Microsoft\MDD\Debugger.
Beyond natvis, we have worked to fix bugs and improve the performance of debugging since our last release. Please let us know how the new natvis (and overall Android debugging) experience works for you, and report any issues or overall feedback below, through the Send a Smile feature in Visual Studio, or in our MSDN forum.
0 comments