In Visual Studio 2013 Update 2 and also in the earlier CTP releases of Visual Studio 2015, we released a memory diagnostic tool that allowed developers to take heap snapshots of their application and then examine the heap contents upon terminating their application. The initial release supported viewing managed and native objects in the heap, and an update in the first Visual Studio 2015 CTP added support for native type derivation and value inspection.
While this tool was a good start in providing Visual Studio developers with an in-box memory profiler, it lacked the ability to easily examine heap contents at a specific program state since the entire program had to be shut down in order to drill deeper into the data.
Improved Memory Profiler for Preview
Now there is a new and improved memory profiler available in Preview that allows developers to leverage the debugger’s powerful control of program flow and examine their app’s heap contents at any break state. Here is a great overview of the new memory profiling experience with an in-depth feature summary complete instructions on activating the feature (Where do I find it? section). Upon following these instructions to activate the tool for the first time, simply pressing F5 will launch the new profiler during the debug session. There is now no longer a need to terminate the app to view the heap snapshots!
The rest of this post will focus primarily on using the new tool with native applications and details the specifics of the tool’s workflow.
Walkthrough: Profiling a Native MFC App
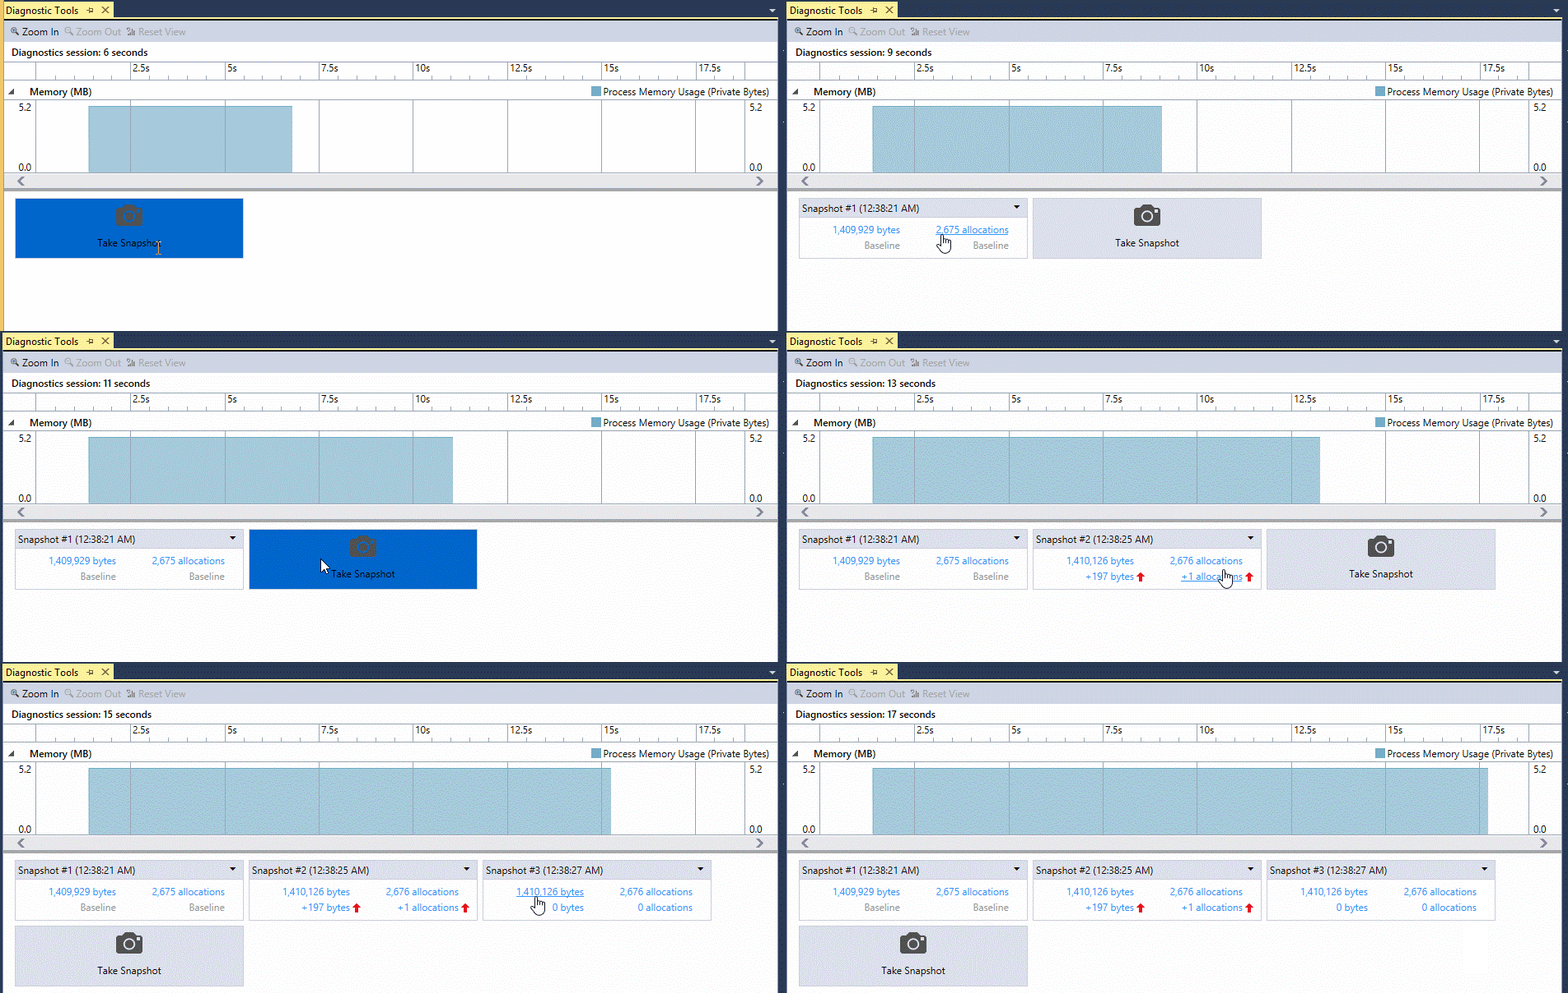
To show off the new memory profiler, an MFC open-source chip-tune sequencer called FamiTracker has been loaded into Visual Studio and modified slightly to build with the new compiler. After enabling the memory profiler via the reg key and starting a debug session on the app with F5, the tool loads and soon the live memory usage is shown and the heap snapshot reel appears below it:
Snapshots can be taken at different points in time to capture the heap state. Instance values are only viewable for the most recent shot and when in a break state.
In this walkthrough, the initial program state for FamiTracker is the initialized sequencer UI:
FamiTracker Initial Sequencer UI
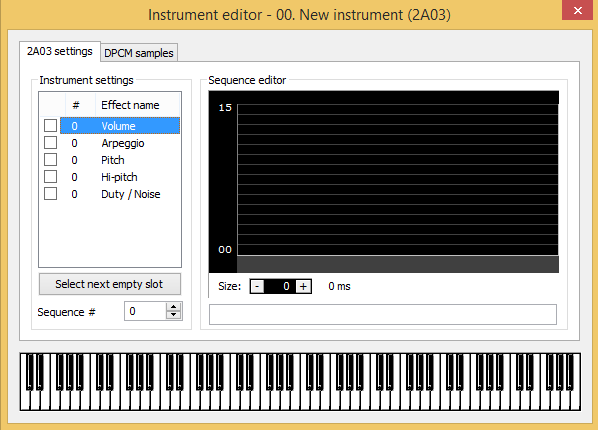
Another dialog called the instrument editor can be launched to edit the properties of each instrument:
FamiTracker Instrument Editor Dialog
Using the new memory profiler, we will take heap snapshots across these two program states to better understand the runtime memory consumption of this app.
First we take a baseline snapshot to store the initial heap contents.
The instrument editor dialog is opened, which triggers a breakpoint in the code and begins a change in program state. This function initializes the instrument editor dialog and calls a few other helper functions that will help create the instrument editor UI.
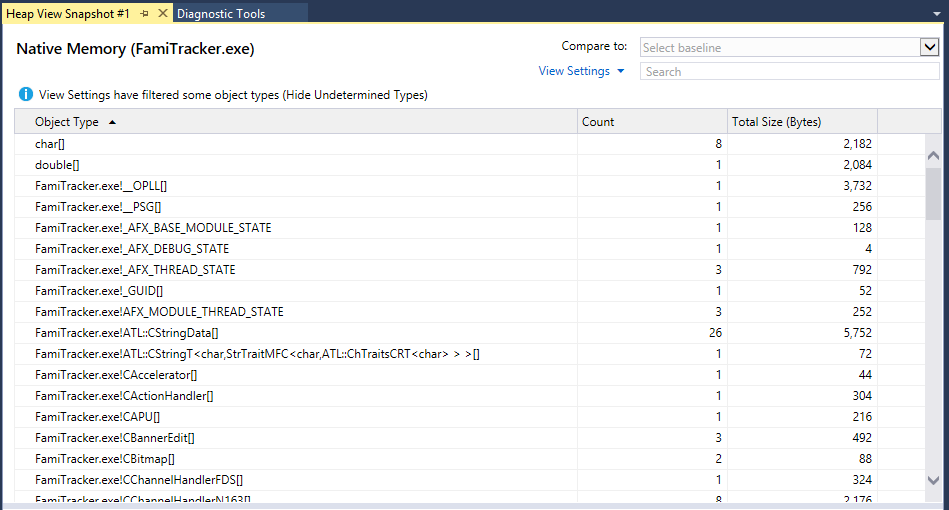
By taking a snapshot at the breakpoint above at the beginning of OnInitDialog(), we can see the heap contents of the app just before the instrument editor dialog starts allocating objects. A snapshot will list the object types, counts, and memory footprint.
Since we are at in a break state, the instance of each type can be viewed by double-clicking a row, or the ![]() icon:
icon:
Selecting a type will present a list of all of the allocations of that type, complete with values and allocation call stacks for each instance. Below are all of the instances of CCHannelHandlerN163[]:
After continuing through some breakpoints, the instrument editor dialog finally pops up and a second snapshot is taken. Upon taking a second snapshot, we can see the total amount of memory consumed during the entire invocation of the instrument dialog, in this case a little over 50 KB.
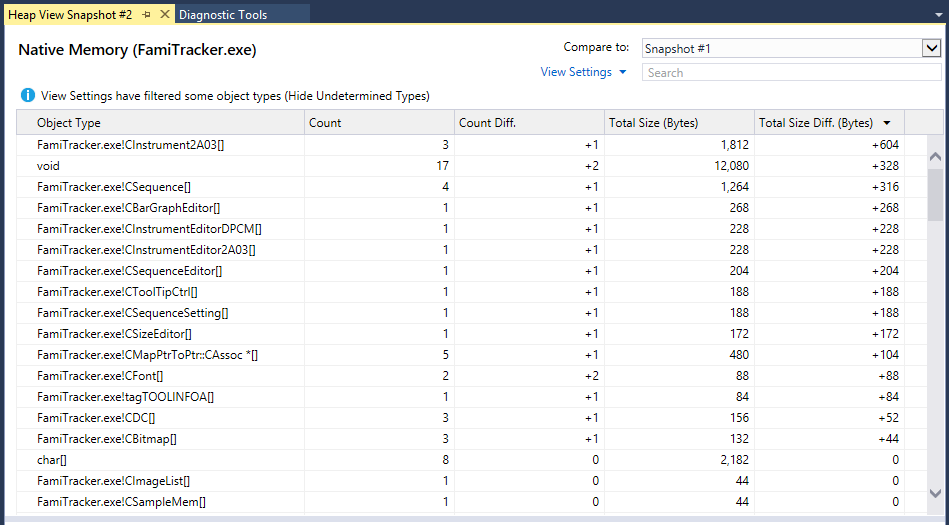
The +51,227 bytes and +405 allocations reveal the total additional memory consumed by launching the instrument editor dialog relative to the baseline snapshot #1, and the top two numbers reveal the total heap contents. Clicking either of these will launch the diff snapshot and list count and type of the additional objects that have exist since the previous snapshot. To see all object in the heap snapshot, simply click one of the two top details in the snapshot that tells the total consumption. Shown below is the second snapshot diffed to the first:
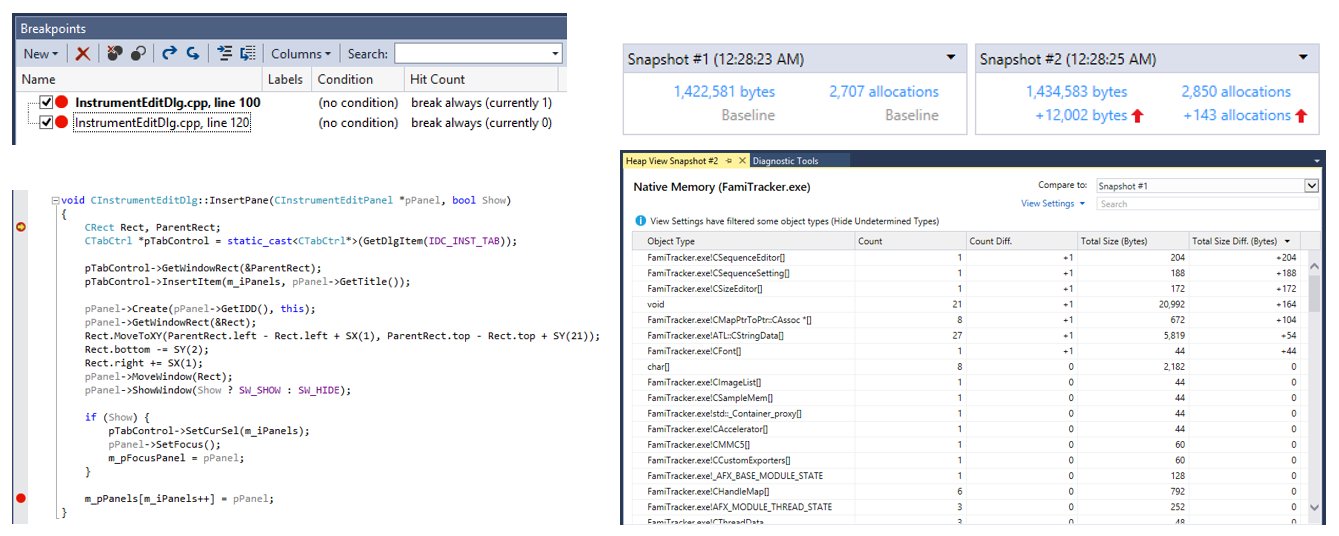
We can even examine the memory overhead more precisely by putting breakpoints at the beginning and the end of a particular function, and taking two snapshots for comparison. The InsertPane function is called twice during the instrument dialog invocation, so it would be nice to see the specific impact it has on the overall execution. Two breakpoints have been set to encapsulate the InsertPane function, and a snapshot is taken at each break. In the snapshot details of the second snapshot below, we are able to clearly see that this function is consuming about 12 KB within its 20 lines of code.
The snapshot diff technique allows any region of your code to be analyzed for memory footprint and provides a powerful tool for exposing memory leaks that may occur between states of execution. Once two snapshots are taken, the latest snapshot will automatically show the diff to the previous one. To diff non-sequential snapshots, simply click the top right corner of a snapshot and select a snapshot to diff against.
This can also be done by clicking the Compare to combo-box at the top right of an opened snapshot select the desired snapshot.
“Hide Undetermined Types” View Setting
Due to the nature of the tool’s type derivation from PDBs, some types cannot be determined due to lack of symbols, or due to the use of custom allocators. We plan to expose the extensibility model for custom allocators in a future blog post. Since it is important to not hinder the workflow for examining user defined types with available symbols, we have chosen to hide these object by default.
These undetermined objects can easily be seen by selecting the View Settings pull-down at the top of the heap view and unchecking the option.
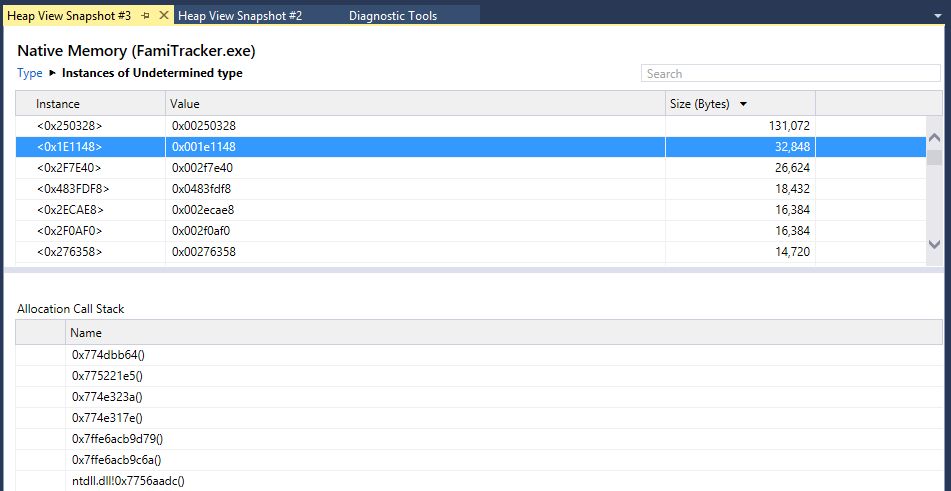
This will list the “Undetermined” type entry in the heap table and in turn will reveal all the instances in memory, complete with the allocation call stack. Below, the object instance at address <0x1E1148> is shown:
In the case that there are not any determined types and the default hide setting is enabled, the heap table will show a watermark with the following string:
Known Issues
As mentioned in Charles’s blog post, the currently supported native application types are Win32, MFC and Windows Store apps. All C++ projects must be built with the new Visual Studio 2015 (v140) compiler to work properly with this tool. The following scenarios are not supported:
- 64-bit targets
- Remote debugging of all project types
- Attach to process
Closing Remarks
This is an early version of this exciting new feature, please share your thoughts and help us make this a valuable and powerful tool for your memory diagnostic needs!
Thanks, Adam Welch Visual C++ Team









0 comments