As part of our continued efforts to make Visual Studio a productive environment for developing mobile applications we’re pleased to announce that Visual Studio 2015 Update 1 RC adds support for debugging your Java source files that are part of your Android projects and (with the help of an extension) get IntelliSense and Browsing assistance for these files in the editor.
This blog post shows you how to get started with the newly added Java support as well as what to expect from the Visual Studio support in Update 1.
Building Java sources
Support for building Java files is already part of the Visual Studio 2015 RTM release. The ANT build system by default picks any .java file under the “src” folder for compilation. If you include these files in the Android project, they also easily participate in Visual Studio’s built-in source control integration.
To get started with Java into your Android project, you can do any of the following:
- Create a new project starting with the Basic Application template (under C++ > Cross-Platform node under New Project Dialog)
- Start from one of the Code Gallery Android C++ samples that ship with Java source code
- Import an Eclipse Android project that already contains Java files (under File > New > Android Projects from Eclipse… menu, after installing the Java support extension)
- Place one or more .java files under your “src” subfolder of your existing project folder and then include it in your project.
Editing Java sources (New in Update 1, Experimental)
When first opening a .java file in the editor, you’ll notice a new breadcrumb notification message that encourages you to install the new Visual Studio extension for Java language support. This notification can be dismissed, but we recommend that you try out this extension and share with us your experience. Note: you need to restart Visual Studio after installing the extension for it to kick into action.
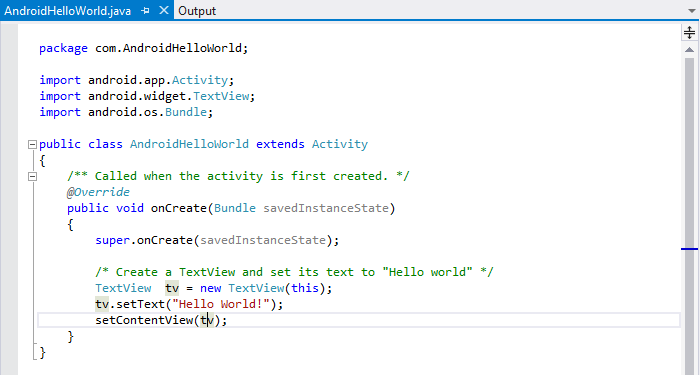
The extension will provide colorization (both syntactic and semantic), error and warning squiggles as well as code outlining and semantic highlighting in your Java files.
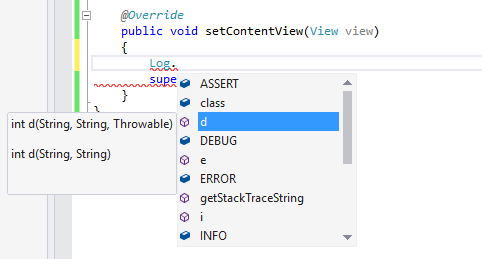
In addition to these, while writing code, you’ll get IntelliSense help:
- Member List will show the possible candidates for import statements, instance members, etc.
- Parameter Help will aid with writing function calls
- Quick Info will appear when hovering your mouse over any symbols
Another handy feature for larger codebases or for navigating 3rd party libraries for which you have the source code available is Go to definition (F12) which will take you to the symbol definition location (if available).
Debugging Java sources (New in Update 1)
To turn on Java debugging for your Android projects in your next debugging session, in the Debug Target toolbar, change Debug Type dropdown to “Java Only” as in the picture below.
To make the choice persist, you can also go to a project’s properties (right click in Solution Explorer and select “Properties”) and in the Debugging tab switch Debugger Type to “Java Only”.
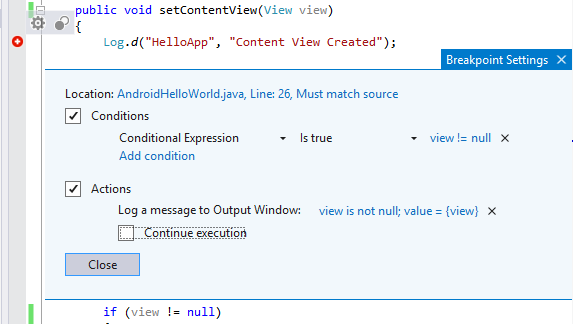
You can now set line breakpoints anywhere in your Java code. Not only that, but you can add conditions or hit counts for the breakpoints to be hit as well as specify breakpoint actions you want to take when the breakpoints are hit, including continuing the execution of the program (i.e. turn the breakpoint into a TracePoint).
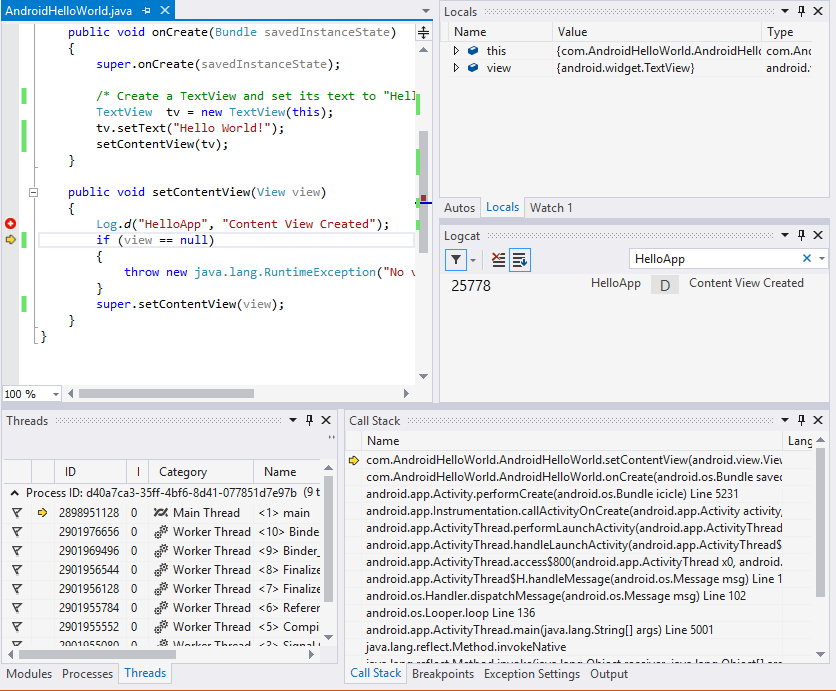
When a breakpoint is hit, you have access to several debug windows providing you insights into the state of your application: Call stack, Watch and Locals windows, and Logcat.
Threads window aids with multi-threaded debugging by displaying the full list of threads including their names and respective call-stacks.
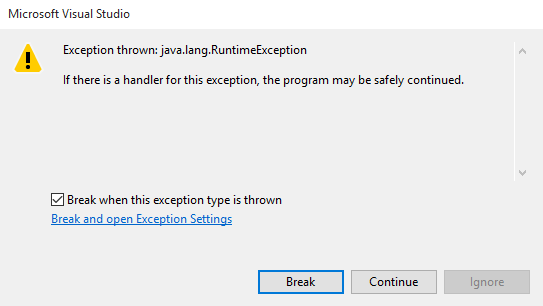
In the Exceptions window, you can configure which first chance exceptions you’d like the debugger to stop on. Once an exception is thrown, execution will stop to the specific location in code with a familiar First Chance Exception dialog giving you the opportunity to inspect the exception.
In addition to the watch window, you can also use the convenient DataTips to quickly view the value of a variable or pin DataTips for specific variables right inside the editor.
This summarizes the current support for Java debugging and language services in Android projects for Visual Studio 2015 Update 1. We look forward to you trying out these new features and sharing your feedback either through Send-A-Smile/Frown (use #cpp2015), Connect, User Voice or down below in the comments.





0 comments