The C++ compiler in Visual Studio 2019 includes several new optimizations and improvements geared towards increasing the performance of games and making game developers more productive by reducing the compilation time of large projects. Although the focus of this blog post is on the game industry, these improvements apply to most C++ applications and C++ developers.
Compilation time improvements
One of the focus points of the C++ toolset team in the VS 2019 release is improving linking time, which in turn allows faster iteration builds and quicker debugging. Two significant changes to the linker help speed up the generation of debug information (PDB files):
- Type pruning in the backend removes type information that is not referenced by any variables and reduces the amount of work the linker must do during type merging.
- Speed up type merging by using a fast hash function to identify identical types.
The table below shows the speedup measured in linking a large, popular AAA game:
|
Debug build configuration |
Linking time (sec) VS 2017 (15.9) | Linking time (sec) VS 2019 (16.0) | Linking time speedup |
| /DEBUG:full |
392.1 |
163.3 |
2.40x |
| /DEBUG:fastlink | 72.3 | 31.2 |
2.32x |
More details and additional benchmarks can be found in this blog post.
Vector (SIMD) expression optimizations
One of the most significant improvements in the code optimizer is handling of vector (SIMD) intrinsics, both from source code and as a result of automated vectorization. In VS 2017 and prior, most vector operations would go through the main optimizer without any special handling, similar to function calls, although they are represented as intrinsics – special functions known to the compiler. Starting with VS 2019, most expressions involving vector intrinsics are optimized just like regular integer/float code using the SSA optimizer.
Both float (eg. _mm_add_ps) and integer (eg. _mm_add_epi32) versions of the intrinsics are supported, targeting the SSE/SSE2 and AVX/AVX2 instruction sets. Some of the performed optimizations, among many others:
- constant folding
- arithmetic simplifications, including reassociation
- handling of cmp, min/max, abs, extract operations
- converting vector to scalar operations if profitable
- patterns for shuffle and pack operations
Other optimizations, such as common sub-expression elimination, can now take advantage of a better understanding of load/store vector operations, which are handled like regular loads/stores. Several ways of initializing a vector register are recognized and the values are used during the expression simplifications (eg. _mm_set_ps, _mm_set_ps1, _mm_setr_ps, _mm_setzero_ps for float values).
Another important addition is the generation of fused multiply-add (FMA) for vector intrinsics when the /arch:AVX2 compiler flag is used – previously it was done only for scalar float code. This allows the CPU to compute the expression a*b + c in fewer cycles, which can be a significant speedup in math-heavy code, as one of the examples below is showing.
The following code exemplifies both the generation of FMA with /arch:AVX2 and the expression optimizations when /fp:fast is used:
__m128 test(float a, float b) {
__m128 va = _mm_set1_ps(a);
__m128 vb = _mm_set1_ps(b);
__m128 vd = _mm_set1_ps(-b);
// Computes (va * vb) + (va * -vb)
return _mm_add_ps(_mm_mul_ps(va, vb),_mm_mul_ps(va, vd));
}
|
No simplifications are done; FMA not generated. |
VS 2017 /arch:AVX2 /fp:fast
vmovaps xmm3, xmm0
vbroadcastss xmm3, xmm0
vxorps xmm0, xmm1, DWORD PTR __xmm@80000000800000008000000080000000
vbroadcastss xmm0, xmm0
vmulps xmm2, xmm0, xmm3
vbroadcastss xmm1, xmm1
vmulps xmm0, xmm1, xmm3
vaddps xmm0, xmm2, xmm0
ret 0 |
| No simplifications done – not legal under /fp:precise; FMA generated. | VS 2019 /arch:AVX2
vmovaps xmm2, xmm0
vbroadcastss xmm2, xmm0
vmovaps xmm0, xmm1
vbroadcastss xmm0, xmm1
vxorps xmm1, xmm1, DWORD PTR __xmm@80000000800000008000000080000000
vbroadcastss xmm1, xmm1
vmulps xmm0, xmm0, xmm2
vfmadd231ps xmm0, xmm1, xmm2
ret 0 |
| Entire expression simplified to “return 0” since /fp:fast allows applying the usual arithmetic rules. | VS 2019 /arch:AVX2 /fp:fast
|
More examples can be found in this older blog post, which discusses the SIMD generation of several compilers – VS 2019 now handles all the cases as expected, and a lot more!
Benchmarking the vector optimizations
For measuring the benefit of the vector optimizations, Xbox ATG (Advanced Technology Group) provided a benchmark based on code from Unreal Engine 4 for commonly used mathematical operations, such as SIMD expressions, vector/matrix transformations and sin/cos/sqrt functions. The tests are a combination of cases where the values are constants and cases where the values are unknown at compile time. This tests the common scenario where the values are not known at compile-time, but also the situation that arises usually after inlining when some values turn out to be constants.
The table below shows the speedup of the tests grouped into four categories, the execution time (milliseconds) being the sum of all tests in the category. The next table shows the improvements for a few individual tests when using unknown, random values – the versions that use constants are folded now as expected.
|
Category |
VS 2017 (ms) | VS 2019 (ms) |
Speedup |
| Math | 482 | 366 | 27.36% |
| Vector | 337 | 238 | 34.43% |
| Matrix | 3168 | 3158 | 0.32% |
| Trigonometry | 3268 | 1882 | 53.83% |
|
Test |
VS 2017 (ms) | VS 2019 (ms) |
Speedup |
|
VectorDot3 |
42 |
39 |
7.4% |
|
MatrixMultiply |
204 |
194 |
5% |
|
VectorCRTSin |
421 |
402 |
4.6% |
|
NormalizeSqrt |
82 |
77 |
7.4% |
| NormalizeInvSqrt |
106 |
97 |
8.8% |
Improvements in Unreal Engine 4 – Infiltrator Demo
To ensure that our efforts benefit actual games and not just micro-benchmarks, we used the Infiltrator Demo as a representative for an AAA game based on Unreal Engine 4.21. Being mostly a cinematic sequence rendered in real-time, with complex graphics, animations and physics, the execution profile is similar to an actual game; at the same time it is a great target for getting the stable, reproducible results needed to investigate performance and measure the impact of compiler improvements.
The main way of measuring a game’s performance is using the frame time. Frame times can be viewed as the inverse of FPS (frames per second), representing the time it takes to prepare one frame to be displayed, lower values being better. The two main threads in Unreal Engine are the gaming thread and rendering thread – this work focuses mostly on the gaming thread performance.
There are four builds being tested, all based on the default Unreal Engine settings, which use unity (jumbo) builds and have /fp:fast /favor:AMD64 enabled. Note that the AVX2 instruction set is being used, except for one build that keeps the default AVX:
- VS 2017 (15.9) with /arch:AVX2
- VS 2019 (16.0) with /arch:AVX2
- VS 2019 (16.0) with /arch:AVX2 and /LTCG, to showcase the benefit of using link time code generation
- VS 2019 (16.0) with /arch:AVX, to showcase the benefit of using AVX2 over AVX
Testing details:
- To capture frame times, a custom ETW provider was integrated into the game to report the values to Xperf running in the background. Each build of the game has one warm-up run, then 10 runs of the entire game with ETW tracing enabled. The final frame time is computed, for each 0.5 second interval, as the average of these 10 runs. The process is automated by a script that starts the game once and after each iteration restarts the level from the beginning. Out of the 210 seconds (3:30m) long demo, the first 170 seconds are captured.
- Test PC configuration:
- AMD Ryzen 2700x CPU (8 cores/16 threads) fixed at 3.4Ghz to eliminate potential noise in the measurements from dynamic frequency scaling
- AMD Radeon RX 470 GPU
- 32 GB DDR4-2400 RAM
- Windows 10 1809
- The game runs at a resolution of 640×480 to reduce the impact the GPU rendering has
Results:
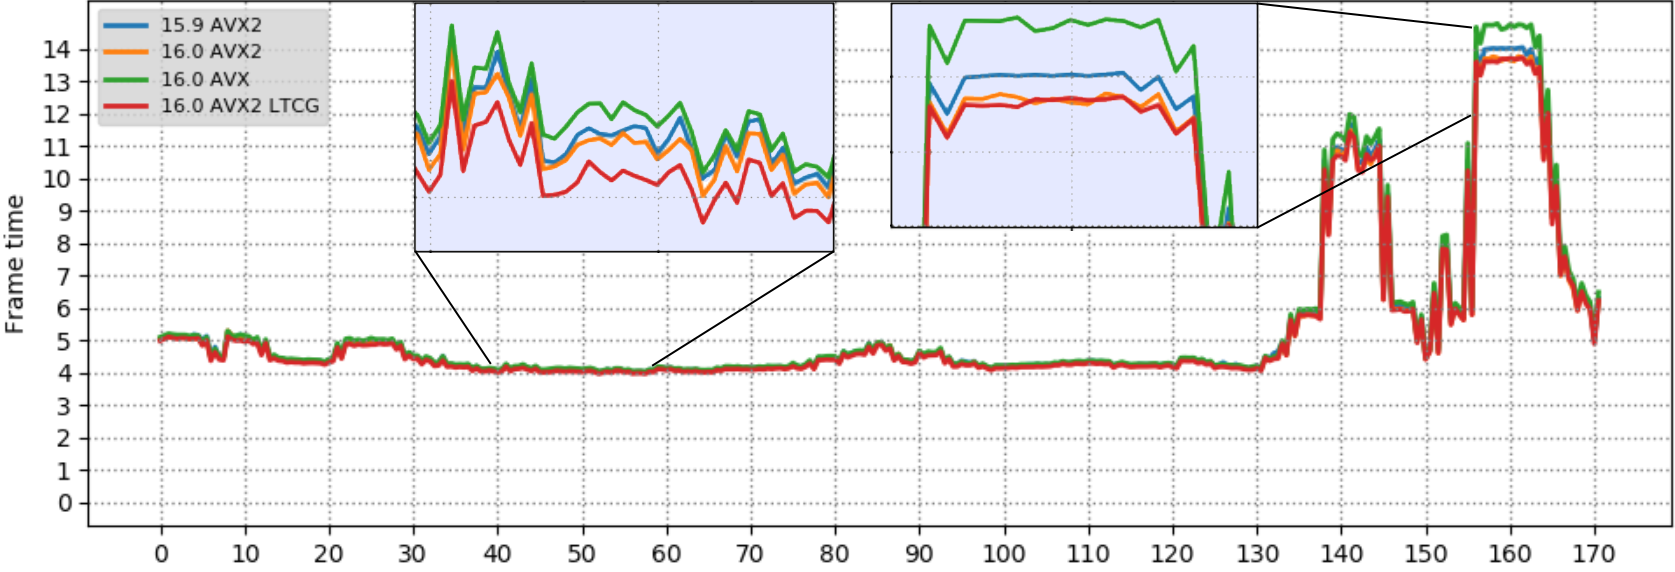
The chart below shows the measured frame times up to second 170 for the four tested builds of the game. Frame time ranges from 4ms to 15ms in the more graphic intensive part around seconds 155-165. To make the difference between builds more obvious, the “fastest” and “slowest” sections are zoomed in. As mentioned before, a lower frame time value is better.

The following table summarizes the results, both as an average over the entire game and by focusing on the “slow” section, where the largest improvement can be seen:
|
Improvement |
VS 2019 AVX2 vs. VS 2017 AVX2 | VS 2019 LTCG AVX2 vs. VS 2019 AVX2 | VS 2019 AVX vs. VS 2019 AVX2 |
|
Average |
0.7% |
0.9% |
-1.8% |
| Largest | 2.8% | 3.2% |
-8.5% |
- VS 2019 improves frame time up to 2.8% over VS 2017
- An LTCG build improves frame time up to 3.2% compared to the default unity build
- Using AVX2 over AVX shows a significant frame time improvement, up to 8.5%, in large part a result of the compiler automatically generating FMA instructions for scalar, and now in 16.0, vector operations.
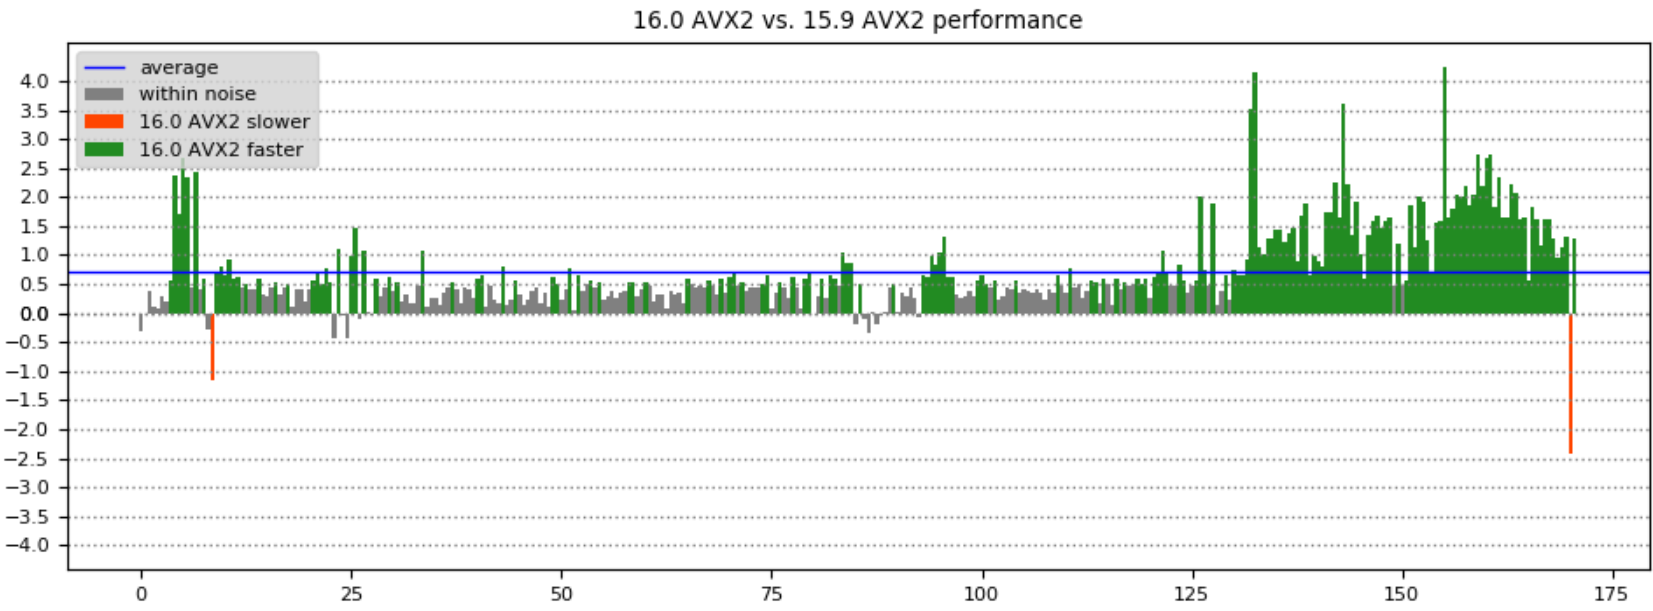
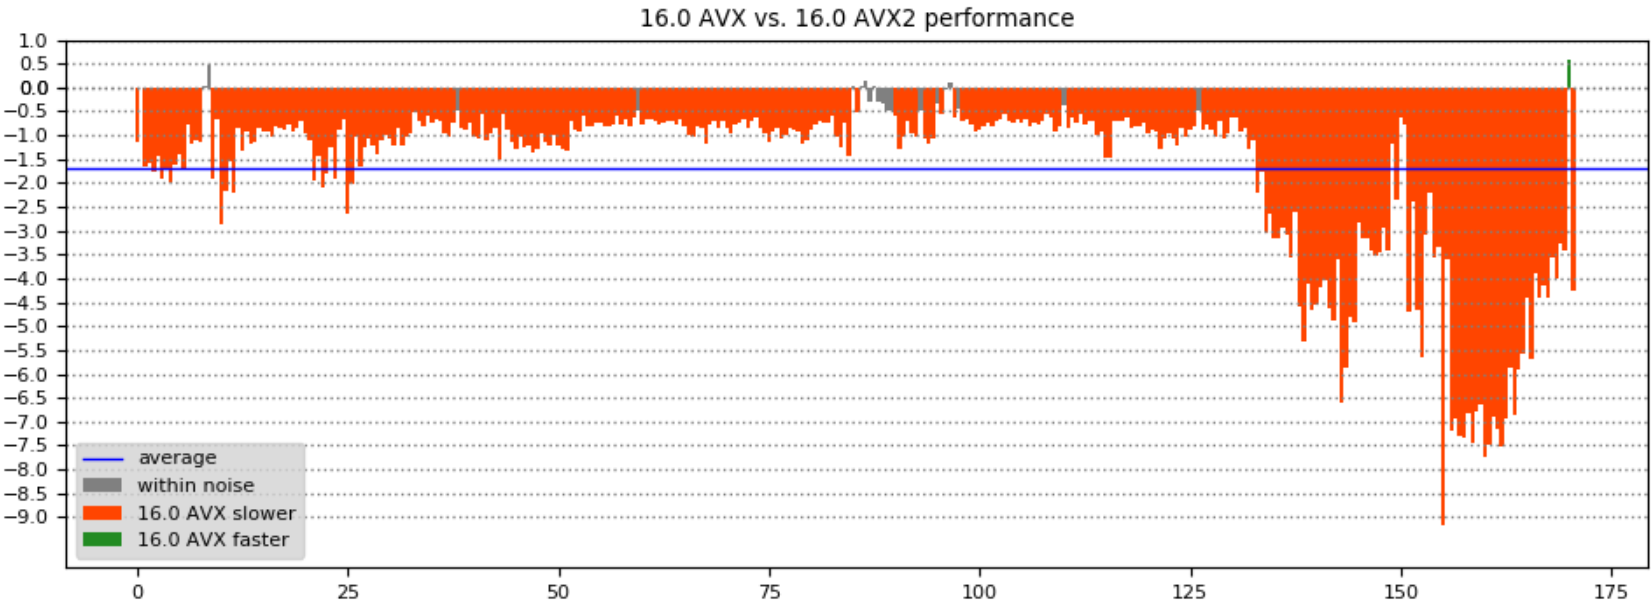
The performance in different parts of the game can be seen easier by computing the speedup of one build relative to another, as a percentage. The following charts show the results when comparing the frame times for the 16.0/15.9 and AVX/AVX2 builds – the X axis is the time in the game, Y axis is the frame time improvement percentage: 

More optimizations
Besides the vector instruction optimizations, VS 2019 has several new optimizations that help both games and C++ programs in general:
- Useless struct/class copies are being removed in several more cases, including copies to output parameters and functions returning an object. This optimization is especially effective in C++ programs that pass objects by value.
- Added a more powerful analysis for extracting information about variables from control flow (if/else/switch statements), used to remove branches that can be proven to be always true or false and to improve the variable range estimation.
- Unrolled, constant-length memsets will now use 16-byte store instructions (or 32 byte for /arch:AVX).
- Several new scalar FMA patterns are identified with /arch:AVX2. These include the following common expressions: (x + 1.0) * y; (x – 1.0) * y; (1.0 – x) * y; (-1.0 – x) * y.
- A more comprehensive list of backend improvements can be found in this blog post.
We’d love for you to download Visual Studio 2019 and give it a try. As always, we welcome your feedback. We can be reached via the comments below or via email (visualcpp@microsoft.com). If you encounter problems with Visual Studio or MSVC, or have a suggestion for us, please let us know through Help > Send Feedback > Report A Problem / Provide a Suggestion in the product, or via Developer Community. You can also find us on Twitter (@VisualC) and Facebook (msftvisualcpp).

I'm currently developing a checksum algorithm which relies heavily on performance of Vectorial Instructions. The main 2 targets are SSE2 and AVX2. There is also a "normal" scalar code path. Best case, it would have been great if the scalar code was automatically auto-vectorized, but I've given up on that goal, and provide explicit vector instructions, using Intel's intrinsics. Unfortunately, on this code, Visual performance is not on par with `clang` nor `gcc`. Performance is compared on same hardware, using different OS, environments and compilers. Visual is especially behind on short inputs, suggesting there is some significant time spent into...
Are you aware that fma instructions don't produce bit-identical results as separate multiply then add instructions? I was unaware that this was already being used for scalar code, but this seems like it will introduce a lot of hard to debug instability in code compiled with /fp:precise.
How can a user disable this optimization? Would using /fp:strict and /fp:except- produce the same code as /fp:precise just without implicit fma insertion?
Pedantic note: implicit insertion of fma seems to violate /fp:precise guarantee of "rouding at function calls". I realize that intrinsics are not "function calls", but the look like it in...
Contractions, including FMA, are allowed under /fp:precise, it is documented here:
https://docs.microsoft.com/en-us/cpp/build/reference/fp-specify-floating-point-behavior?view=vs-2017
You can use a #pragma, fp_contract, to disabe contractions per-function. There isn’t anything now to do it for an entire project.
https://docs.microsoft.com/en-us/cpp/preprocessor/fp-contract?view=vs-2017
Actually, it would be really useful to have something similar to gcc’s -ffp-contract argument. Perhaps:/fp:contract (force enable FP contractions, even with /fp:strict)/fp:contract- (force disable FP contractions)
I’m in the same boat as @Accel229 and @Ben Monroe with regards to fastlink: not going there again. Initial enable was a disaster. Had to wait 15+ seconds after bkpt was hit for VS to sort things out. Not supported for C++/CLI.
As for the link time improvements, any kind of speedup is welcome, but it would be nice to finally see some improvements in the front-end. Link times can be mitigated with an SSD, and as far as compilation goes, most projects are front-end bound, anyway. Can we expect something in this area in the future?I know, I know, smart usage of PCHs, and modules in C++20…
Do the SIMD optimizations apply also to NEON intrinsics on ARM/ARM64?
It mostly works on ARM64, there were a few issues when doing more extensive tests that need more time to fix, then it will be enabled. There are no plans to support this on ARM (32 bit).
Improving linking times sounds great. We are not using /fastlink either (and are not going to), but improvements for normal linking are very welcome. Thanks.
Improved linking times is always welcome, but I had a terrible experience with fastlink and am quite hesistant to repeat the process. It's been a few years so I am recalling from imperfect memory, but after upgrading a project to VC++ 2017, I had significant debuggability issues caused by fastlink. I do not remember the exact details anymore, but debugging (WinDbg) would not load symbols generated via fastlink. (Unsure about VS 2017 debugging; I often need to debug environments without VS installed.) To make matters worse, in VS 2017, even if you explicitedly disable fastlink from the UI it is...
One issue we hit is that we had old versions of dbghelp.dll floating about that would hang on fastlink. Overwriting those with a newer dbghelp.dll we found in the visual studio installation fixed the hangs. Probably not the issue with windbg since it’s unlikely that is uses dbghelp, but perhaps?
Otherwise our team has not hit any issues with fastlink (we don’t use windbg though).
Just to touch back (sorry for the slow reply). We've had the issue about the UI come up before - https://developercommunity.visualstudio.com/content/problem/362593/incorrect-error-about-debugfastlink.html - I'd encourage you post this issue again so that we can revisit it. The same thing goes for the WinDbg feature - put it into developer community as a suggestion.
Stepping back here, as the post indicates we're continuing to push on build throughput - in the linker and otherwise - so there we're open to taking a fresh look at things given feedback. I hear you on the fastlink experience - we're making a concerted effort to...