
In Visual Studio 2019 version 16.8 Preview 3 we added the ability to debug Linux core dumps on the Windows Subsystem for Linux (WSL) or a remote Linux system directly from Visual Studio. This support is specific to the “Native Only” debugger type for unmanaged C++ code.
We understand that some teams develop on Windows but deploy to both Windows and Linux (or just Linux!) and rely on a CI system to catch Linux-specific errors. This feature will make your life easier if you run a Windows shop but deploy to Linux servers and want to debug crashes in a familiar environment.
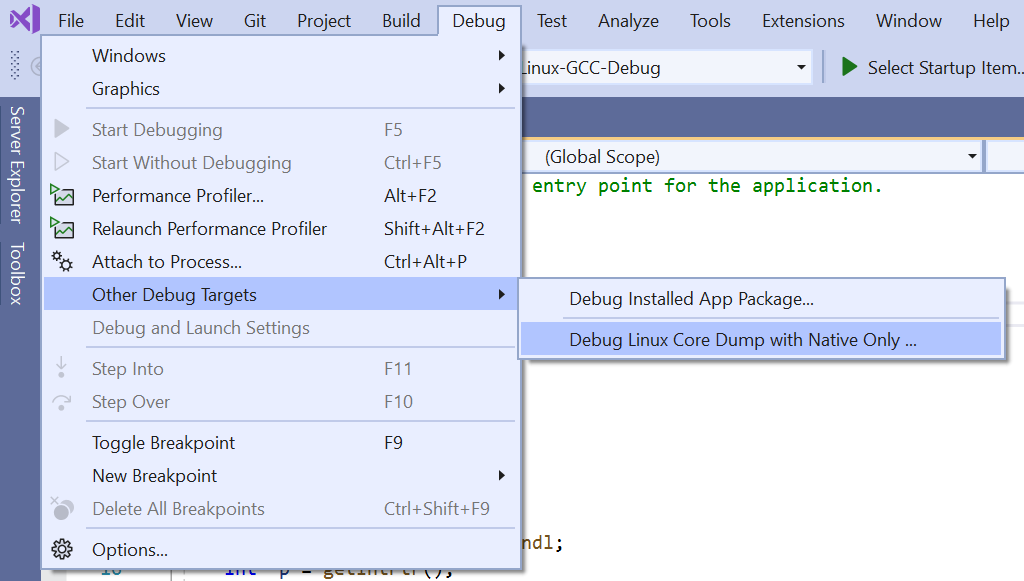
To get started, select Debug > Other Debug Targets > Debug Linux Core Dump with Native Only… from the main menu. This option is available in all contexts if you have the Linux development with C++ workload installed.
The following dialog will open to configure your debugging session.
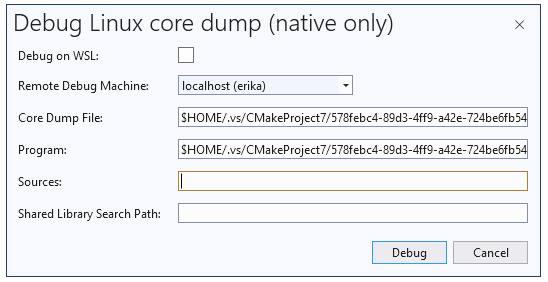
You can debug on WSL or a remote system. GDB must be installed on your target system.
Debug on WSL: If checked, Visual Studio will search for the core file and launch the debugging session on your default WSL distribution. This option leverages our native support for WSL and does not require an SSH connection.
Remote Debug Machine: If “Debug on WSL” is unchecked, then Visual Studio will search for the core file and launch the debugging session on the remote system specified here. The drop-down is populated with your established SSH connections. You can add a new remote connection via Tools > Options > Cross Platform > Connection Manager.
Core Dump File: This field is required and specifies the path to the Linux core file on the target system.
Program: This field is required and specifies the path to the binary that produced the core file on the target system. If you are debugging on WSL and your core file and binary are located on the Windows file system, then you can access them from WSL via your local drives mounted under the /mnt folder (e.g. /mnt/c/Users…).
Sources: An optional list of source mappings mapping the Windows path to the root folder containing the sources that produced the binary to the Linux path to the same directory structure on the target system. This field is often necessary for source level debugging. Format: <Linux path>=<Windows path>. A semi-color separator can be used to provide multiple entries.
Shared Library Search Path: An optional search path for additional debug symbols (translates to the solib-search-path GDB command).
You do not need to have a CMake project with a Linux configuration or MSBuild-based Linux project open in Visual Studio to leverage this support. However, if you do have a Linux project open then Visual Studio will automatically populate the “Program” field with the binary produced by Visual Studio. If you have more than one target, then Visual Studio will populate the “Program” field with the first target that it can find.
Give us your feedback
Download Visual Studio 2019 version 16.8 Preview 3 today and give it a try. We’d love to hear from you to help us prioritize and build the right features for you. We can be reached via the comments below, Developer Community, and Twitter (@VisualC). The best way to file a bug or suggest a feature is via Developer Community.
Hi pleasant and appreciate the details. https://www.mycardetailchicago.com/
Waiting for managed debug
https://devblogs.microsoft.com/visualstudio/linux-managed-memory-dump-debugging/