As announced in an earlier blog post, Visual Studio 2015 hosts a new set of memory profiling tools to help address and fix memory issues within your applications. The new debug-time profiler runs during your debugging session and allows you to take snapshots anytime, such as at a breakpoint, and also view the heap contents during the current debugger break state. This provides for a more precise and flexible experience when trying to analyze the heap state of your app.
Getting Started
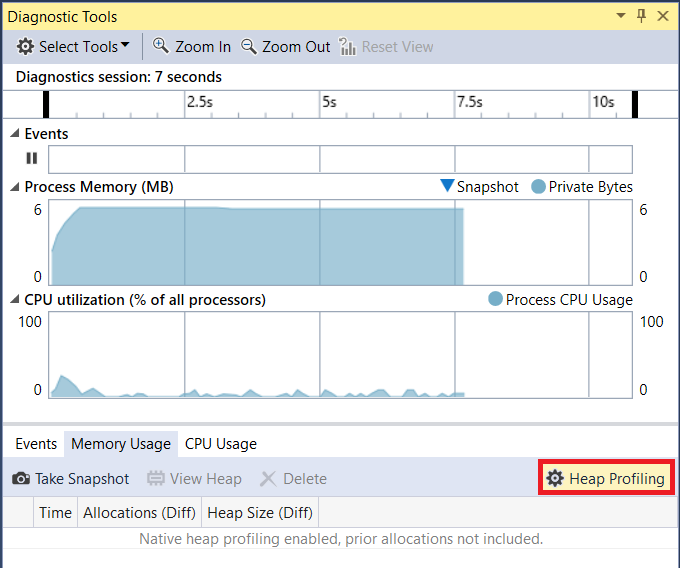
Upon firing up the debugger for the first time in VS2015, you are presented with the new Diagnostics Tools window which allows you see the debugger events, the memory usage, and the CPU usage of your running app. You can use memory usage graph to monitor your overall memory consumption while debugging, and when you want more information you can turn on heap profiling and take snapshots to get a detailed breakdown of allocations.
Allocation Tracking and Overhead
The memory profiler works by collecting allocation event data during application runtime and maps this to type information inside your PDBs. Due to a technical dependency on the VS2015 (v140) compiler, type information will only be displayed for targets built using this compiler version or later. Collecting memory allocation event data has inherent overhead during debugging an application, and for this reason snapshot capability is disabled by default. To activate heap snapshots, open the Memory Usage tab of the Diagnostic Tools windows and click the Heap Profiling button so that the icon turns yellow. As of the VS2015 Update 1 CTP preview, heap profiling can be enabled without restarting the debugger. Allocations that occurred before enabling snapshot will not be tracked, so to ensure you have a proper baseline you can restart the debugger after enabling heap profiling or press F11 during design time to start debugging and break on the first instruction. Note that if you disable heap snapshots the setting will take effect upon termination of the existing debug session.
Taking Snapshots
Once snapshots are enabled, snapshots are taken with the “Take Snapshot” button and will show up in the snapshot table. Each snapshot listed the execution time when it was taken, the total number of allocations, and the heap size in kilobytes. You can open a complete view of the heap snapshot is done by clicking the total count link on the left of each column for either allocation count or heap size. Snapshot diffs can be viewed by selecting the +/- links on the right of each column and the snapshot will open and be sorted based upon this value.
Inspecting the Heap
Types View
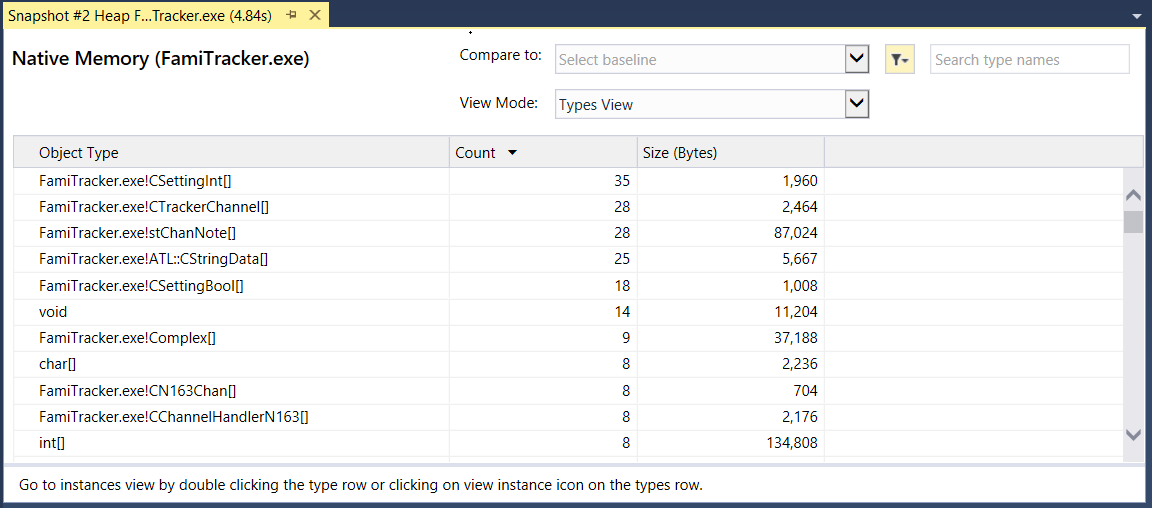
Once you open a snapshot, the initial view is of all of the types are listed for the objects contained in the memory. The total number and memory footprint of each data type is listed in descending order by default. You can sort the object types by name, count, or size by clicking the top cell of the corresponding column. Undetermined types are hidden by default from the types view, but can easily be viewed by selecting the filter icon to the left of the search box and unchecking “Hide Undetermined Types”.
Instances View
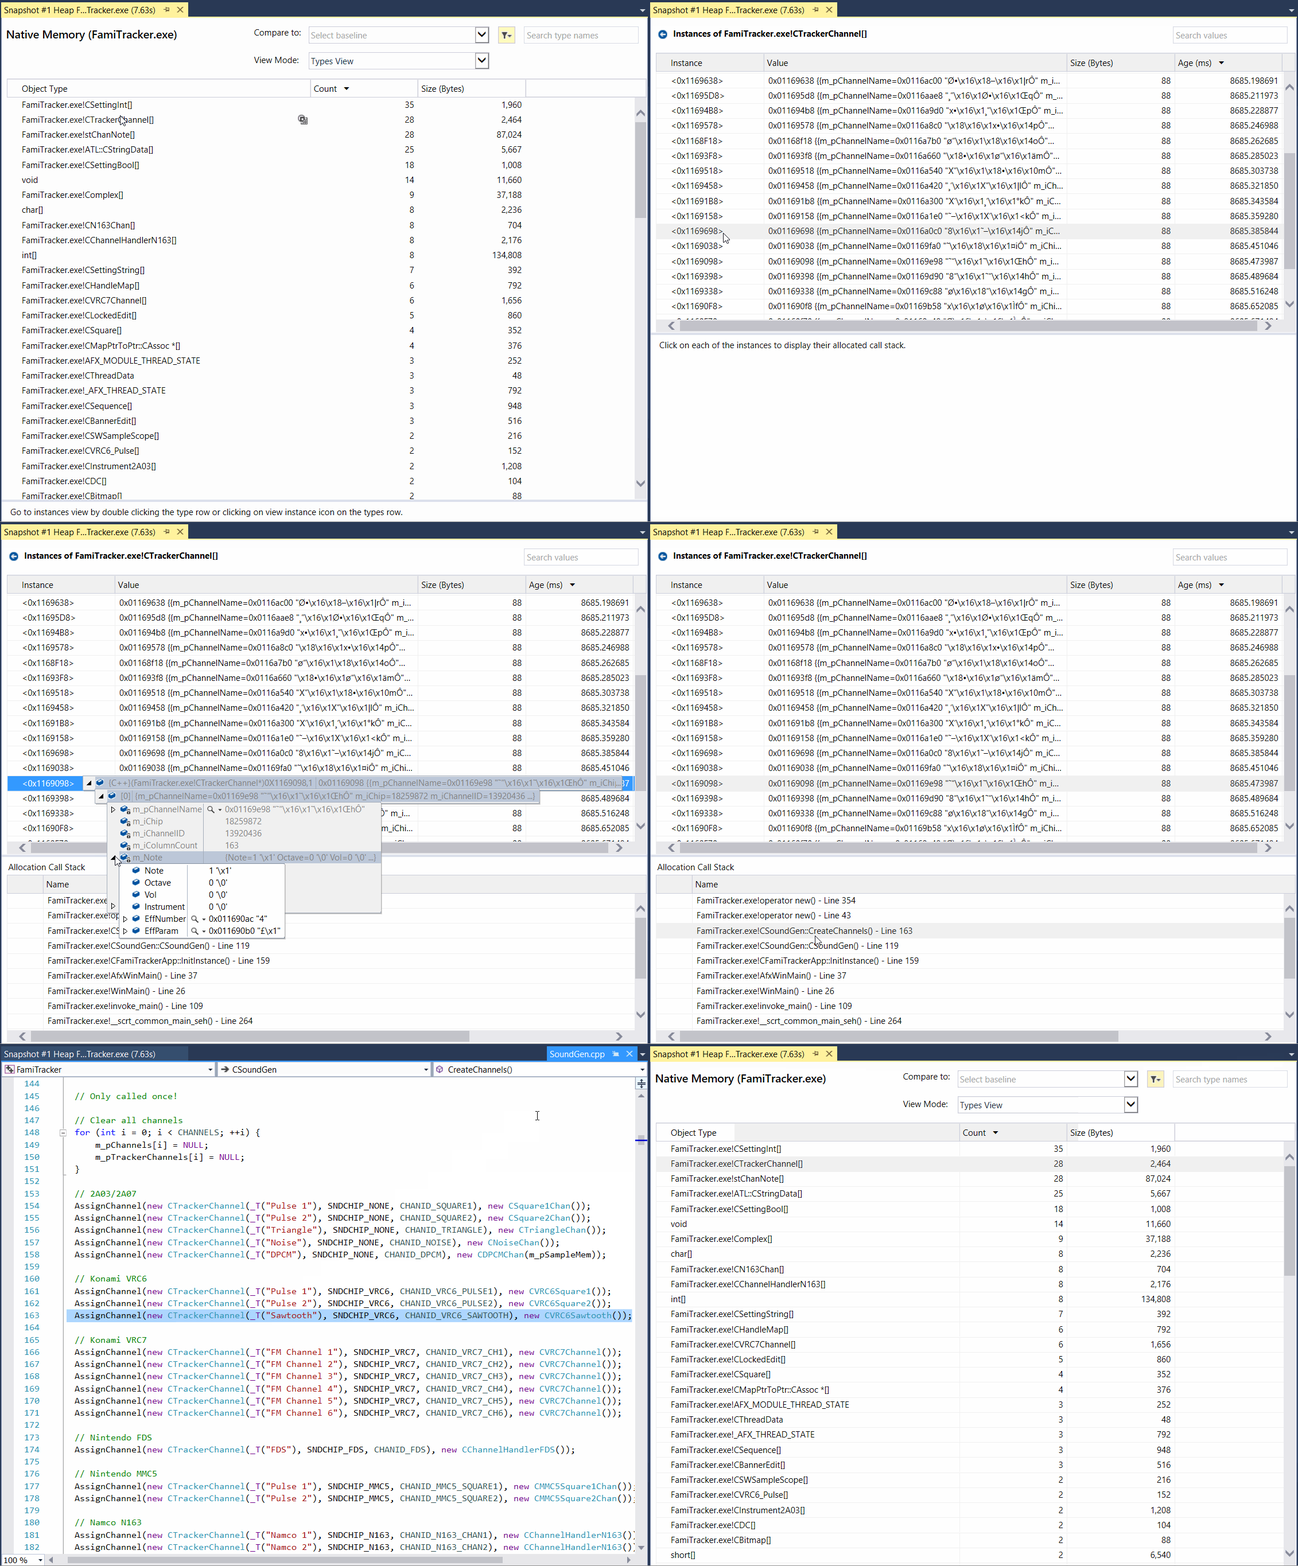
Double-clicking or right-clicking a row and selecting “View instances” on a type allows you to navigate to the instances of that type and view the individual objects and their complete allocation call stacks. Select a line of the call stack and it will take link to the source code via . You can activate debugger data tips to conveniently view object contents by hovering over an instance row, as seen below on the CTrackerChannel instance:
Stacks View
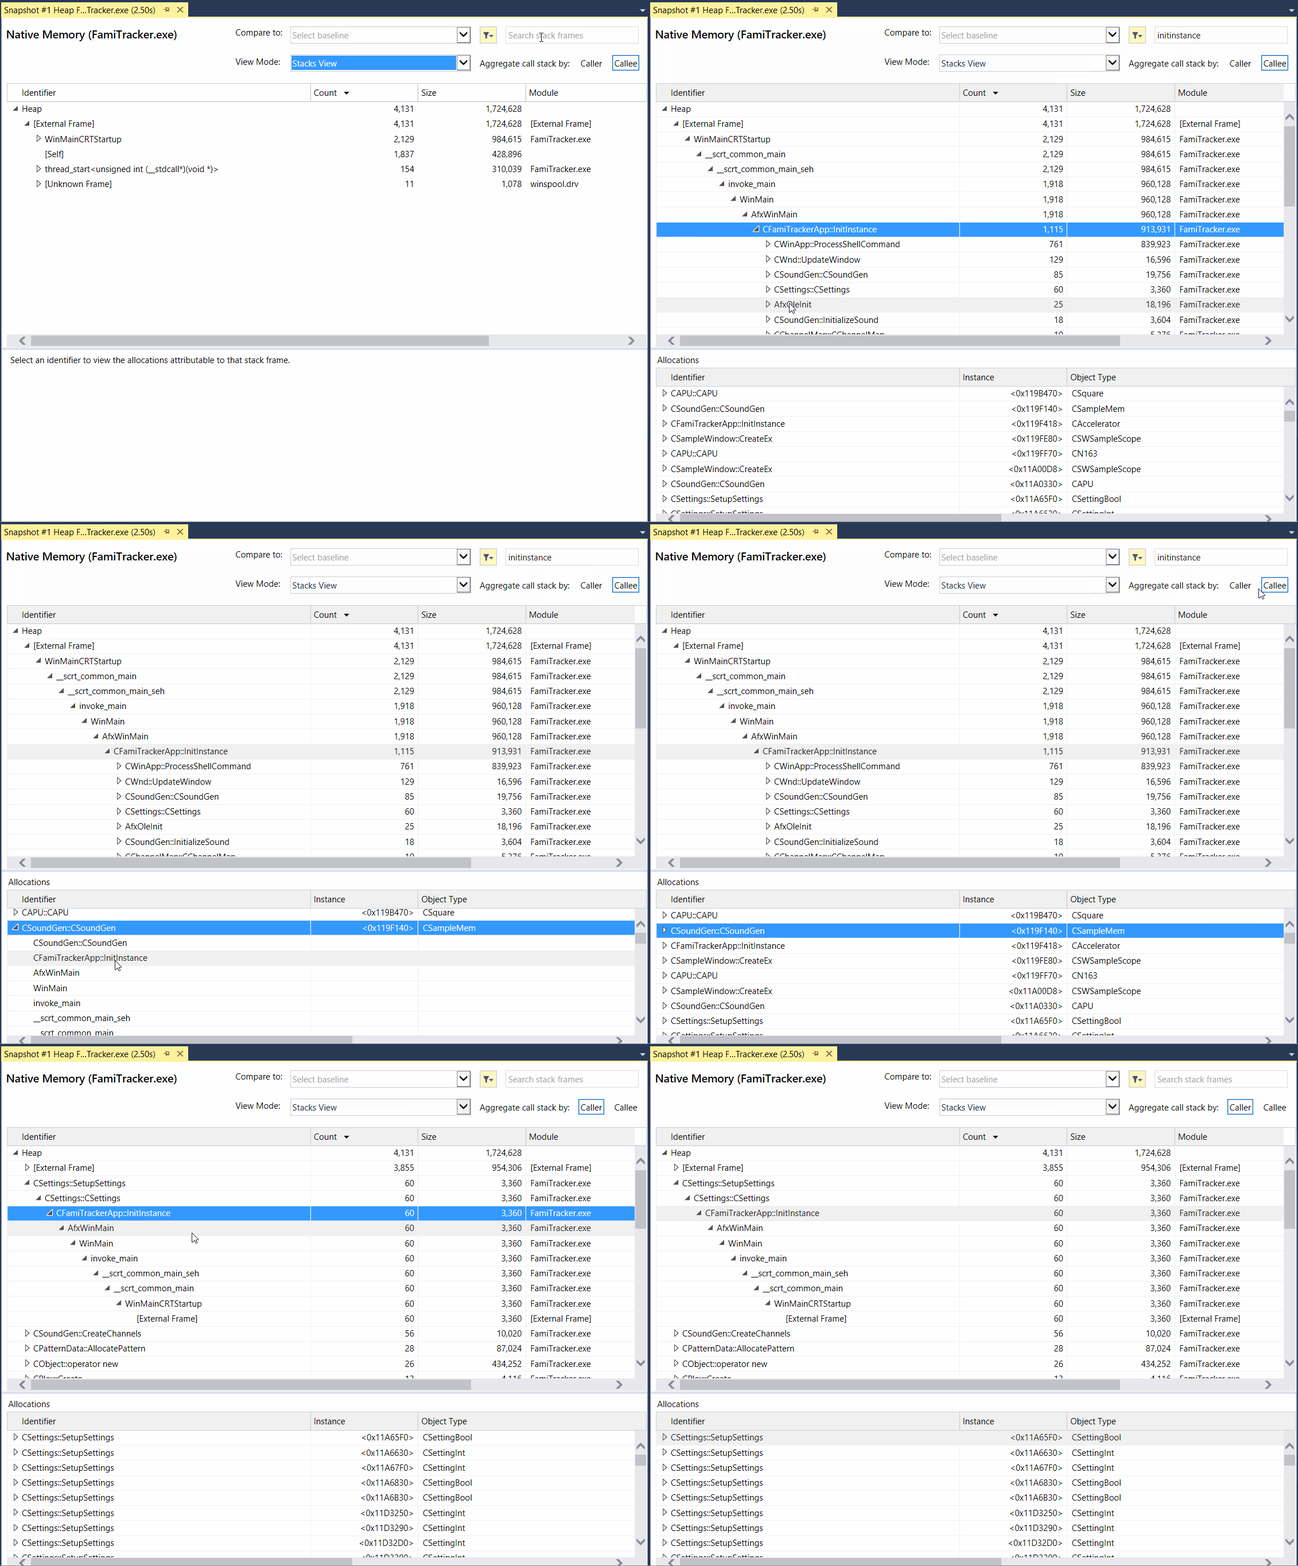
View the call tree by stack frame simply by selecting the “Stacks” option in the View selector on the types page. You can aggregate the stack frames by caller or callee by selecting the button on the top right of the window. All allocations attributable specifically to the current function are labeled with the [Self] tag. You can search the calls stacks using the search box in the top right to easily navigate to a given frame:
Select a stack frame from the call tree to see a list of all the allocations (and their types) attributable to that stack frame appears in the lower panel of the window. Expanding the allocation will list its allocation call stack below.
Custom Allocator Support
Windows ships with an ETW provider that emits events tracking allocations and de-allocations on the Windows heap. The provider can be configured to include a stack trace with each event. The __declspec(allocator) tag allows the compiler to determine that a function call is a call to an allocator, that is, a function returning new heap-allocated memory. At each call to an allocator function, the address of the call site, the size of the call instruction, and the typeid of the new object are emitted into a new S_HEAPALLOCSITE symbol inside the PDB. When the Windows heap code emits an ETW event with a call stack for an allocation, the memory tool walks the call stack looking for a return address matching an S_HEAPALLOCSITE symbol. The typeid in the symbol determines the runtime type of the allocation.
Allocators in the CRT (new, malloc, …) and Windows SDK have been annotated at the source level so that their allocation data can be captured and mapped to the corresponding symbols. Any code that wants to support displaying type information for allocations during heap profiling will need to be built with the v140 compiler (or later). To improve the accuracy of the memory profiler, make sure that any functions that return a pointer to newly allocated heap memory can be decorated with __declspec(allocator), as seen in this example for myMalloc(size_t size):
__declspec(allocator) void* myMalloc(size_t size);
New Features in VS2015 Update 1 CTP
Support for “Attach to Process” Profiling
The Visual Studio 2015 Update 1 CTP release now supports the ability to attach to a running process and enable native heap profiling for that process. If you suspect a memory leak is caused late in execution, you can avoid the performance penalty of allocation tracking until you have reached the problem state of the program you are debugging. The process for enabling heap profiling on a running process is the same as above. Once profiling is enabled, this setting will persist across debug sessions for the target process.
Support for Remote Profiling
The CTP release of Visual Studio also supports the ability to profile an application while remote debugging, and even attach to and profile a remote process. This allows you to monitor the memory usage on devices beyond your development environment and take heap snapshots just like with local debugging sessions.


0 comments