
We had a nasty enough service incident on Friday that I can’t let it pass without commenting on it. If you follow my blog or the service, then you know we were doing a deployment on Friday. The natural assumption, both inside and outside Microsoft, was that it was caused by the deployment. It wasn’t, but more on that in a minute.
We received notable Twitter traffic, blog comments and emails both about this incident and the pattern of incidents. I’m going to tackle both topics (at least lightly) here. First, people are justified to be upset about Friday’s incident. The service was mostly down for about 3 hours. That’s clearly not acceptable. There was also a pattern of “the service has incidents too often”. I agree. We know it and we are constantly working on making it better. And, actually, it is getting consistently better. It’s not good enough but here is a trend of significant incidents over the past several months.

We’ve got a lot of work to do but we’re making progress. Not only are incidents generally getting less frequent, they are getting less severe (though Friday’s was pretty severe). Incidents as bad as Friday’s are actually reasonably rare.
A few of the comments I got about the service availability referenced our service status blog as evidence that incidents happen almost every day. Well, kind of. It’s true that some incident happens almost every day. However, the majority of incidents turn out to be very minor – with little or no customer impact. For now we have chosen to err on the side of notifying of potential issues before clarifying the impact. My guidance to the team is “If a customer is seeing a problem, they shouldn’t go to the service status page and have it tell them everything is fine – that’s a very frustrating experience”. However, it causes us to be very chatty. Our plan it to improve our service health status reporting so customers can better understand whether incidents likely affect them – but that’s months away.
None of that takes away from the fact that we want and need to have fewer impactful events.
Availability and service quality has been on my mind a lot lately as the service continues to mature and that’s why I wrote a post on the topic a few weeks ago. As we analyzed various availability models, we took 6 months or so of historical data and tested the models against it. What we found is that dips in availability correlate very strongly with our deployment weeks – in other words, when we change things, stuff breaks. It proved the old operations maxim behind the rule “the best way to run a highly available service is to never change it”. True but misses the point.
So, it’s not surprising that people would assume the outage we had on Friday was the result of our deployment. To be honest, I did too. However, Monday we did a deep dive on the root cause and it was enlightening.
There were actually two distinct (and as best we can tell, unrelated) issues that happened on Friday. The first was a cache overflow and the second was a synchronization task that bogged down the system.
Cache overflow – we keep a cache of group membership resolution so that we don’t have to go back to the database to check people’s group membership every time we need it. The cache had 1,024 entries in it and a bad eviction policy. The load got high enough (we hit a new usage record on Friday) that the cache overflowed and began to thrash. The next problem was that the cache fault algorithm held a lock on the cache while it fetched the data from the database – never, ever, ever do that. That caused the thrashing cache to queue faults and the system backed up to the point that no one could log in any longer. We took away several action items: 1) increase the cache size 2) fetch the data outside the lock 3) switch to an LRU eviction policy and 4) add a new feature to our lock manager and data access layer so that when the right configuration setting is set, we throw an exception anytime a SQL call is made while a lock is held.
Sync job – We have a synchronization job that updates work item tracking with relevant list of users (for instance candidates to assign a work item to). We have to sync any relevant changes to a user (like display name changes). The trigger for the problem was two fold – an increase in the number of changes to identities and an increase in the total number of identities in the system. The root cause was a couple of bad design decisions. The first was the fact that any identity change triggers the identity to be a candidate for synchronization – even if work item tracking doesn’t use the property that changed. So we need a filter to only deal with synchronization when a relevant property is changed. The more serious issue though was the “directionality” of the algorithm. What it did was query all changed identities in the system and “join” that to the list of relevant identities in an account. The problem is, that particularly on the public service, the number of change identities dwarfs, by orders of magnitude, the number of relevant identities in any given account. The result is hundreds of times more processing by, effectively, using the wrong index. The quick mitigation was to reverse the join and sync job times dropped from, sometimes, minutes to milliseconds.
Neither of these things changed in the deployment. It was just a coincidence that the thresholds that triggered the issues happened on Friday. So my question was, if these things were a result of increased load/data volume, then that didn’t change overnight. What were the symptoms that we should have been able to detect ahead of time? The problem with these kind of things is that failures like this happen gradually and then all at once. It gets a little worse and a little worse and then the *** hits the fan.
We generally have a “hygiene” process that involves tracking exceptions, event log entries, response times, available memory, etc. The goal is to detect the early signs of a problem and address it before it passes the knee curve. The problem is that some of these measures are particularly noisy and too easy to convince yourself that you are just seeing noise. Clearly we have some work to do to change our assessment practice here.
To help visualize this, here is a graph of the average times for the group membership resolution times. As you can see, it was regularly spiking at close to 10 seconds (the units of the y-axis are microseconds). In retrospect everyone knows that’s not expected. Typical times should be in milliseconds.
On Friday, the averages spiked to about 30 seconds and was enough to start triggering ti meouts, etc. Not good. Should have seen this before Friday and never let it happen.
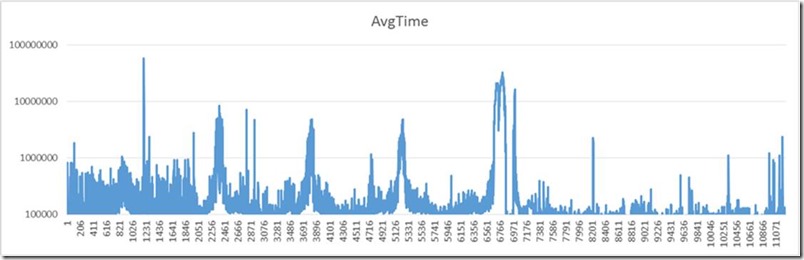
As a brief aside, I’m breaking one of my golden rules here. Never use average data. Use percentiles. Averages hide “the truth”. Lots of “good” values can hide fewer VERY bad values. Look at 50th percentile or 75th ot 90th, etc. Don’t look at averages. It turns out averages are easy to compute so, in a rush, it sufficed to demonstrate the problem here but it’s never what I would use in a formal analysis.
Anyway, I’m sorry for the incident on Friday. There were plenty of learnings. The biggest one I want to share is that you have to listen to your service. Very often it will “silently” get gradually degrade and then it will catastrophically fail. You have to catch it before the cliff.
Brian
0 comments
Be the first to start the discussion.