
This is the second in a ten-part blog series where we’ll demonstrate principles of the Cybersecurity Maturity Model Certification (CMMC) aligned with Microsoft Azure. Subsequent blogs in the series will delve into asset & configuration management, identification & authentication, incident response, maintenance & media protection, recovery & risk management, security assessment & risk management, system & communications protection and system & information integrity. In this second blog of the series we will explore how to leverage Microsoft Azure for audit & accountability management.
Please note that the information cutoff date for this post is October 2020 and that as of the date of this writing, CMMC developments and guidance are in progress. Additionally, as of the date of this writing, the CMMC Accreditation Body (CMMC AB) has not identified nor certified any third-party assessors, nor issued prescriptive guidance on the formal assessment process and criteria. As a result, the information herein, including our CMMC related offerings, may be enhanced to align with future guidance from the DoD and CMMC AB. Microsoft is closely tracking developments related to the CMMC.
Stay tuned for the published and upcoming CMMC blogs in the series:
- Access Control Maturity – live
- Audit & Accountability Maturity – this blog
- Asset & Configuration Management Maturity – live
- Identification & Authentication Maturity – live
- Incident Response Maturity – live
- Maintenance & Media Protection Maturity – live
- Recovery & Risk Management Maturity – live
- Security Assessment & Situational Awareness Maturity – live
- System & Communications Protection Maturity – live
- System & Information Integrity Maturity (5/28)
What is Cybersecurity Maturity Model Certification (CMMC)?
The Defense Industrial Base (DIB) is charged with implementing Defense Federal Acquisition Regulation Supplement (DFARS) 252.204-7012. DFARS requires organizations supporting the Department of Defense (DoD) to implement NIST SP 800-171 and FedRAMP Moderate Impact level controls. DoD has mandated CMMC with periodic assessments in order to strengthen cybersecurity across the DIB. CMMC builds upon DFARS 7012 by verifying an organization’s readiness to protect Federal Contract Information (FCI) and Controlled Unclassified Information (CUI) such as International Traffic in Arms Regulation (ITAR) and Export Administration Regulations (EAR) export-controlled data.
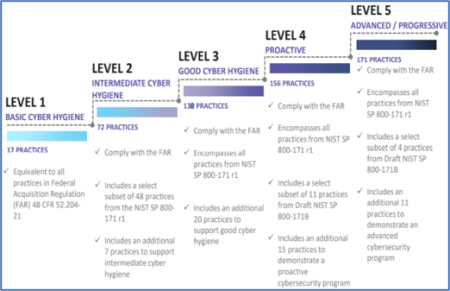
CMMC extends beyond the parent organization into sub-contractors, partners, and suppliers. The framework is intended to enforce critical thinking approaches for comprehensive security. The CMMC framework specifies 5 levels of maturity measurement from Maturity Level 1 (Basic Cyber Hygiene) to Maturity Level 5 (Proactive & Advanced Cyber Practice). The Certification levels will be determined through audits from independent, third-party assessment organizations (C3PAO).
What preparation is required for CMMC alignment to audit & accountability management?
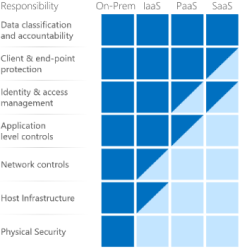
It’s important to understand that compliance is a shared responsibility between the customer and the Cloud Services Provider (CSP). The graphic on the left demonstrates the CSP responsibility in respective cloud models (On-Prem, IaaS, PaaS, SaaS) with dark blue aligning with customer responsibility and light blue aligning with CSP responsibility. For example, CMMC requirements such as Physical Protection (PE) for limiting physical access (C028) is managed by the CSP. Establishment of respective policies and procedures are the customer’s responsibility. It’s important to note that this blog series is aligned with setting the foundation of controls for CMMC Maturity Levels 1 & 2. Once C3PAOs are identified by the CMMC Accreditation Body, customers are advised to work with their respective C3PAO for guidance on comprehensive alignment of controls, audit and certification.
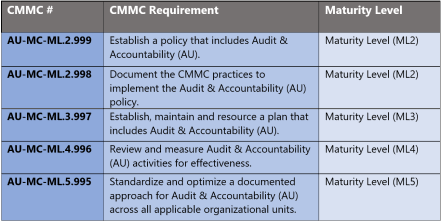
The administrative controls for the CMMC Audit & Accountability Maturity Capability (AU-MC) are listed here. These controls fall within the customer’s responsibility. This starts with establishing a policy that includes audit & accountability (ML2) and progresses to a documented approach across all applicable organizational units (ML5). These controls should be formally created, documented in the System Security Plan (SSP) and implemented within the organization.
Microsoft Azure Security Controls Aligned to CMMC: Audit & Accountability Management

Azure Security Controls Aligned to CMMC: Audit & Accountability Management
Microsoft Azure Government has developed an 11-step process to facilitate audit & accountability management with the security principles within CMMC, NIST SP 800-53 R4 and NIST SP 800-171 standards. Note this process is a starting point, as CMMC requires alignment of people, processes, policy, and technology so refer to organizational requirements and respective standards for implementation. Azure has several offerings to facilitate audit & accountability management including Azure Active Directory, Azure Policy, Azure Monitor, Azure Sentinel and Log Analytics Workspace.
- Azure Active Directory is an identity and access management-as-a-service (IDaaS) solution that combines single-on capabilities to any cloud and on-premises application with advanced protection.
- Azure Policy helps you manage and prevent IT issues with policy definitions that enforce rules and effects for your resources.
- Azure Monitor helps collect, analyze, and act on telemetry data from your Azure and on-premises environments. Azure Monitor helps you maximize performance and availability of your applications and proactively identify problems in seconds.
- Azure Sentinel is a scalable, cloud-native, security information event management (SIEM) and security orchestration automated response (SOAR) solution.
- Log Analytics Workspace is a unique environment for Azure Monitor log data. Each workspace has its own data repository and configuration. Data sources and solutions are configured to store their data in a workspace.
11 Steps to CMMC for Audit & Accountability Management with Microsoft Azure
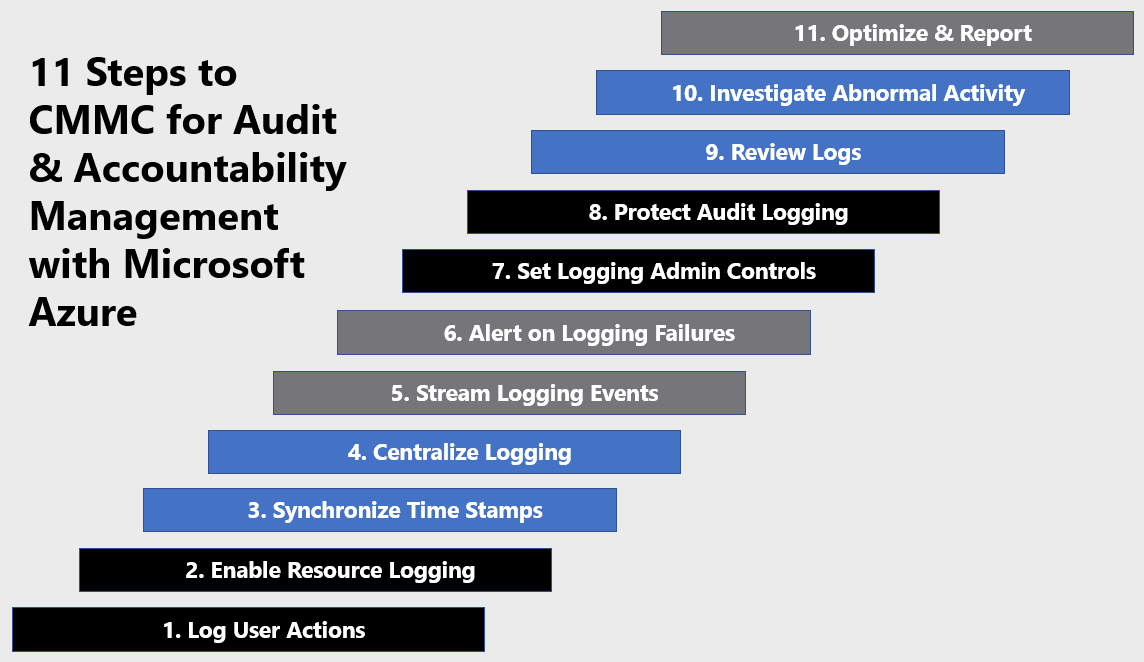
1) Log User Actions
Azure Active Directory (Azure AD) records all user activity in the Azure portal. The audit logs report consolidates the following reports:
- Audit report
- Password reset activity
- Password reset registration activity
- Self-service groups activity
- Office365 Group Name Changes
- Account provisioning activity
- Password rollover status
- Account provisioning errors
You can use advanced filtering in the audit report to access a specific category of audit data, by specifying it in the Category filter. For example, to view all activities related to users, select the UserManagement category. Categories include:
- All
- AdministrativeUnit
- ApplicationManagement
- Authentication
- Authorization
- Contact
- Device
- DeviceConfiguration
- DirectoryManagement
- EntitlementManagement
- GroupManagement
- Other
- Policy
- ResourceManagement
- RoleManagement
- UserManagement
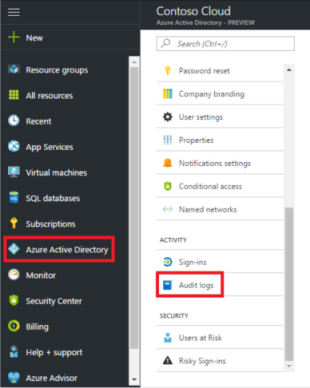
Review user activity in Azure AD via the steps below: For more information, see Find activity reports in the Azure portal.
- Navigate to the Azure portal.
- Select your directory from the top-right corner, then select the Azure Active Directory blade from the left navigation pane.
- Select Audit logs from the Activity section of the Azure Active Directory blade.

2) Enable Resource Logging
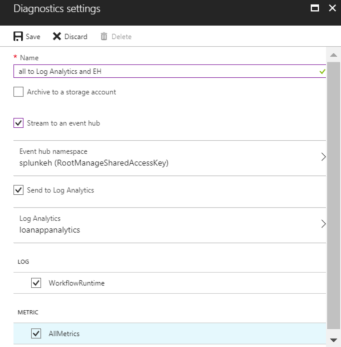
Enable Diagnostic Settings on Azure resources for access to audit, security, and diagnostic logs. Activity logs, which are automatically available, include event source, date, user, timestamp, source addresses, destination addresses, and other useful elements. Enable resource logging with Azure Monitor via the steps below. Additional metric and log data can be collected using extensions to configure diagnostics on your VMs from the guest operating system. For more information, see Create a diagnostic setting and How to monitor virtual machines in Azure.
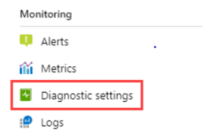
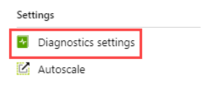
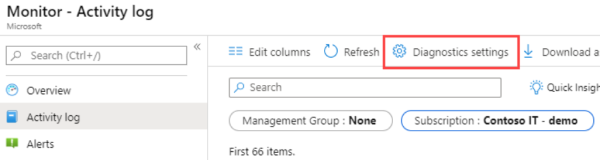
- Where you configure diagnostic settings in the Azure portal depends on the resource.
- For a single resource, click Diagnostic settings under Monitor in the resource’s menu.

- For one or more resources, click Diagnostic settings under Settings in the Azure Monitor menu and then click on the resource.

- For the Activity log, click Activity log in the Azure Monitor menu and then Diagnostic settings.

- For a single resource, click Diagnostic settings under Monitor in the resource’s menu.
- If no settings exist on the resource you have selected, you are prompted to create a setting. Click Add diagnostic setting.
- Give your setting a name if it doesn’t already have one.
- Check the box for each destination to send the logs. Options include Log Analytics workspace, Storage account, Event hub namespace, Event hub name and/or Event hub policy name. Select Configure.

- Check the box for each of the categories of data to send to the specified destinations. The list of categories will vary for each Azure service.
- Click Save.
3) Synchronize Time Stamps
Time sync is important for security and event correlation. Sometimes it is used for distributed transactions implementation. Time accuracy between multiple computer systems is achieved through synchronization. Synchronization can be affected by multiple things, including reboots and network traffic between the time source and the computer fetching the time.
Accuracy for a computer clock is gauged on how close the computer clock is to the Coordinated Universal Time (UTC) time standard. UTC is defined by a multinational sample of precise atomic clocks that can only be off by one second in 300 years. But, reading UTC directly requires specialized hardware. Instead, time servers are synced to UTC and are accessed from other computers to provide scalability and robustness. Every computer has time synchronization service running that knows what time servers to use and periodically checks if computer clock needs to be corrected and adjusts time if needed.
Azure hosts are synchronized to internal Microsoft time servers that take their time from Microsoft-owned Stratum 1 devices, with GPS antennas. Virtual machines in Azure can either depend on their host to pass the accurate time (host time) on to the VM or the VM can directly get time from a time server, or a combination of both. For more information, see Time sync in Azure.
4) Centralize Logging
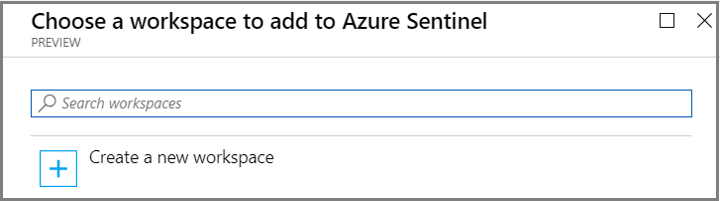
Ingest logs via Azure Monitor to aggregate security data generated by endpoint devices, network resources, and other security systems. Within Azure Monitor, use Log Analytics Workspace(s) to query and perform analytics, and use Azure Storage Accounts for long-term/archival storage. Alternatively, you may enable and on-board data to Azure Sentinel or a third-party SIEM. Enable Azure Sentinel for centralized logging via the steps below.
- Sign into the Azure Portal. Select the subscription in which Azure Sentinel will be created.
- Search for and select Azure Sentinel.
- Select Add.
- Select the workspace you want to use or create a new one. You can run Azure Sentinel on more than one workspace, but the data is isolated to a single workspace.

- Select Add Azure Sentinel.
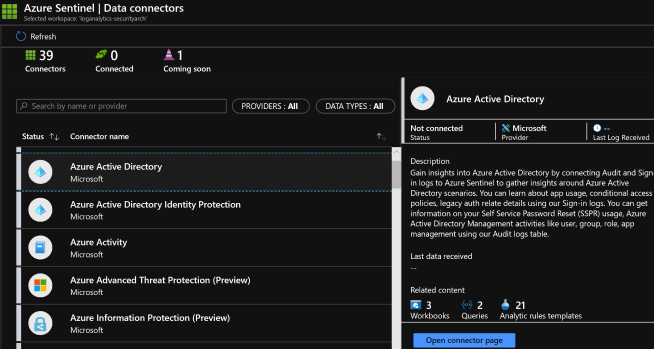
- Click Data collection.
- Select your respective data sources. Not there are tiles for each data source you can connect. For example, click Azure Active Directory. If you connect this data source, you stream all the logs from Azure AD into Azure Sentinel. You can select what type of logs you want to get – sign-in logs and/or audit logs.
- Select desired workbooks to get pre-built security insight dashboards for your data sources.
After your data sources are connected, your data starts streaming into Azure Sentinel and is ready for you to start working with. You can view the logs in the built-in dashboards and start building queries in Log Analytics to investigate the data. For more information, see Quickstart: On-board Azure Sentinel.
5) Stream Logging Events
Azure Sentinel creates the connection to services and apps by connecting to the service and forwarding the events and logs to Azure Sentinel. For machines and virtual machines, you can install the Azure Sentinel agent that collects the logs and forwards them to Azure Sentinel. For Firewalls and proxies, Azure Sentinel utilizes a Linux Syslog server. The agent is installed on it and from which the agent collects the log files and forwards them to Azure Sentinel.
- Sign into the Azure Portal.
- Search for and select Azure Sentinel.
- Select the desired Azure Sentinel Workspace.
- Click Data collection under the Configuration section.
- There is a tile for each data source you can connect.

For example, click Azure Active Directory. If you connect this data source, you stream all the logs from Azure AD into Azure Sentinel. You can specify what type of logs you’d like to stream- sign-in logs and/or audit logs.
At the bottom, Azure Sentinel provides recommendations for which workbooks you should install for each connector so you can immediately get interesting insights across your data.
Follow the installation instructions or refer to the relevant connection guide for more information. For information about data connectors, see Connect data sources.
6) Alert on Logging Failures
Alerting on logging failures is configured in Azure Monitor. Log search alert rules work only on the logic you build into the query. The alert system doesn’t have any other context of the state of the system, your intent, or the root cause implied by the query. As such, log alerts are referred to as state-less. The conditions are evaluated as “TRUE” or “FALSE” each time they are run. An alert will fire each time the evaluation of the alert condition is “TRUE”, regardless of it is fired previously. Setting alerting for logging agents related to Health Service and Service Connectors issues monitors for logging failures.
Filter the Operations Manager agent (Windows) or Log Analytics Agent (Linux) event log by Event sources – Health Service Modules, HealthService, and Service Connector. Filter by Event Level Warning and Error to confirm if it has written events from the following table. If they are, review the resolution steps included for each possible event. Below are common log event failures to monitor and alert on. For more information, see Log alerts in Azure Monitor.

7) Set Logging Admin Controls
Azure Monitor stores log data in a Log Analytics workspace. A workspace is a container that includes data and configuration information. To manage access to log data, you perform various administrative tasks related to your workspace. You can view the access control mode configured on a workspace from the Azure portal. You can view the current workspace access control mode on the Overview page for the workspace in the Log Analytics workspace menu. Configure Log Analytics Workspace access via the steps below. For more information, see Manage access to log data and workspaces in Azure Monitor.
- Sign into the Azure Portal.
- In the Azure portal, select Log Analytics workspaces > your workspace.

- Select Properties. Changing the setting will be disabled if you don’t have permissions to configure the workspace.


8) Protect Audit Logging
There are several approaches to protecting audit logging. The processes referenced below provide a starting point and foundation for protecting audit logging:
- Manage Access to Log Data
- Configure Audit Log Retention
- Segregate Access to Audit Logging Systems with Network Security Groups
- Stream Logging Events to Multiple Sources for Redundancy
- Encrypt Logs
- Backup Logs with Recovery Services Vault
- Configure Read Only Storage Keys for Logging
9) Review Logs
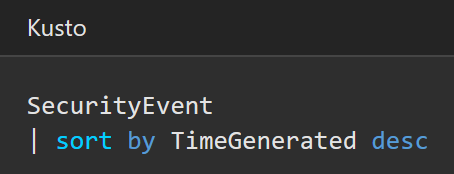
There are several methods to reviewing logs in Azure including log queries in Azure Monitor and Workbooks in Azure Sentinel. You can leverage Azure Monitor for writing log queries. Queries can start with either a table name or the search command. You should start with a table name since it defines a clear scope for the query and improves both query performance and relevance of the results. Azure Monitor queries are based in the Kusto Query Language (KQL) per the example below. For more information, see Get started with log queries in Azure Monitor.
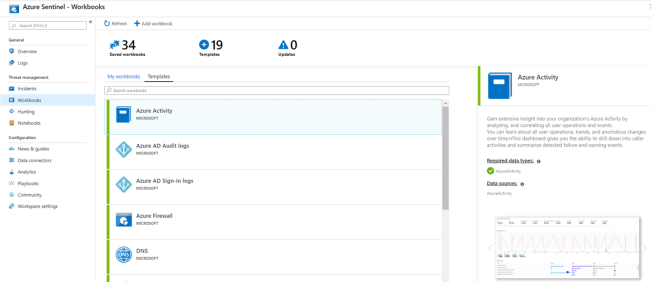
You can visualize and monitor log data using the Azure Sentinel adoption of Azure Monitor Workbooks, which provides versatility in creating custom dashboards. Azure Sentinel allows you to create custom workbooks across your data, and also comes with built-in workbook templates to allow you to quickly gain insights across your data as soon as you connect a data source. You can create custom workbooks or follow the steps below to start with a built-in workbook. For more information, see Tutorial: Visualize and monitor your data.
- Sign into the Azure Portal.
- Search for and select Azure Sentinel.
- Go to Workbooks and then select Templates to see the full list of Azure Sentinel built-in workbooks. To see which are relevant to the data types you have connected, the Required data types field in each workbook will list the data type next to a green check mark if you already stream relevant data to Azure Sentinel.

- Click View workbook to see the template populated with your data.
- To edit the workbook, select Save, and then select the location where you want to save the json file for the template.
- Select View workbook. Then, click the Edit button at the top. You can now edit the workbook and customize it according to your needs.

- After you make your changes, you can save the workbook.
- You can also clone the workbook: Select Edit and then Save as, making sure to save it with another name, under the same subscription and resource group. These workbooks are displayed under the My workbooks tab.

10) Investigate Abnormal Activity
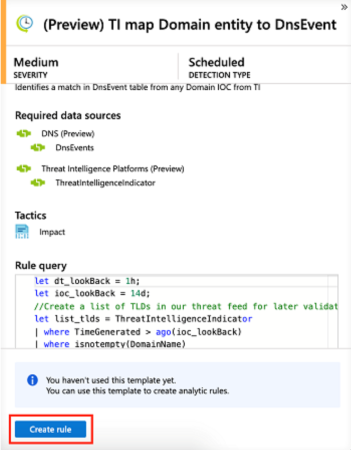
After you connected your data sources to Azure Sentinel, you want to be notified when something suspicious happens. To enable you to do this, Azure Sentinel provides you with out-of-the-box built-in templates. These templates were designed by Microsoft’s team of security experts and analysts based on known threats, common attack vectors, and suspicious activity escalation chains. After enabling these templates, they will automatically search for any activity that looks suspicious across your environment. Many of the templates can be customized to search for, or filter out, activities, according to your needs. The alerts generated by these templates will create incidents that you can assign and investigate in your environment. Create an Azure Sentinel Detection rule via the steps below. For more information, see Tutorial: Detect threats out-of-the-box.
- Sign into the Azure Portal.
- Search for and select Azure Sentinel.
- In order to use a built-in template, click on Create rule to create a new active rule based on that template. Each entry has a list of required data sources that are automatically checked and this can result in Create rule being disabled.

- This opens the rule creation wizard, based on the selected template. All the details are auto filled, and for Scheduled rules or Microsoft security rules, you can customize the logic to better suit your organization, or create additional rules based on the built-in template. After following the steps in the rule creation wizard and finished creating a rule based on the template, the new rule appears in the Active rules tab.
11) Optimize & Report
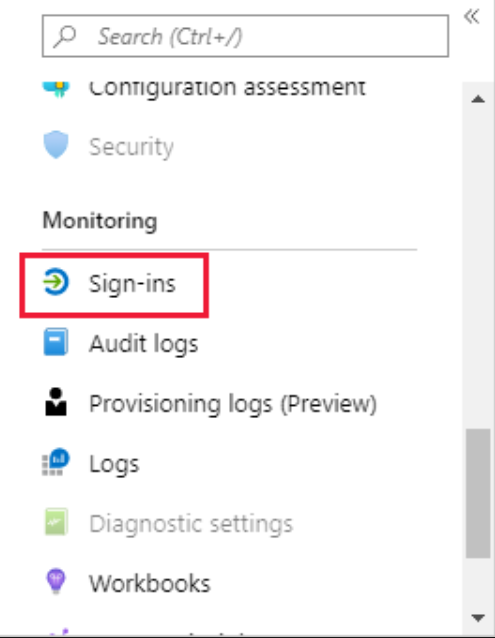
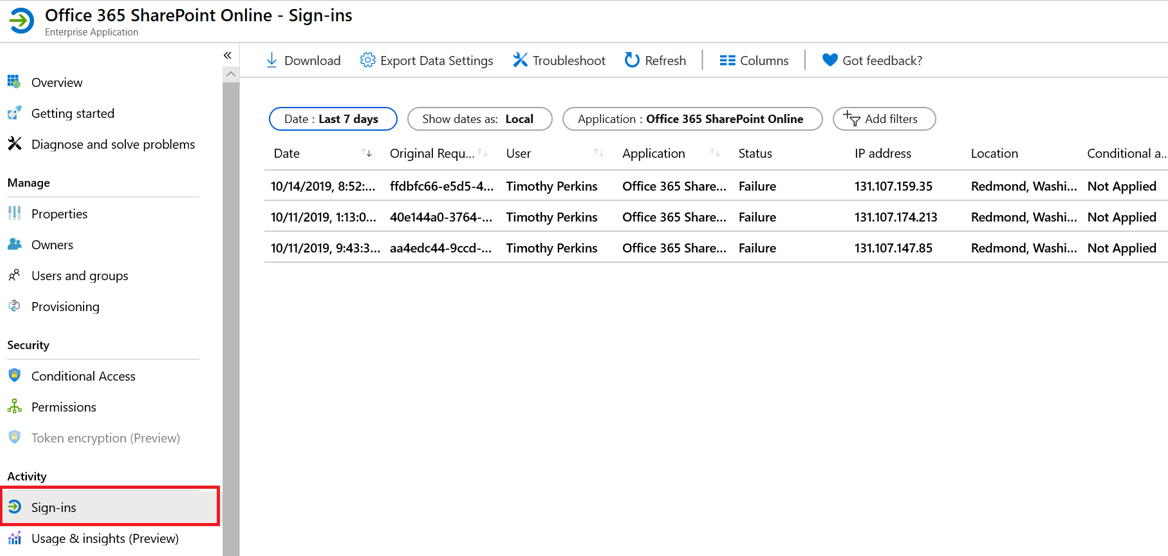
There are numerous Azure solutions to facilitate log reporting, reduction and optimization. These capabilities range from threat reporting in Azure Sentinel, to log reporting in Azure Monitor, to usage reporting in Azure Advisor. Azure Active Directory provides the capability to report on user sign-in, usage, and insights. Create a User Sign-in report via the steps below. The Azure AD Sign-ins report provides user sign-in patterns, quantity of sign-ins and status of sign-ins. For more information, see Sign-in activity reports in the Azure Active Directory portal.
- On the Azure portal menu, select Azure Active Directory, or search for and select Azure Active Directory from any page.
- Under Monitoring, select Sign-ins to open the Sign-ins report.

- View and customize Sign-in reporting.

Learn more about CMMC with Microsoft
Here are some of the best resource to learn more about CMMC in the cloud with Microsoft:
- Accelerating CMMC compliance with Microsoft cloud (in depth review)
- CMMC-AB Standards with Regan Edens – National Conversation
- The Office of the Under Secretary of Defense for Acquisition and Sustainment CMMC Website
- The CMMC Accreditation Body Website
- Defense Federal Acquisition Regulation Supplement (DFARS)
- NIST SP 800-171 Compliance
Bookmark the Security blog to keep up with our expert coverage on security matters and follow us at @MSFTSecurity or visit our website for the latest news and updates on cybersecurity.
Are you a federal government agency that needs help with cybersecurity? Reach out to TJ Banasik or Mark McIntyre for additional details on the content above, or if you have any other questions about Microsoft’s cybersecurity investments for the federal government.
0 comments