


Building an application allows you to operationalize the data you have in Microsoft Fabric, such that it can be consumed by stakeholders in your organization to generate business insights. Streamlit is easy to use to build simple applications without needing to know front-end application frameworks like Flask, Django etc. It makes it easier to prototype and visualize your data in Microsoft Fabric with Streamlit framework.
In this blog post we will show how to develop an app using Streamlit and Fabric SQL database. Consider a scenario that you are a data engineer in a retail company and want to keep track of your product inventory. With a Streamlit app, you can connect to your Fabric SQL database where all the inventory data is stored and then create a really cool app that lets you see which products are running low, which ones are selling fast, and even predict future inventory needs.
Prerequisites
- You need an existing Fabric capacity. If you don’t have one, start a Fabric trial.
- Make sure that you Enable SQL database in Fabric using Admin Portal tenant settings.
- Install Visual Studio code, Python runtime and Python extension for VS Code on our local machine.
Create a workspace
- Sign in to Microsoft Fabric .
- Select Workspaces > New workspace.
- Fill out the Create a workspace.
- In the Advanced section, choose Fabric capacity or Trial in the License mode section, or choose a premium capacity you have access to.
- Select Apply to complete creation of the workspace.
Create your first SQL database
- Ensure you are in the Workspace you created earlier by selecting the Workspaces icon in the navigation bar, and then selecting the Workspace you created in the last step.
- Create a Fabric SQL database by selecting the + New item.
- In the New Item | All Items panel, scroll to the Store Data area and select SQL database (preview).
- Open the SQL database in Fabric database you created in the last tutorial step. You can find it in the navigation bar of the Fabric portal, or by finding it in your Workspace for this tutorial.
- Select the Sample data button. This takes a few moments to populate your tutorial database with the SalesLT sample data.
- Once the sample data is imported, SalesLT schema and associated tables are added to the object explorer.
- Select the settings->Connection string to get the ODBC connection string for the SQL Database.
Develop Streamlit app
Use Visual Studio code for developing the application.
- Create a folder to work on this project. Open it in VS Code.
- Create Python virtual environment in your working directory.
- Create requirements.txt file. Add the following libraries
streamlit
pandas
pyodbc
- Run the following command in VS Code terminal to setup all the requirements.,
pip install -r requirements.txt
- Create app.py file and copy this code into the file.
import streamlit as st
import pyodbc
import pandas as pd
import os
import struct

# Database Connection Settings
# ODBC Connection String
CONN_STR = (
    'REPLACE_WITH_ODBC_CONNECTION_STRING'
)

# Function to connect to Azure SQL
def connect_to_db():
    try:
        conn = pyodbc.connect(CONN_STR)
        return conn
    except Exception as e:
        st.error(f"Database connection failed: {str(e)}")
        return None
# Streamlit UI

st.title("Fabric SQL Streamlit App")
if st.button("Fetch Data"):
    conn = connect_to_db()
    st.header("Show all products and description", divider="gray")
if conn:
        query = "SELECT TOP (100) * FROM [SalesLT]. [vProductAndDescription]"
      df = pd.read_sql(query, conn)
      st.write(df)
      st.title("📊 Simple Bar Chart Example")
      getproductsbymodel= "SELECT top 5 ProductModel, ProductCount=COUNT(*)  FROM [SalesLT].[vProductAndDescription] GROUP by ProductModel order by ProductCount DESC"
      chartdf = pd.read_sql(getproductsbymodel, conn)

      # Bar Chart
      st.subheader("Get Products inventory by Model:")
      st.bar_chart(chartdf.set_index('ProductModel'))
      # Display Data
      st.subheader("Data:")
      st.dataframe(chartdf)
      # Close Connection
      conn.close()
    else:
      st.error("Database connection failed.")
Test locally
Open a terminal in VS code and run python -m streamlit run app.py . You will the similar output in the terminal window.
(.venv) C:\streamlitappdemo>python -m streamlit run app.py

  You can now view your Streamlit app in your browser.

  Local URL: http://localhost:8501

  Network URL: http://10.12.110.104:8501
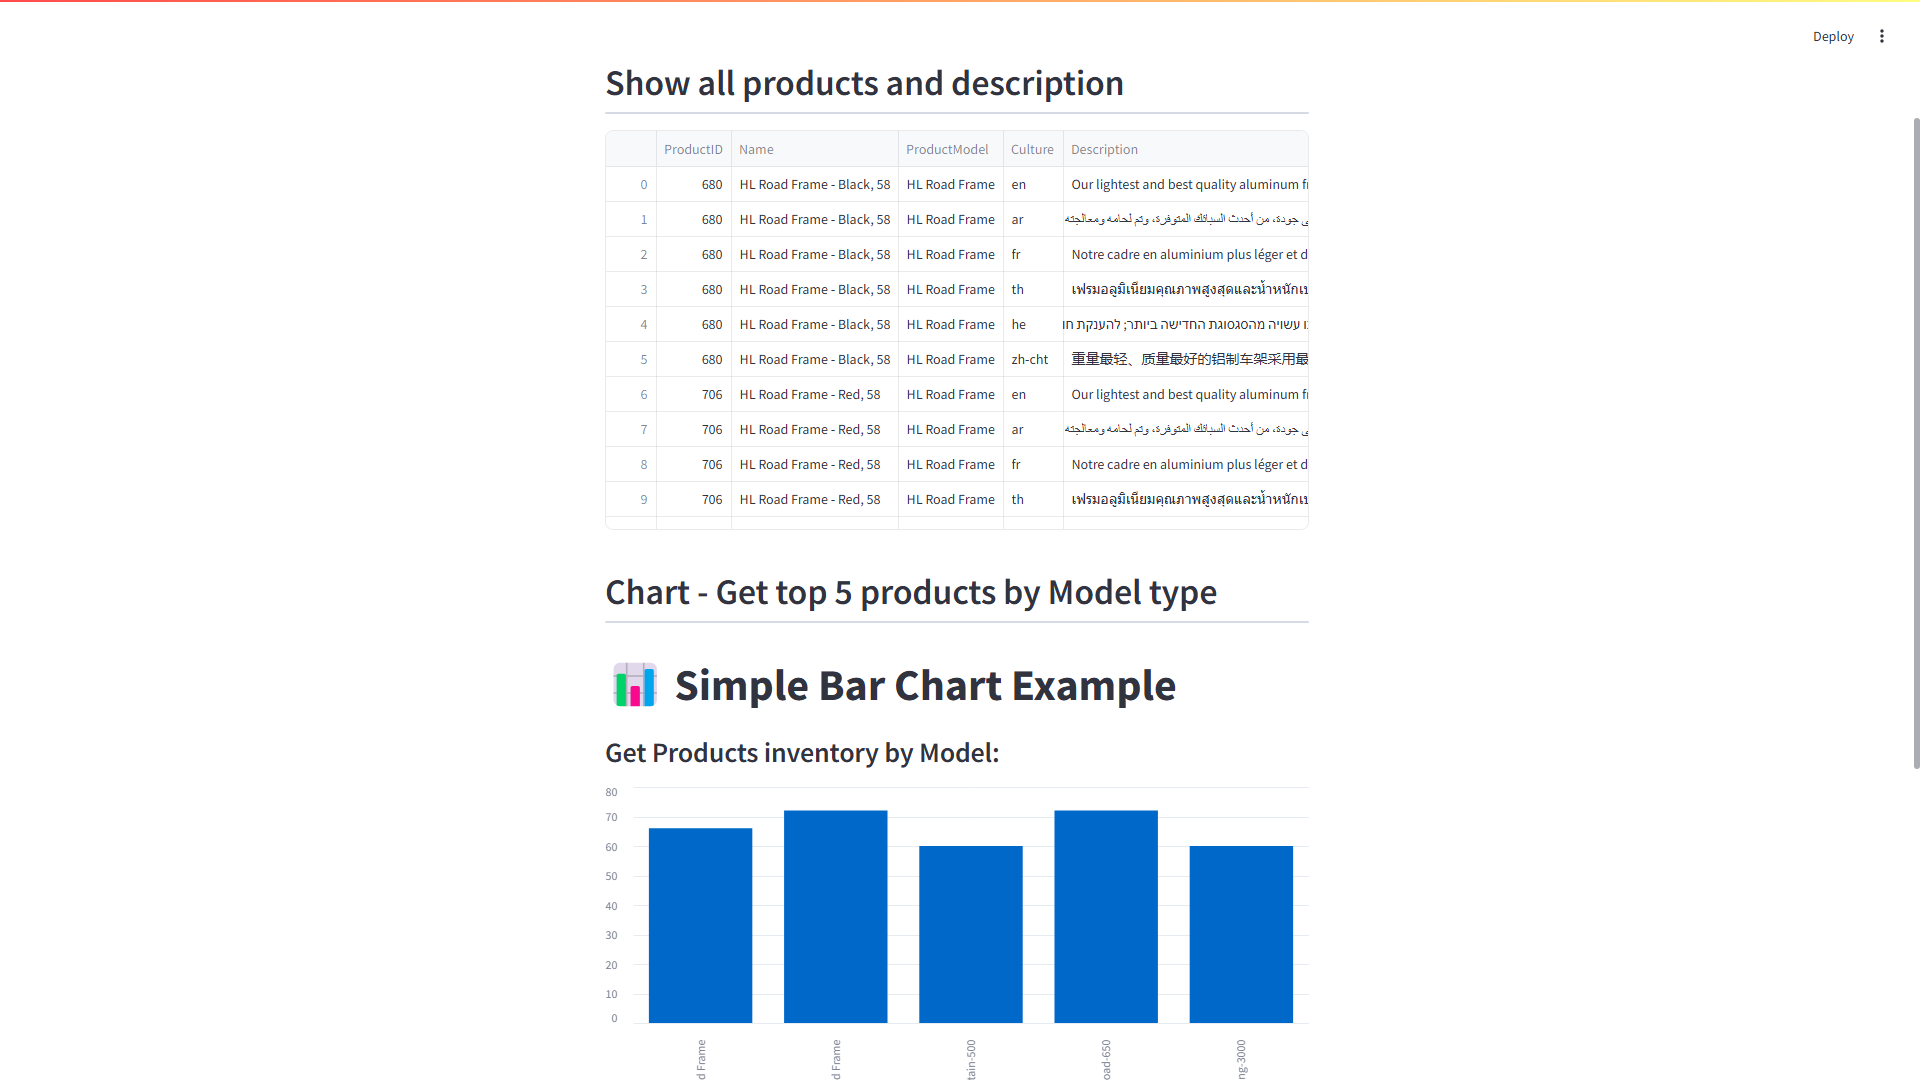
Select the local URL and run it in your browser. Select Fetch data and this will ask you to authenticate to valid your permissions to the database before fetching the results. Your app will show the data return
- Table with all the products
- Bar chart showing count of products by Model type
Conclusion
These visualizations offer a clear and concise view of your data, making it easier to derive meaningful insights. By leveraging Streamlit and Fabric SQL database, you can create powerful data-driven applications quickly and efficiently. To make this production ready and deploy to Azure web app , see how to deploy Streamlit app to Azure web apps.
0 comments