Today the Visual Studio team is proud to announce the release of Visual Studio 2019 v16.8 and v16.9 Preview 1. These releases have several notable features from the teams improving Git Productivity, C++, IntelliCode, .NET, XAML, and Web Tools. In addition, we hope you have been able to sign-up for our Preview of GitHub Codespaces as there is so much excitement about this new development environment!
While I detail the features released today, why not take a few minutes to download our latest version to try some of these updates for yourself? We love to hear feedback on Developer Community, so please do not hesitate to add suggestions for product improvement or problems you may encounter. There is so much content to cover today, so let’s get started on what’s new!
What’s Releasing in Visual Studio 2019 v16.8?
Git Productivity
Git is now the default version control experience in Visual Studio 2019. We have spent the last two releases building out the feature set and iterating based on your feedback. The experience has now been turned on by default for everyone. From the new Git menu, you can clone, create, or open repositories. Use the integrated Git tool windows to commit and push changes to your code, manage branches, stay up to date with your remote repositories, and resolve merge conflicts. Find a full list of features in the Release Notes and earlier blog posts. Learn how to use and customize the experience in documentation. Please be sure to supply feedback as we continue to enhance the experience!

C++20 Conformance
In this release, we have improved support for major C++20 features across our compiler, standard library, and IDE. You can use Modules, Coroutines, and some Ranges in the same project. All of the major feature work is complete and available under /std:c++latest. From our team, comes a reminder to include the <coroutine> header to access the new Coroutines features. If you need to access any of the legacy behavior, this remains available under <experimental/coroutine> and the use of the /await switch. When it comes to Modules, header units and experimental MSBuild support will work out any module dependencies automatically. This ensures they are built in the correct order.
Our teams have put together additional blog posts on both Coroutines and Modules, so please take a look if you’d like to learn more.
In addition, we do support most of the C++ Ranges, but still have some work to do in order to deliver full functionality to you. While this release includes support for most of the range-based algorithms, you can track progress of what is left to do in this GitHub issue.
Finally, IntelliSense also provides support for C++20 <concepts> and <ranges> headers and rename and browsing for concept definitions.
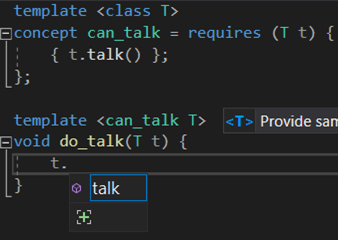
Standard Template Library (STL) Features and Optimization
Another thing that makes us excited are the new STL features and optimizations.
Examples include:
- std::atomic_ref<T> which allows you to perform atomic operations on non-atomic objects.
- Our std::midpoint and std::lerp implementations are now constexpr.
- std::execution::unseq indicates that an algorithm’s execution may be vectorized on a single thread.
- We’ve hand-vectorized our std::reverse_copy implementation
While we can list several more of these examples, you may enjoy the more thorough list on our Change log.
As a final mention, conditionally trivial special member functions are supported by Microsoft Visual C++ (MSVC.)
C17 Conformance
All required features of C11 and C17 are now supported using the /std:c11 and /std:c17 switches. This includes:
- _Pragma
- restrict
- _Noreturn and <stdnoreturn.h>
- _Alignas, _Alignof and <stdalign.h>
- _Generic and <tgmath.h> support
- _Static_assert
Please do note that the optional features are not supported, so we do not claim C99 compliance. Learn more in our C11/C17 blogpost.
C++ Productivity
Reduced Linking Time
In this area, we have significantly reduced the linking time when building with full debug information by multi-threading the PDB file generation. Several large applications and AAA games have two to four times faster linking. These improvements bring the /debug:full mode very close to the /debug:fastlink times.
New CMake Version
Next, we have upgraded the version of CMake shipping within Visual Studio to CMake 3.18. This will enable you to use their new CMake profiling feature.
Debug Linux Core Dumps
Also, you can now debug Linux core dumps on a remote Linux system or WSL directly from Visual Studio. This may be helpful if you run a “Windows shop” but deploy to Linux servers and want to diagnose crashes in a familiar environment.
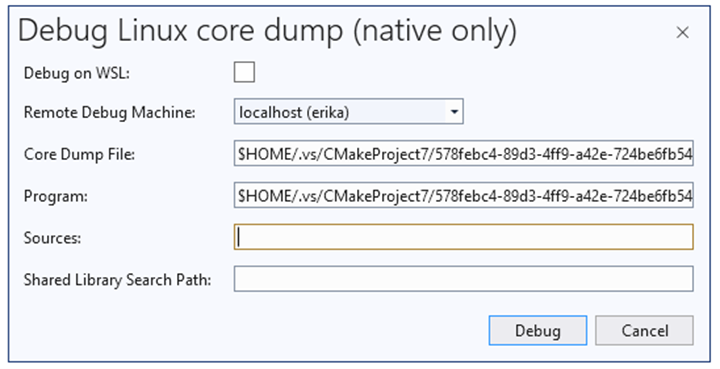
Speaking of Linux, we’ve improved our error reporting for missing build tools on Linux projects. Previously, you would encounter a lot of errors when compiling, debugging, or using IntelliSense. Now you get a warning in the toolbar and a clear error telling you about the missing tools in the error view.


Also, while mentioning debugger, the Visual Studio debugger has support for char8_t.
IntelliSense Code Linter
New warnings and quick-fixes based on an IntelliSense-driven code linter are now available from the editor. Now, you can configure it in Tools->Options->Text Editor->C/C++->CodeStyle->Linter + Fixups. You’ll be able to get warnings and fixes for arithmetic overflow, uninitialized local variables, converting the result of an integer division to float, and more!

Next to highlight is how our code analysis tools now support the SARIF 2.1 standard. This is the industry standard static analysis log format. Behind the scenes, SARIF 2.1 powers the MSVC code analysis experience in Visual Studio 2019. Included in the functionality is error list population in both regular and background code analysis runs, green squiggles and fix-its.
In the near future, we plan to improve the IDE experience further by color coding the squiggles according to severity level (Info/Warning/Error) of each defect based on information in the SARIF logs. You can read more about the format SARIF format in the official specification.
Also, users can now build, deploy and debug ARM64 projects using the LLVM (clang-cl) toolset which includes IntelliSense support.
AMX Intrinsics
We have added support for Intel AMX intrinsics to the compiler. Find out more about these intrinsics in Intel’s AMX documentation.
.NET Productivity
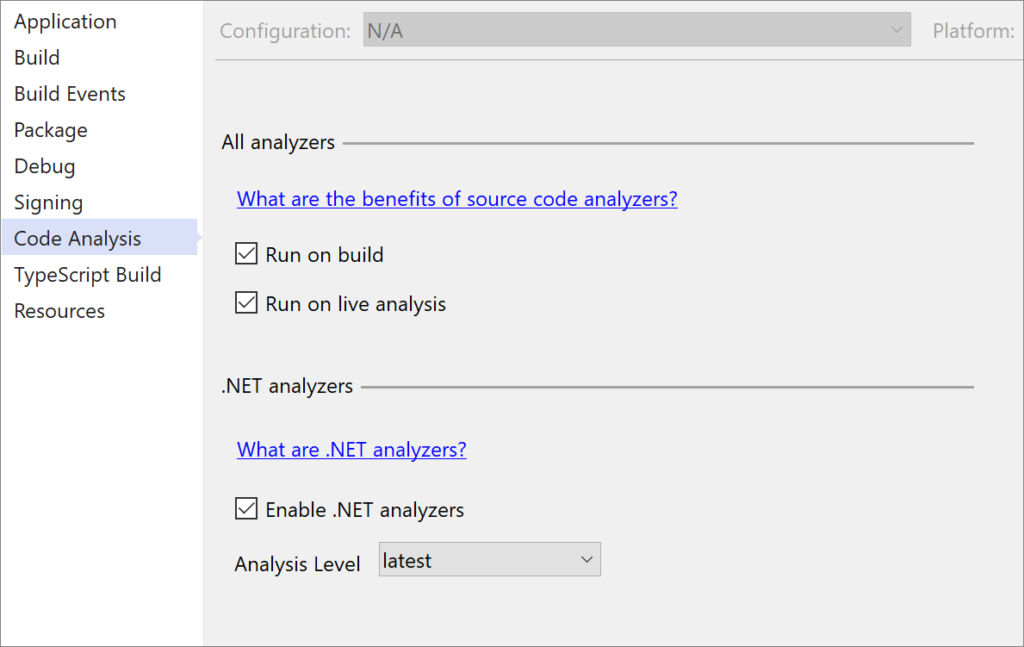
On the .NET compiler platform, Roslyn analyzers inspect your C# or Visual Basic code for security, performance, design, and other issues. Starting in .NET 5.0, these analyzers are included with the .NET SDK. These are enabled by default for projects that target .NET 5.0 or later. You can enable code analysis on projects that target earlier versions by selecting Enable .NET analyzers in the Project Properties window.
Inline Parameter Name Hints
In addition, C# and Visual Basic support for inline parameter name hints that insert adornments for literals, casted literals, and object instantiations prior to each argument in function calls. To utilize this feature, you will first need to turn this option on in Tools > Options > Text Editor > C# or Basic > Advanced and select Display inline parameter name hints (experimental). The inline parameter name hints will then appear in C# or Visual Basic file.

IntelliCode
C# developers can now automate training a model for personalized IntelliCode completions for the unique types only found in their codebase in Visual Studio or as part of their CI workflow.
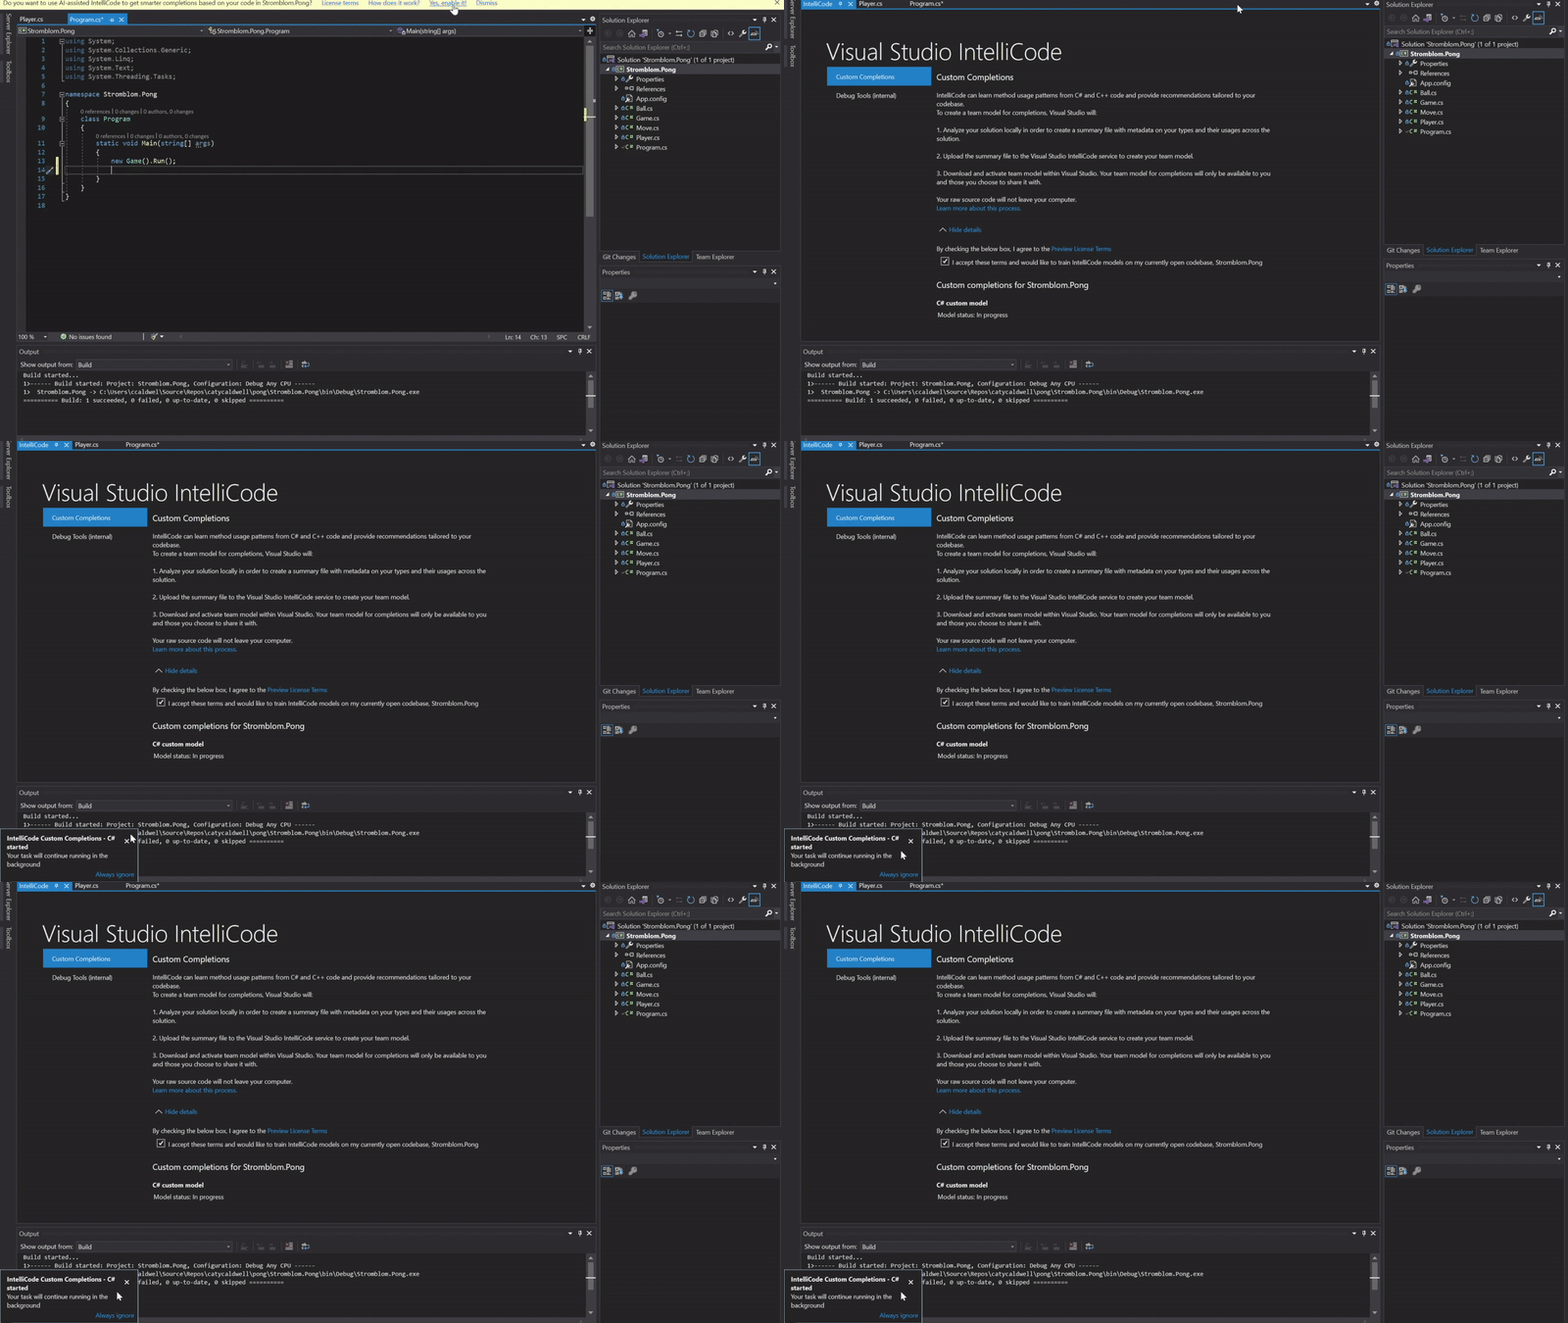
In Visual Studio: Upon a successful build of a C# project, users will be prompted to enable automatic model training for personalized completions. These completions will appear as starred completion items in the context where the IntelliSense list is triggered. Learn more here.
As part of Continuous Integration workflow: Now you can keep your IntelliCode completions up-to-date with your latest commit and share automatically with anyone with access to your git repository via the IntelliCode GitHub Action for Team Completions or the Azure DevOps Build Task. Learn more here.
Refactoring in .NET
Next, there is refactoring introducing the new C# 9 not pattern matching syntax when a suppression operator is present. Place your cursor on the suppression operator. Press (Ctrl+.) to trigger the Quick Actions and Refactorings menu. Select Use pattern matching.

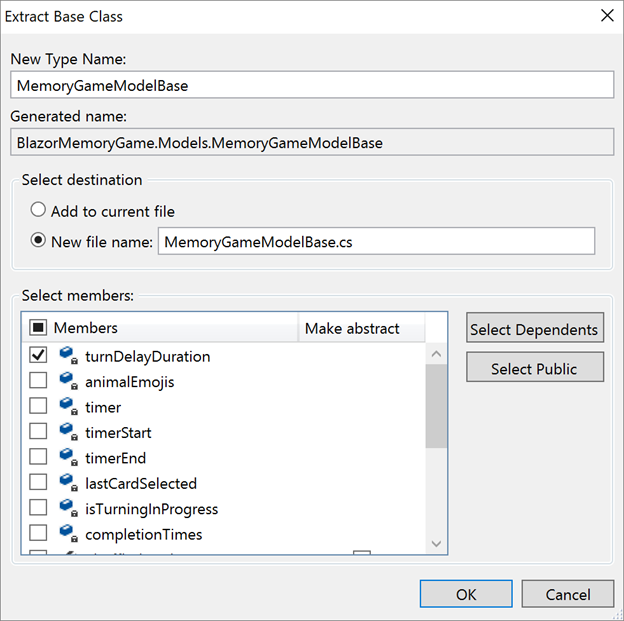
In addition, you can extract members from a selected class to a new base class with the new Extract Base Class refactoring. To give this feature a try, place your cursor on either the class name or a highlighted member. Press (Ctrl+.) to trigger the Quick Actions and Refactorings menu. Select Pull member(s) up to new base class. The new Extract Base Class dialog will open where you can specify the name for the base class and location of where it should be placed. You can select the members that you want to transfer to the new base class and choose to make the members abstract by selecting the checkbox in the Make Abstract column.
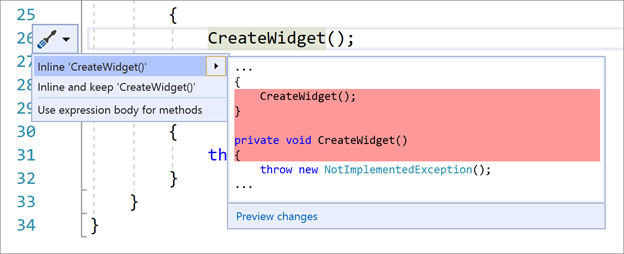
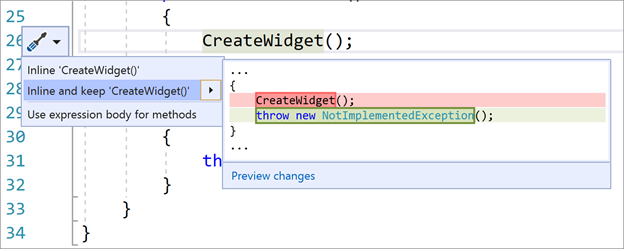
Inline method refactoring helps you replace usages of a static, instance, and extension method within a single statement body with an option to remove the original method declaration. From the Quick Actions and Refactorings menu, select from one of the following options:
- Inline <QualifiedMethodName> removes the inline method declaration
- Inline and keep <QualifiedMethodName> preserves the original method declaration.
Debugger
Similar to the feature added from our C++ team, we realized debugging a captured managed Linux core dump on Windows has been difficult. It would usually mean setting up another Linux environment that precisely mirrored production and then installing a set of tools for analysis. Thankfully, with Visual Studio 2019 16.8 you can simply drag and drop a managed Linux core dump directly into your IDE and immediately start debugging.

.NET Auto Analysis
Asynchronous (async) programming has been around for several years on the .NET platform but has historically been difficult to do effectively. We have introduced managed memory dump analyzers that help identify Sync-over-Async and Threadpool exhaustion.
Memory hot path Auto Analysis allows you to intuitively view the domination object types in their memory heap by using flame annotations in the Diagnostic Memory Tool window.
XAML
XAML Data Binding Failure Detection & Diagnostics
If you work on WPF, UWP, WinUI and Xamarin.Forms projects, you must often detect and resolve XAML data binding failures in applications. To improve the diagnostic tooling in this scenario we have added two new experiences to Visual Studio 2019:
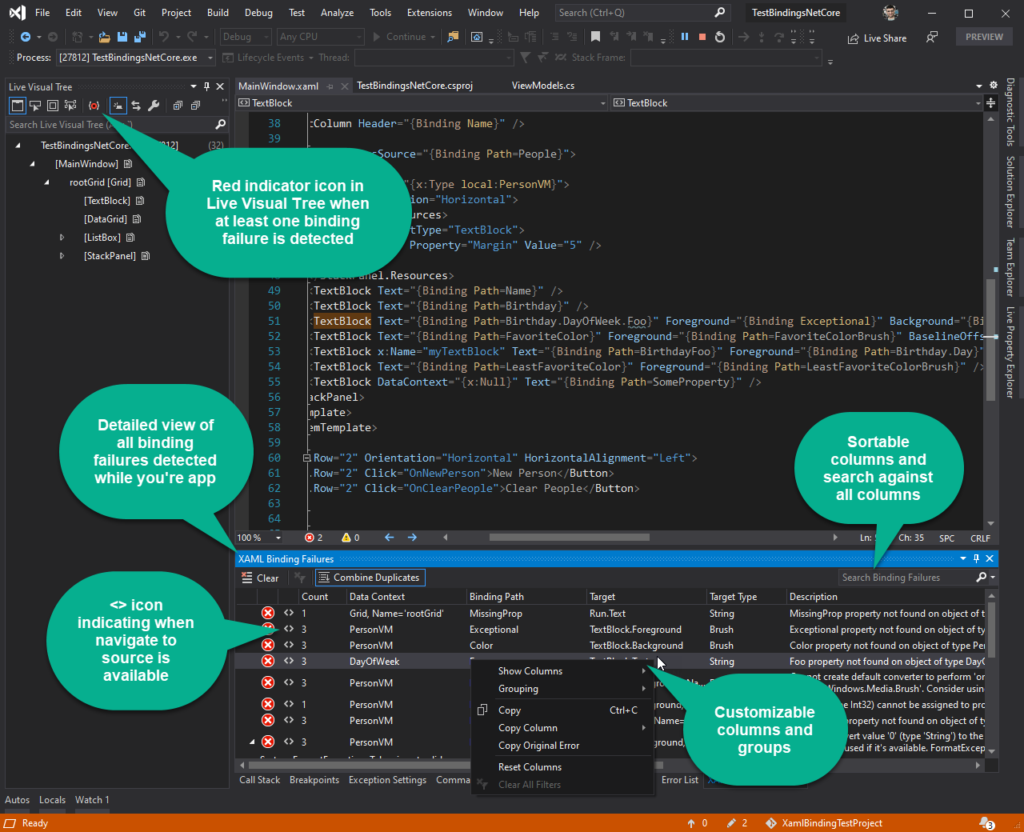
First we bring a XAML Binding Failure Indicator Icon. A new XAML Binding failure indicator icon is now present in the in-app toolbar for WPF and UWP projects, but also in the Live Visual Tree for all XAML projects. This includes Xamarin.Forms. The icon will show a red indicator if at least one binding failure is detected. Clicking the icon will also take you to the new XAML Binding Failures window.
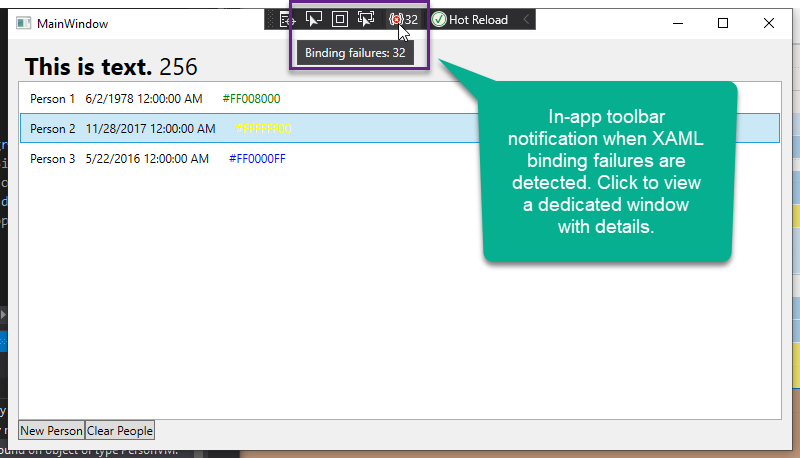
Next, we have added the XAML Binding Failures Window. This new window is available for WPF, UWP, WinUI and Xamarin.Forms projects. This new dedicated experience provides a rich user interface over the binding failure information that was previously only available in the Output Window. Improvements include the ability to see the failures as a set of columns that can be sorted, customized and are fully searchable. We have also grouped similar errors together limiting the noise that can occur during certain combination of data binding templates failures while still making all the original raw error information available and easily copied through a right-click menu option. As a side note, this requires Xamarin version 4.5.0.266-pre3 or higher.
Finally, you can navigate to Source for binding failures. In partnership with the WPF team, we have enabled the ability to navigate to source of binding failures for those customers who are targeting WPF on .NET 5 (RC2 or newer).
Other XAML Improvements
We’ve also made other improvements for XAML developers. We consolidated XAML Hot Reload settings for desktop and Xamarin into a single location. We have also started enabling XAML Hot Reload for Xamarin.Forms developer targeting UWP. Last, we have added IntelliSense support for d:DataContext for MVVM scenarios and more.
Windows Forms Designer
We have improved performance in .NET 5 Windows Forms designer. The new architecture of the internal components significantly reduces memory allocations, which results in faster and more reliable designer work. The team has been working closely with third-party control vendors on the SDK for .NET 5 Windows Forms designer extensibility to allow control vendors to work with the new designer. Some of them already support .NET 5, but keep in mind others are coming soon!
Landing in Visual Studio 2019 v16.9 Preview 1
Git Productivity
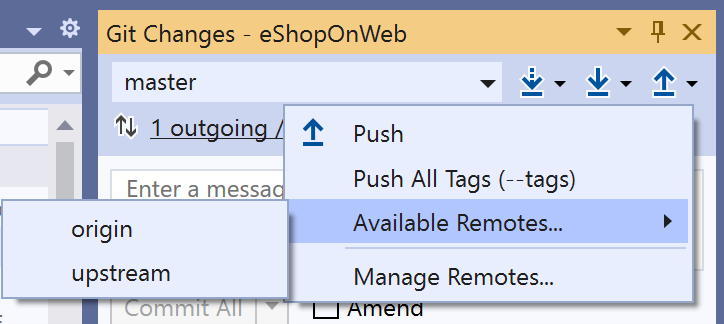
We’ve enhanced the Fetch, Pull, and Push action buttons in the Git Changes window. With the dropdowns, you can choose which remote you are targeting in the event you have multiple remotes for your repository. In the Push dropdown, you can also push all tags that you may have created locally.
.NET Core Debugging with WSL 2
Are you a .NET Core developer who loves working in Windows and Visual Studio, but needs to test your app in Linux? If so, the new .NET Core debugging in WSL 2 feature is something you will want to try out! It enables you to debug your code in WSL 2 using the Linux distro of your choice.
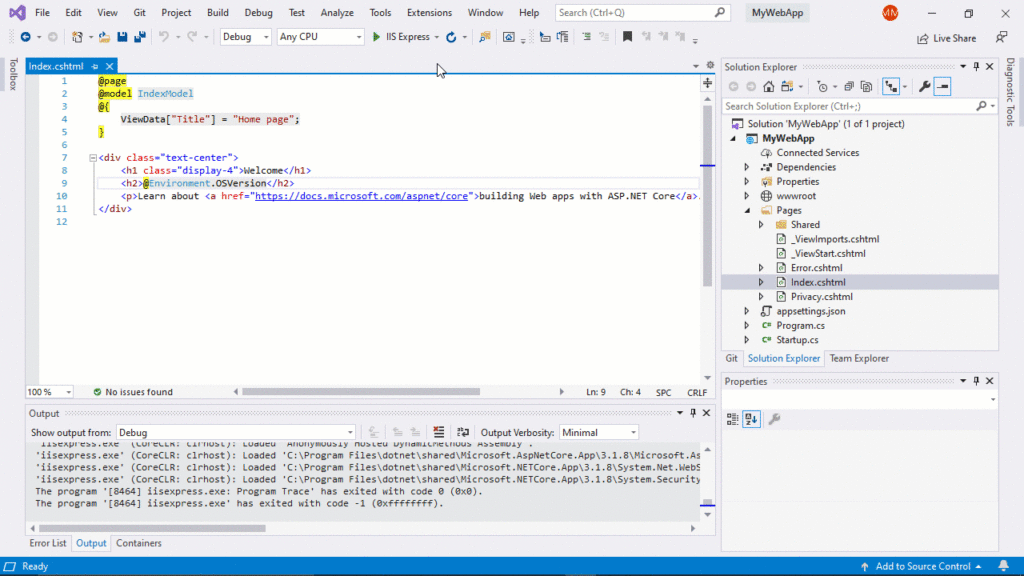
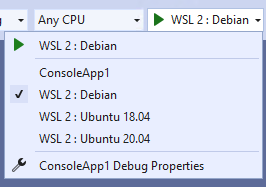
After installing WSL 2 and the distribution of your choice and opening an ASP.NET Core web app or .NET Core console app in Visual Studio, you’ll see a new Launch Profile named WSL 2.
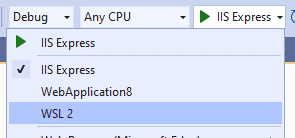
Selecting this profile will add it to your launchSettings.json. Once the new profile is selected, Visual Studio checks that your WSL 2 distribution is configured to run .NET Core apps, and helps you install any missing dependencies. As soon as all the dependencies are installed, you are ready to debug WSL 2. From here, you can start Debugging as normal, and your app will now be running in your default WSL 2 distribution. Check Environment.OSVersion to verify the correct distribution.
Note: Only Ubuntu and Debian have been tested and are currently supported. Other distributions supported by .NET Core should work but require manually installing the .NET Core Runtime and Curl.
By default, the WSL 2 launch profile will use the default distribution as set in wsl.exe, but you can modify your launch profile to include specific distributions. Adding extra functionality, you can also have multiple launch profiles. For instance, if you need to test your console app on Debian, Ubuntu 18.04, and Ubuntu 20.04, you could modify these settings.
Toggle Between Profiles
With these launch profiles, you can easily switch back and forth between your target distributions, all without leaving the comfort of Visual Studio.
.NET Productivity
Refactoring
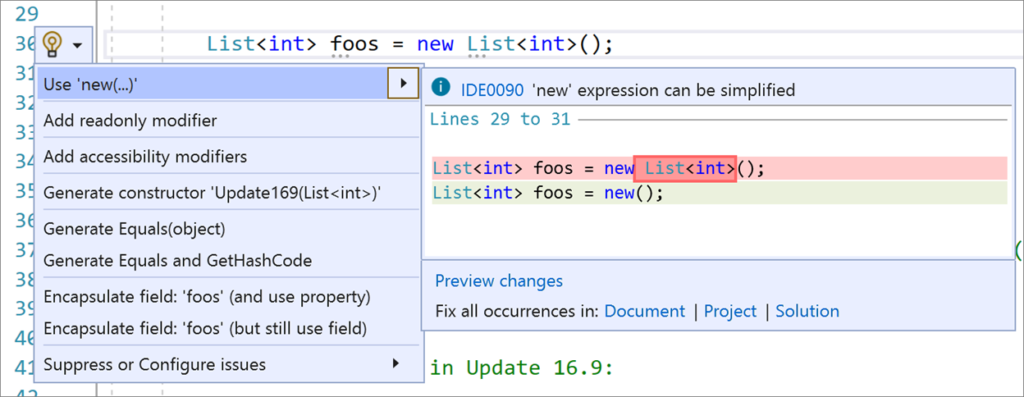
There is now a refactoring that suggests using ‘new(…)’ in non-contentious scenarios under the Quick Actions and Refactorings menu. Select Use ‘new(…)’ to give this a try.
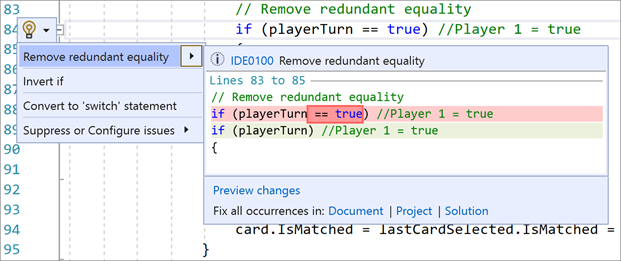
Additionally, from the same menu, there is a code fix that removes redundant equality expressions for both C# and Visual Basic. This is found under the Remove redundant equality menu choice.
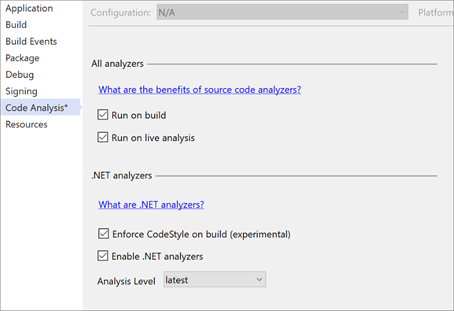
.NET Code Style (IDE) analyzers can now be enforced on build. You can either install the .NET Code Style analyzers as a NuGet package for C# and Visual Basic, or you can enable them in Project Properties. The Project Properties option can be found with a right-click on a project within Solution Explorer under Properties. From there, the Code Analysis tab gives you the option to select Enforce CodeStyle on build (experimental).
In 16.8 Preview 2 we added inline parameter name hints that inserts adornments for literals, cast literals, and object instantiations prior to each argument in function calls. In this release we added a couple more enhancement and customization options:
-
- Inline type hints for variables with inferred types and lambda parameter types.
- An option to disable inline parameter name hints when parameter names match the method’s intent and when parameter names differ only by suffix.
These options are found under Tools > Options > Text Editor > C# or Basic > Advanced. Select Display inline parameter name hints (experimental) to give this a try.
C++
We have implemented the More Constexpr Containers proposal, which allows destructors and new expressions to be constexpr. This paves the way for utilities like constexpr std::vector and std::string. Included in our implementation are compiler diagnostics for uses which trigger undefined behavior.
We are continuing our progress on Address Sanitizer support for MSVC on Windows with the following improvements in Visual Studio 16.9 Preview 1:
- Support for global C variables is now available in the MSVC linker
- __declspec(no_sanitize_address) support now available, making it possible to opt out of running the address sanitizer over specific variables or even entire functions.
In our earlier blog post on the C++ Team Blog, we called out an upcoming improvement to automatically link ASan libraries so that developers do not need to link them manually when creating an .EXE or .DLL from the command line.
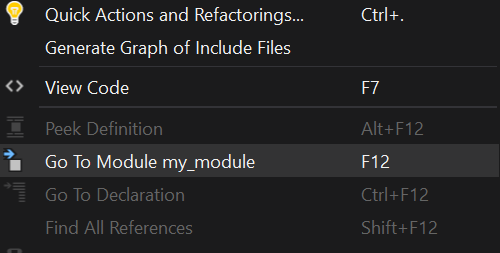
We are also continuing to work on additional IntelliSense support for C++20 modules. There is functionality for things you would expect such as Go To Definition, and member completion. You can also use the new Go To Module feature to navigate from an import statement to the relevant module interface. Keep in mind that IntelliSense doesn’t yet support most STL headers imported as header units.
Version 16.9: Our Next Servicing Baseline
When version 16.9 moves to the release channel later this year, it will be the fourth “servicing baseline” for Visual Studio 2019. Servicing baselines provide large organizations increased flexibility over when they can adopt the new features in minor version updates that are included in the Enterprise and Professional editions. Unlike standard minor version releases like 16.8 which receives servicing fixes only until the next minor update is released, we will offer fixes for servicing baselines for 12 months after the next servicing baseline is declared.
As 16.7 is the third servicing baseline, it will continue to receive servicing fixes for one year after version 16.9 releases. Full details can be found at Visual Studio Product Lifecycle and Servicing.
One Last Note
Once again, let me take a moment to express how much we appreciate your active involvement in our community. There is great energy in our team about the features coming out to offer better productivity and cloud integration. We hope you share our excitement and are waiting eagerly for your feedback on Developer Community. Until our next release, we wish you all the best.

Is “Enable .NET analyzers” different than the “Microsoft.CodeAnalysis.FxCopAnalyzers” package? Do I need both?
I really like the new Git experience and it is great to have local repositories listed. However, our .sln file lies outside of the Git folder (we are using CMake to generate everything in a build folder on a different hard drive). So when I open the local repository, VS closes the currently open solution and just shows the content of the build folder. When I then open the solution (from recent solutions), VS exits the just opened repository. So it is not possible to have the correct solution and repository selected at the same time and I also cannot...
I have a new laptop and I tried installing Visual Studio Community 2019.
After running installer, normally or as an admin its loads one bar in a sec and then it.
Since my device is new and windows are updated I dont know what could cause this issue.
VS Code installed without problems and I also installed other things which means issue is on your side.
Solved: I had error x8007002a, so I had to switch drives. Since I only have one I plugged in USB and sent the file.
From there I opened it as admin and it startded to...
Instead of add new functions in every new release (that may or may not be needed) you should resolve problems with the IDE (editor), that hurts productivity extremely since years now, like this:
https://developercommunity.visualstudio.com/content/problem/442808/razor-file-not-formatting-correctly-for-telerik-ke.html
MS has posted about 3 times, that it is solved in the newest VS version what simply is not true!
Is the inline type hints only available in Preview versions? I have 16.8 where inline parameter hints show up but not inline type hints. Thanks!
Please note that we have a known issue with WSL2 debugging in 16.9 Preview 1 when the application is targeting .NET 5.0. To fix this you will need to manually install .NET 5.0 using the instructions here
About Click Once Error In .NET 5.0
Description: A .NET application failed. Application: QMbackClient.exe Path: C:\Users\wf-so\AppData\Local\Apps\2.0\6R77A09D.QHE\XYJVD45Q.HEG\qmba..tion_0000000000000000_0001.0000_b8a995e444f4a1ee\QMbackClient.exe Message: Error: An assembly specified in the application dependencies manifest (QMbackClient.deps.json) was not found: package: 'PropertyChanged.Fody', version: '3.3.1' path: 'lib/netstandard2.0/PropertyChanged.dll'Nice. I'm interested in working with the latest VS2019 releases. However our factory only supports VS2019 revs 16.1.6 and 16.5.4. I am looking into ToolVersion, and possibly setting the Platform Toolset minor releases in projects and/or a properties file to allow VS16.8.1 to build using older toolsets when necessary. Is there a best practices for this? At the moment I'm working to set up "side by side" releases. However as I understand it, this shouldn't be required.
My understanding is that MSBuild is decoupled from the IDE, so given the correct parameters I should...
well, presenting some content that came to be observed in the IDE, something like BrainStorm?
Inline Parameter Name + Hints;
as far understood :: Method overload are used in such way to avoid inventing names for code variations and avoiding of parameter data checking;
using parameter names in the first parameter in ways to force the use of a specific overload[?]
<code>
this situation came to be in which same parameters cannot be used or params in which cannot be named;
the organization with only params which where beautifully organized(tested), but data checking could be avoided with overloads;
External XML...
Hi,
Microsoft.VisualStudio.TemplateWizard assembly disappeared from the system. Is it designed?
12>C:\Program Files (x86)\Microsoft Visual Studio\2019\Enterprise\MSBuild\Current\Bin\Microsoft.Common.CurrentVersion.targets(2123,5): warning MSB3245: Could not resolve this reference. Could not locate the assembly “Microsoft.VisualStudio.TemplateWizardInterface, Version=8.0.0.0, Culture=neutral, PublicKeyToken=b03f5f7f11d50a3a, processorArchitecture=MSIL”. Check to make sure the assembly exists on disk. If this reference is required by your code, you may get compilation errors.
And later we got the compilation error. Yesterday our build was OK.