Today we are excited to announce the release of Visual Studio 2019 version 16.7 and Visual Studio 2019 version 16.8 Preview 1. Each of these releases have features we have been working hard to deliver. Install version 16.7 to start using our highlight improvements. Included in this list are Git integration including a new merge editor and easy conflict resolution, WPF design-time data, C++ support for 64-bit projects and debug builds, and additional IntelliSense functionality. In addition, Visual Studio 2019 v16.7 is our next long-term servicing release. In conjunction, we are releasing Visual Studio 2019 v16.8 Preview 1 which you can install from our download site. Our Preview version brings you pre-release functionality of the Git Repository window for easier navigation and more uses for the Quick Actions and Refactoring menu. We’ve provided additional highlights of what’s new below, yet additional information can be found in our release notes.
As always, we love to hear your feedback. Developer Community is the best venue to share your experiences so we can continue to learn how these features impact your work, both positively and negatively. Through this portal, we can have more in-depth conversation around future features.
New in Visual Studio 2019 v16.7
Git Integration
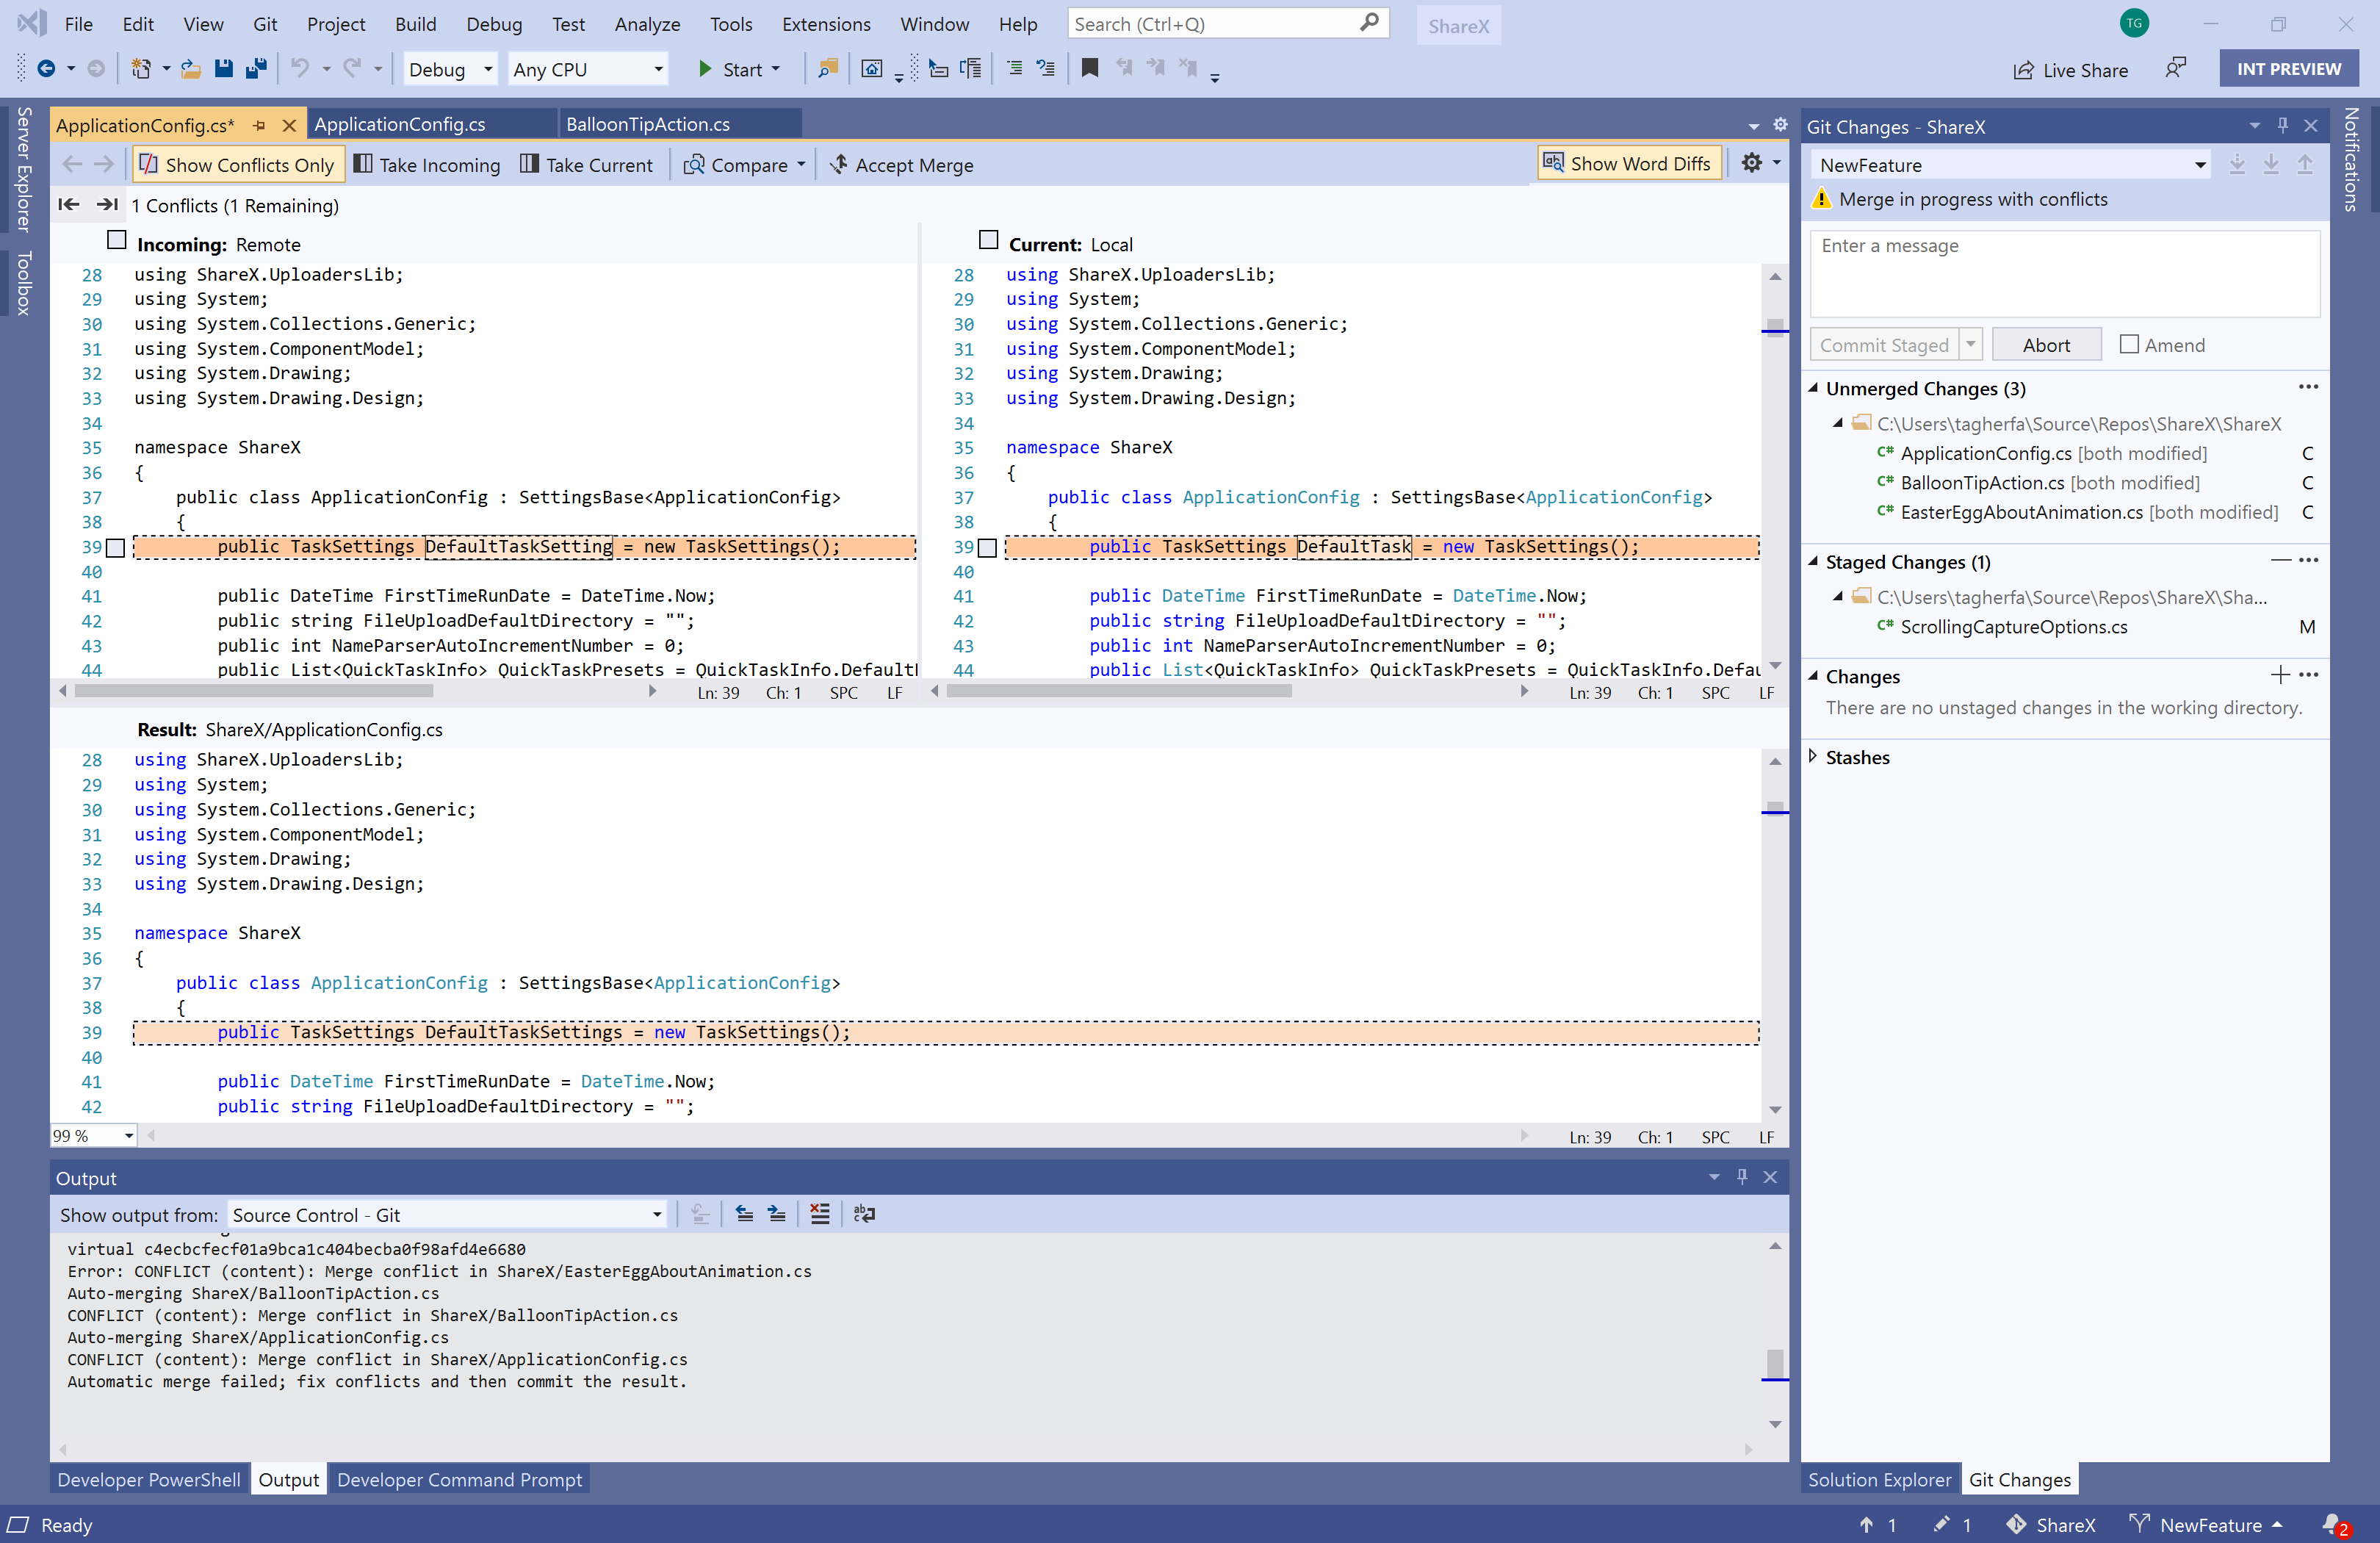
We’ve revamped the Visual Studio merge editor by decoupling it from Team Foundation Version Control and focusing it on Git. A new gold info bar at the top of a file will tell you when there are merge conflicts needing manual resolution.

Git Conflict Resolution
We have also added a checkbox to resolve all conflicts on one side or the other with a single click.
Git Repository Window
To give you a complete full-screen experience to focus on dedicated Git activities, we built the new Git Repository window. From here you can view and manage all the local, remote, and upstream branches in your repository. You can also switch between branches and view the history graph of each branch. Double clicking on a commit will give you more details about it.
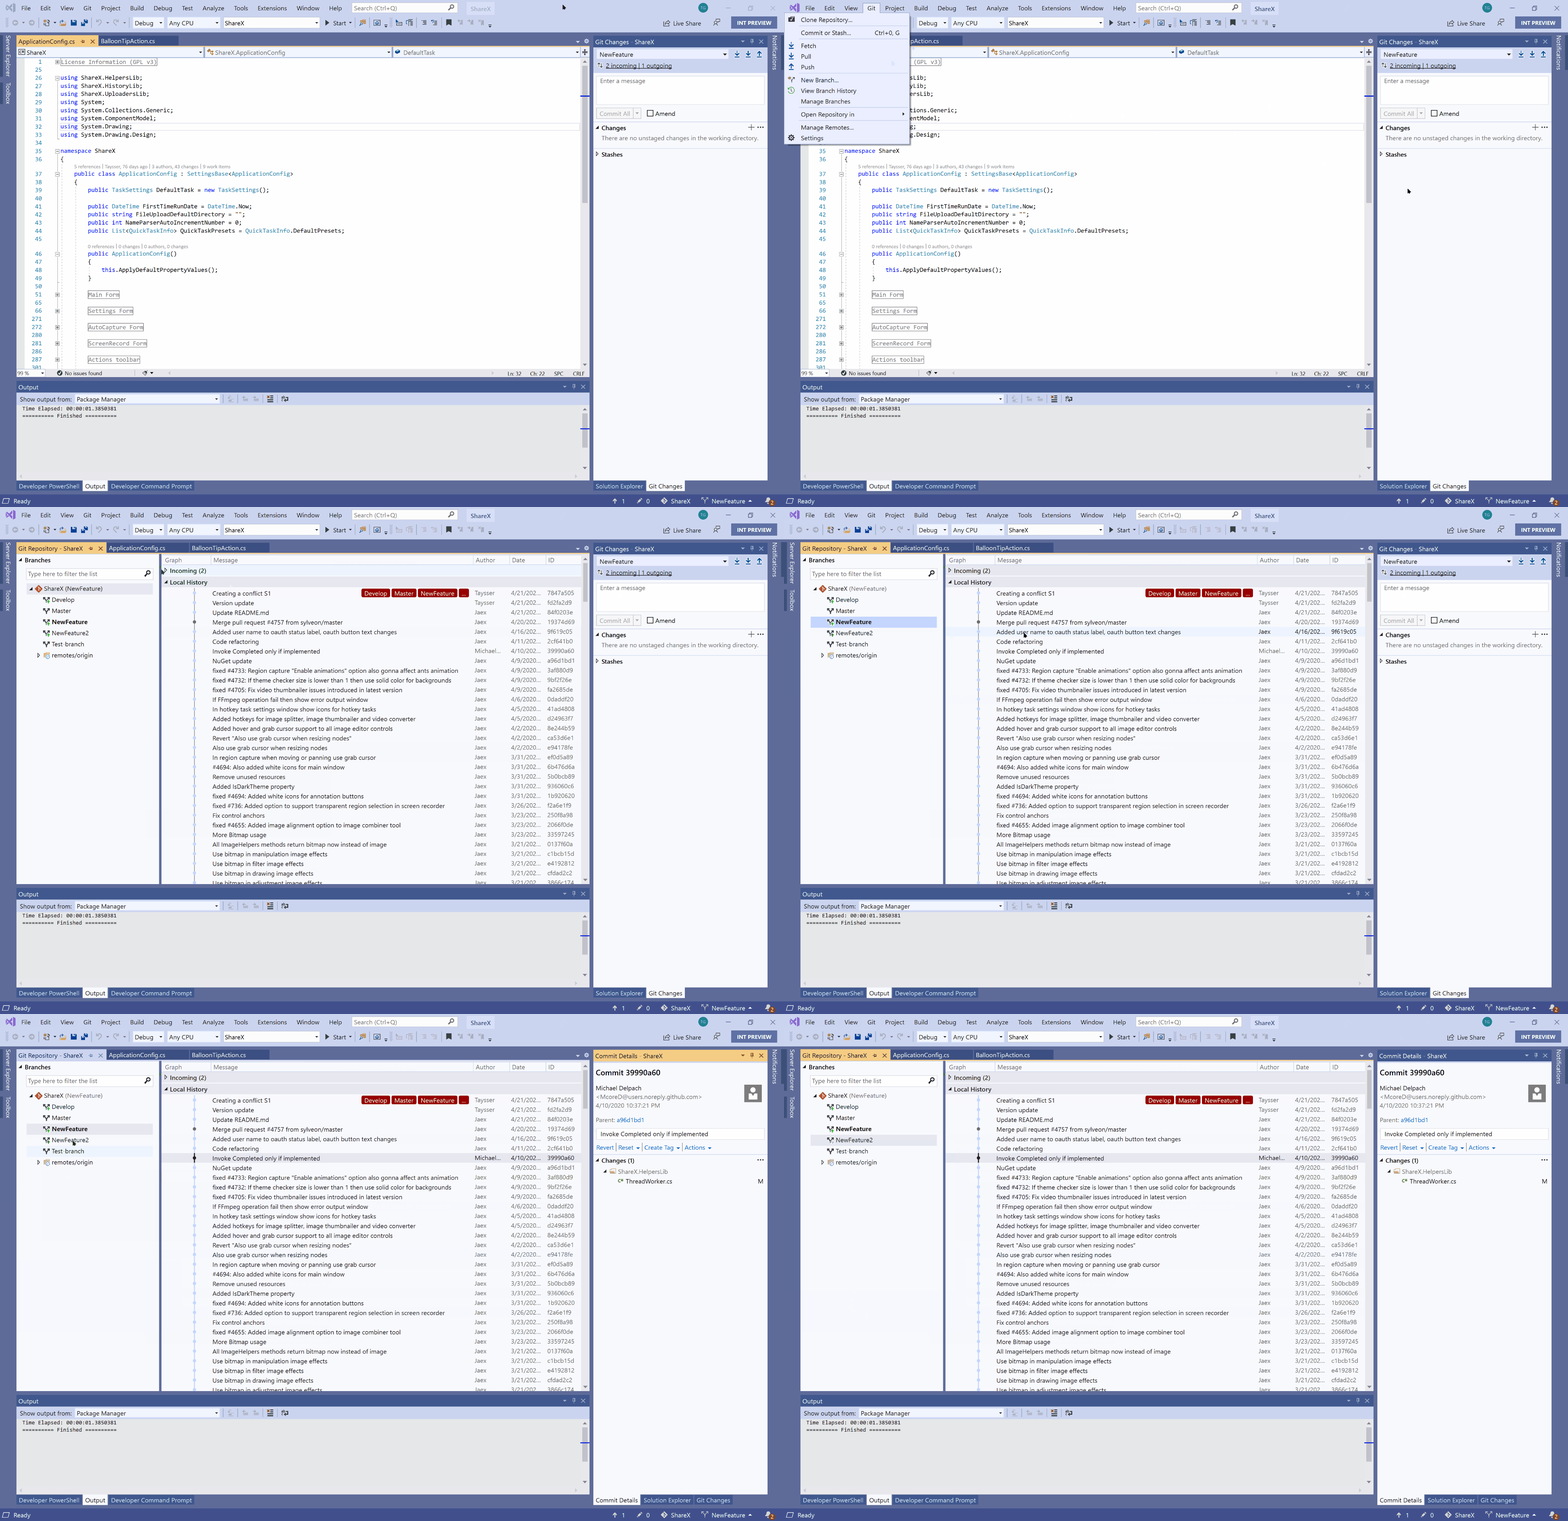
If you would like to learn more about these improvements, check out the detailed Git blog post.
XAML Tools WPF/UWP
Coming from our WPF and UWP tooling team are a few important improvements.
Design-time Data
First of all, comes design-time data. Before this feature improvement, when adding new controls that are empty or working with controls that get populated with data via data binding at run time, it was hard to see how the end result would look during the design-time experience. That would get especially inconvenient if data binding or the data source didn’t yet exist. We wanted to give you a way to see your controls filled with data during the design-time development. That’s why we are introducing a new feature called design-time data. Now, for each XAML property for built-in controls, you can easily set a value visible only in the designer and not compiled into your binaries. To use this functionality, simply put a d: in front of the property you want to mock, and the designer will do the rest.

This will allow you to see the values from the properties with d: in the designer. When your application is running, it will have values specified in the same properties without d:. This technique works for WPF .NET Core and UWP projects for all built-in controls that come with the frameworks. In the future, we are look to add support for third-party and improved custom control improvements.
XAML Designer Refresh Button
Next, we introduce the XAML Designer Refresh Button. You no longer need to close and re-open the designer view to resolve rendering issues. You can simply press the refresh button located in the bottom-left icon near the zoom level indicator.

XAML Code Editor
Finally, the XAML code editor shows color icons next to the color code for WPF. NET Core, WPF .NET Frame work and Xamarin.Forms projects.

C++
Address Sanitizer
AddressSanitizer is an invaluable tool for finding memory corruption bugs. It has been available for 32-bit x86 projects on Windows since Visual Studio 2019 version 16.4. We have now added support for both 64-bit projects and debug builds! Read our initial announcement post to learn how to enable it for your code.

For those doing remote development on Linux targets, we’ve made a host of improvements.
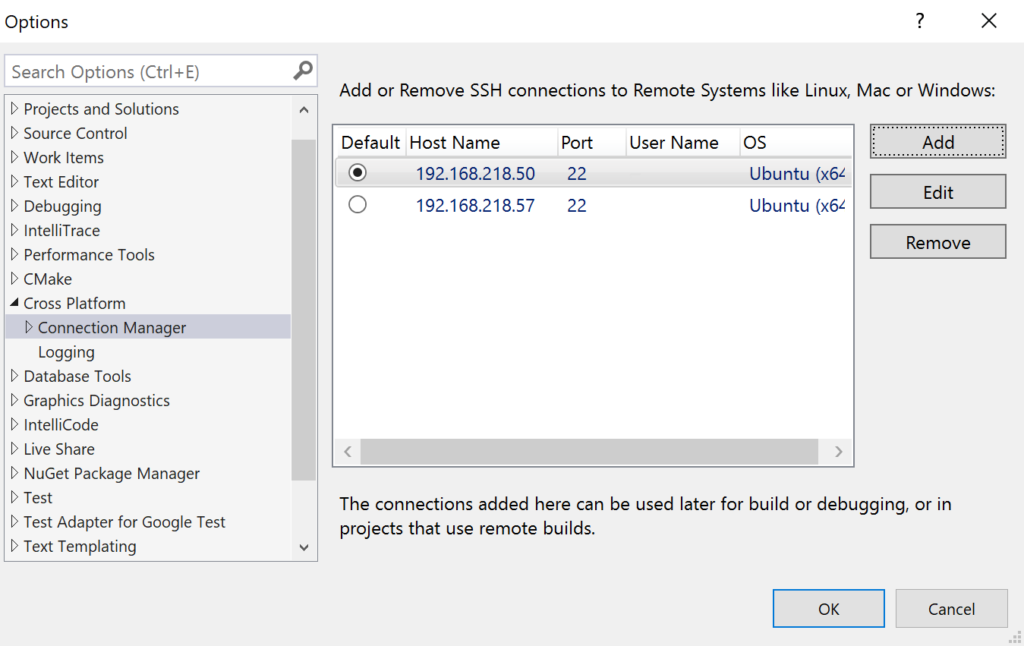
Edit and Set Default Remote SSH Connections
You can now edit and set default remote SSH connections in the Connection Manager. This means you can edit an existing remote connection (e.g. if its IP address changed) and set default connections to be consumed in CMakeSettings.json and launch.vs.json.
Extended Support for Debugging CMake Projects and Linux Distributions and Shells
We’ve added first-class support for debugging CMake projects on remote systems with gdbserver. It is especially useful in embedded scenarios where your target system may not have the resources to run gdb.
We’ve also extended our support for different Linux distributions and shells. For example, you can now set the default shell to zsh using ConnectionManager.exe by setting the new “shell” property.
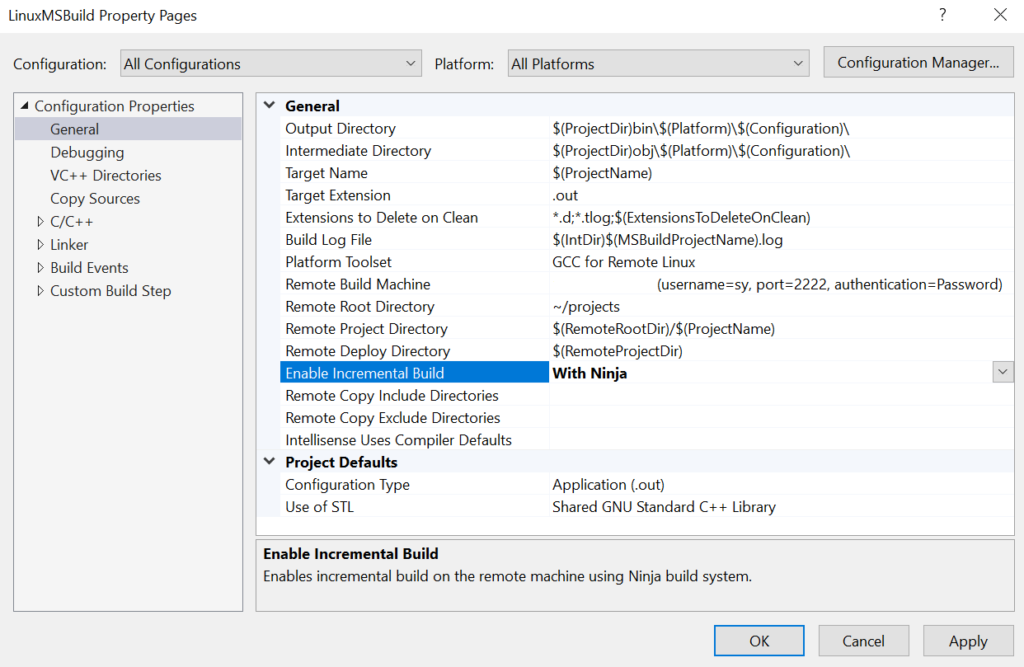
If you are using MSBuild to build your Linux applications, you can now use Ninja to speed up your incremental builds. You can opt into this feature by setting Enable Incremental Build to With Ninja in the General Property Page.
We’ve implemented a wide range of C++20 features in our STL implementation. Some examples are std::bit_cast, constexpr std::array comparisons, and partial support for Ranges. You can find the full list on our STL Changelog.
C++ IntelliSense has been expanded with initial support for some C++20 features like Concepts and designated initializers.
If you’re using our experimental C++20 modules support, .cppm and .ixx files will be recognized as C++ and treated as such by the colorizer and IntelliSense.
.NET Productivity
IntelliSense Update
There is now IntelliSense completion in DateTime and TimeSpan string literals. Place your caret inside the DateTime or TimeSpan string literal and press (Ctrl + Space). You will then see completion options and an explanation as to what each character means. Both the date time format and an example will be provided.

IntelliCode Update
AI-assisted argument completions
For C# developers, in addition to providing member suggestions, IntelliCode also provides AI-assisted IntelliSense argument completion. This capability stars the most likely argument names that you’ll use when you call a method and places those suggestions at the top of the completion list. The completion list appears when you start typing inside the parentheses or press Ctrl+Space, Space, or Ctrl + J).
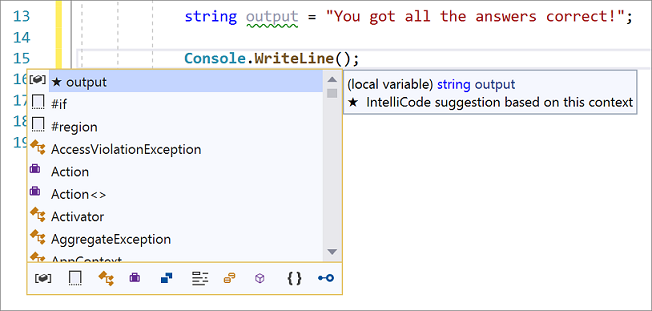
IntelliCode suggestions
IntelliCode suggestions assists you when making similar edits in multiple places in your code. For C# developers, it tracks your edits locally, and detects repetition. It then offers to apply those same edits in other places where they might apply. For example, if you have missed locations where a refactoring could be applied, IntelliCode suggestions helps you find those locations and fix them.
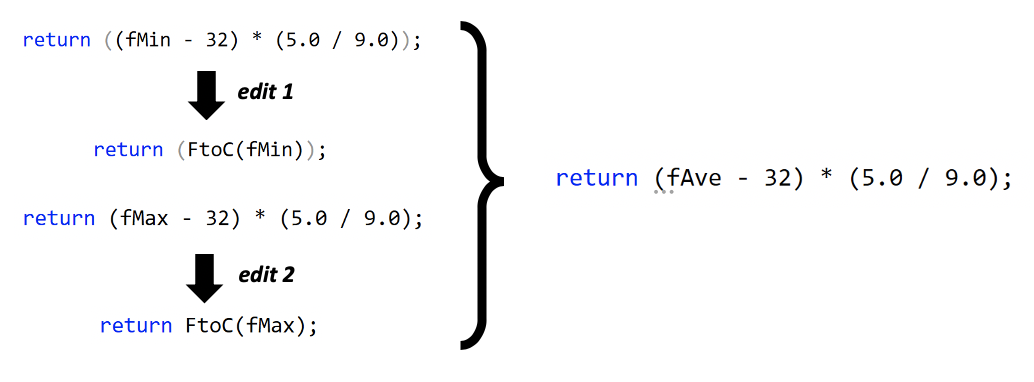
Suggestions appear as Quick Actions in Visual Studio editor. IntelliCode suggestions have the Quick Action menu options Apply suggestion and Ignore suggestions like this. If you want to use the suggested change, select Apply suggestion.

IntelliCode inferred EditorConfig
EditorConfig files help to keep your code consistent by defining code styles and formats. These conventions allow Visual Studio to offer automatic style and format fixes to clean up your document. For C# developers, you can now use IntelliCode to infer your code style and formatting conventions to dynamically create an EditorConfig file.
You can add an IntelliCode-generated EditorConfig file at the project or solution level in Visual Studio (or to a solution folder). To add a prepopulated EditorConfig file, right-click on the desired location in Solution Explorer and choose Add > New EditorConfig (IntelliCode)
Quick Actions and Refactorings Menu Update
You can now add a parameter within the Change Signature dialog. Place your caret at the declaration or usage of a method. Press (Ctrl+.) to trigger the Quick Actions and Refactorings menu. Select Change signature. Within the Change Signature dialog select Add to add a parameter.
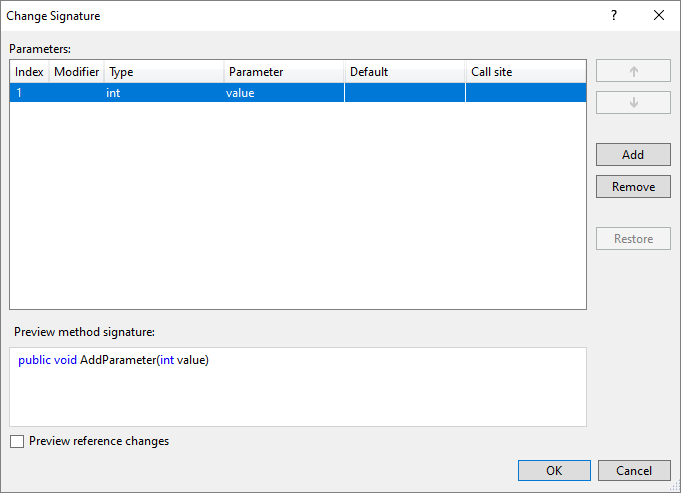
Add Parameter
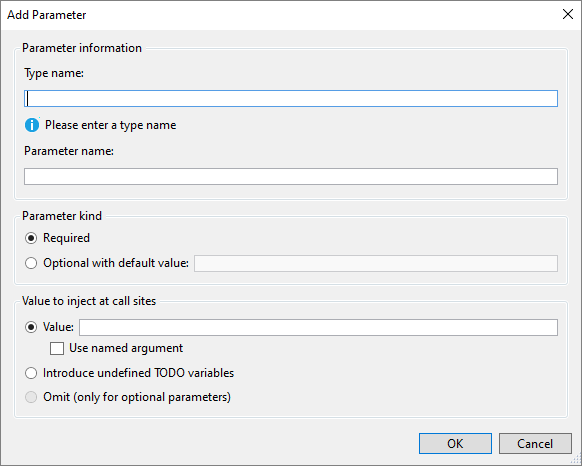
Once you select Add, the new Add Parameter dialog will open. The Add Parameter dialog allows you to add a type name and a parameter name. You can choose to make the parameter required or optional with a default value. You can then add a value at the call site and choose a named argument for that value or you can introduce a TODO variable. The TODO variable puts a TODO in your code so you can visit each error and go through each call site independently and decide what to pass. For optional parameters you have the option to omit the call site completely.
There is now a warning and code fix when a suppression operator is present but has no effect. A second code fix suggesting the correct negating expression is also available. Place your caret on the suppression operator. Press (Ctrl+.) to trigger the Quick Actions and Refactorings menu. Next, select from one of the following:
To remove the operator completely, select Remove operator (preserves semantics).
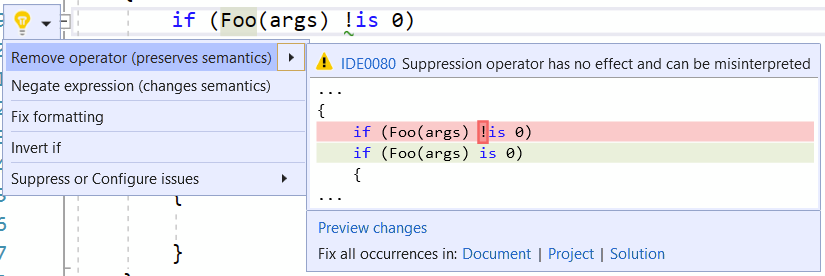
To negate the expression, select Negate expression (change semantics).

You can also negate the expression with the new C# 9 not pattern if it is available in your project.

Add a Debugger Display Attribute
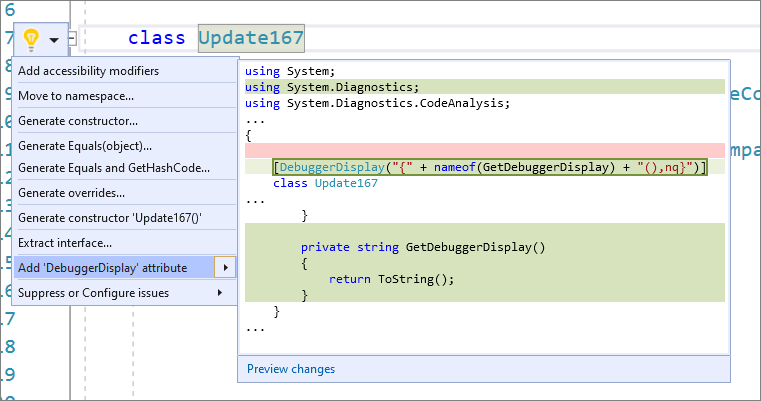
There is now a quick action to add a debugger display attribute to a class. This allows you to pin properties within the debugger programmatically in your code. Place your caret on the class name. Press (Ctrl+.) to trigger the Quick Actions and Refactorings menu. Select Add ‘DebuggerDisplay` attribute. This will add the debugger display attribute to the top of your class and generate an auto method that returns ToString() which you can edit to return the property value you want pinned in the debugger.
Profiler
In Visual Studio 2019 version 16.7, we have added a new .NET Performance Counters tool the profiler to help you visualize and analyze dotnet counters. Dotnet counters are high level performance metrics such as cpu usage or exception count, that give you insights into how your application is performing. By looking at these metrics, you will be able to more quickly diagnose the type of performance bottleneck your application is facing. To run this tool, select Debug -> Performance Profiler -> Checkmark .NET Performance Counters within Visual Studio.
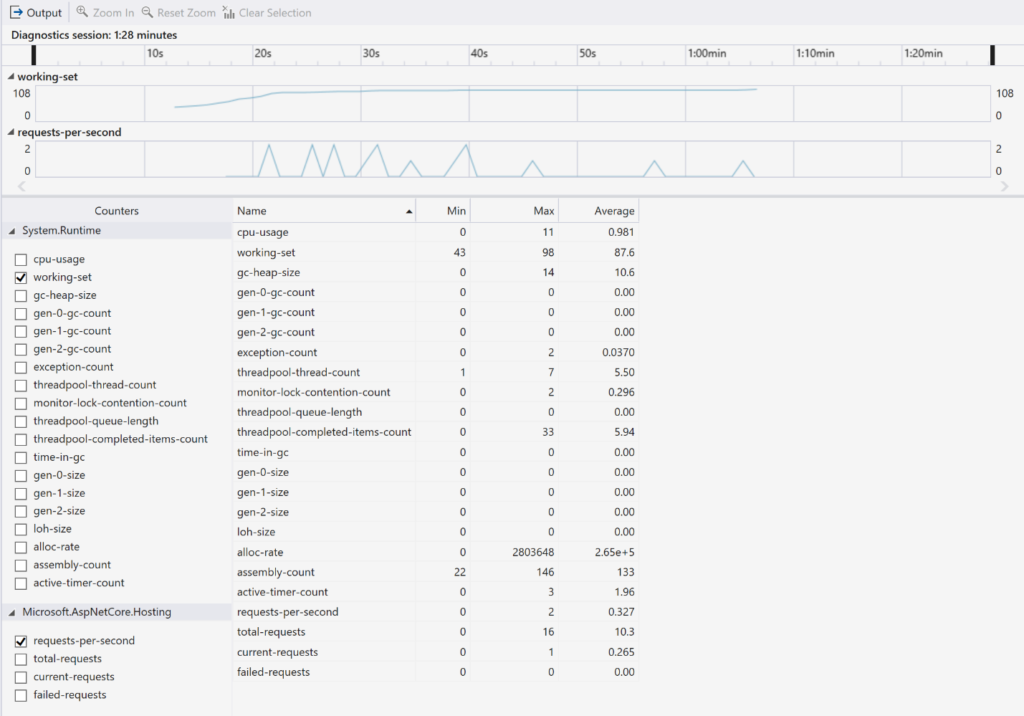
We heard feedback from you that getting and studying the performance counters was cumbersome using the command line so now you will be able to see the counters right from within Visual Studio. Furthermore, in addition to seeing the value of the counters in a table like you were previously you can see the values of counters in graphs. This should highlight trends in how a particular counter’s value changes over time which were difficult to visualize before.
Extended support for Visual Studio 2019 version 16.7
Visual Studio 2019 version 16.7 is the third supported servicing baseline for Visual Studio 2019. Consequently, Enterprise and Professional customers needing to adopt a long term stable and secure development environment are encouraged to standardize on this version. As explained in more detail in our lifecycle and support policy, version 16.7 will be supported with fixes and security updates for one year after the release of the next servicing baseline.
Now that version 16.7 is available, version 16.4, our last released servicing baseline, will be supported for an additional year and will go out of support in October 2021. Prior minor versions 16.0, 16.1, 16.2, 16.5 and 16.6 are no longer under support. These intermediary releases received servicing fixes only until the next minor update was released.
You can acquire the latest most secure version of Visual Studio 2019 version 16.7 in the downloads tab of the Subscriptions portal. For more information about Visual Studio supported baselines, please review the support policy for Visual Studio 2019.
New in Visual Studio 2019 v16.8 Preview 1
Git Integration
Easier Navigation Through the Git Repository Window
Since we’ve first released it, we’ve made several modifications to the Git Repository window to more easily navigate through it. Use the View menu or the keyboard chord Ctrl+0, Ctrl+S to quickly open the window. And customize the history view through a new tool bar with filters. You can also search for commits in the branch history using the search box. If you want to update the branch with the latest commits, you can use the new Fetch, Pull, and Push commands in the incoming and outgoing commits
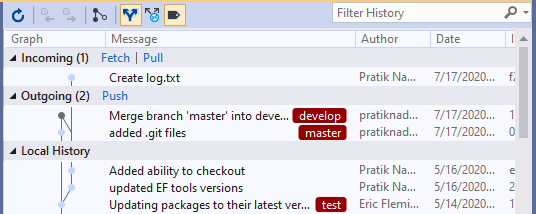
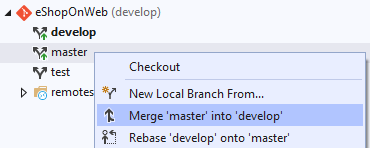
If you right click on a branch in the list to merge or rebase, you’ll see branch names clearly indicated to help you determine which direction you are merging or rebasing.
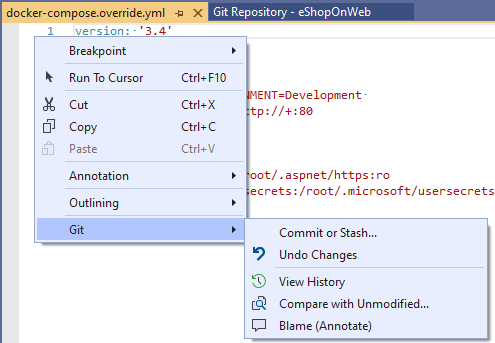
If you want to access Git commands without leaving your code, you can now do that straight through the right-click context menu in Solution Explorer as well as in a file in the Editor.
And after pushing a commit to your remote origin, the Git Changes window prompts you with a link to create a Pull Request to merge your changes.

New Progress Dialog
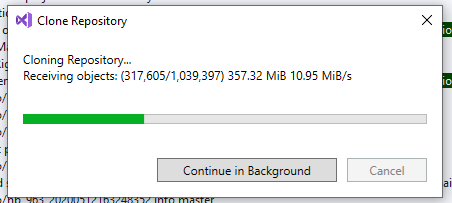
When you clone a repository through Visual Studio, you’ll see progress clearly indicated through the new progress dialog. You have the option to move the process to the background in case you want to do something else in the IDE while you wait for the clone to complete. In that case, you will continue to see progress in the Task Status Center. The repository will automatically open in Visual Studio after clone has completed.
C++
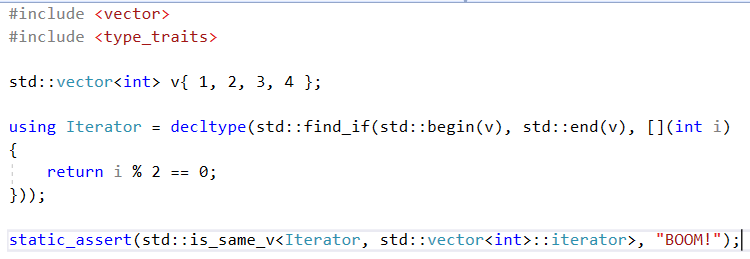
We have added compiler support for lambdas in unevaluated contexts which allows you to use lambdas in decltype specifiers
.NET Productivity
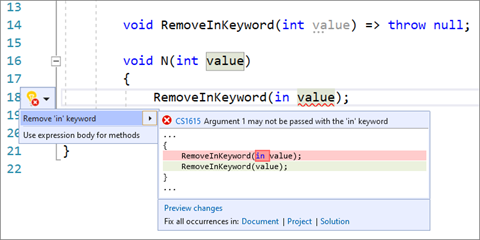
There is now a code fix to remove the `in` keyword where the argument should not be passed by reference. Place your cursor on the error. Press (Ctrl+.) to trigger the Quick Actions and Refactorings menu. Select Remove ‘in’ keyword.
New Pattern Matching
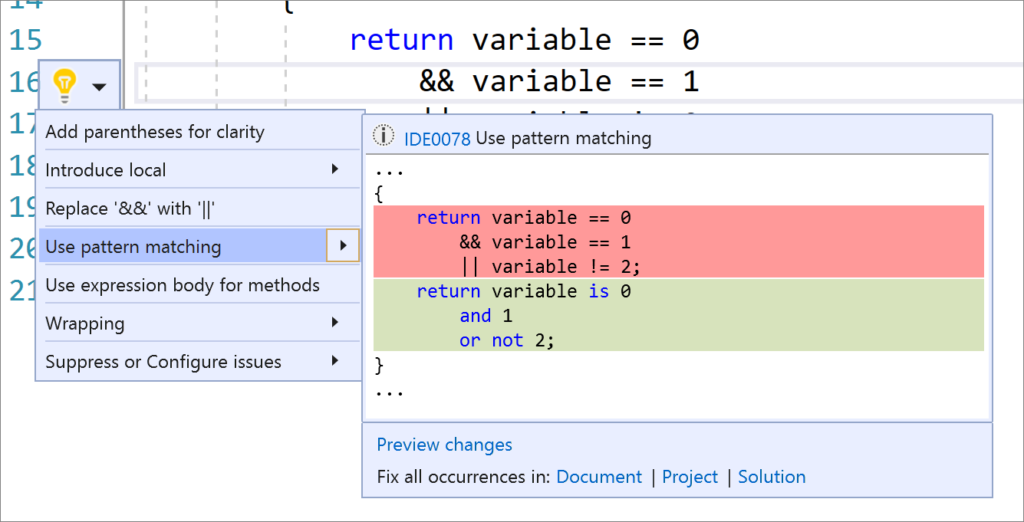
There is now a refactoring that introduces the new C#9 pattern combinators. Along with the pattern matching suggestions such as converting ‘==’ to use ‘is’ where applicable, this code fix also suggests the pattern combinators `and`, `or` and `not` when matching multiple different patterns and negating. Place your cursor inside the statement. Press (Ctrl+.) to trigger the Quick Actions and Refactorings menu. Select Use pattern matching.
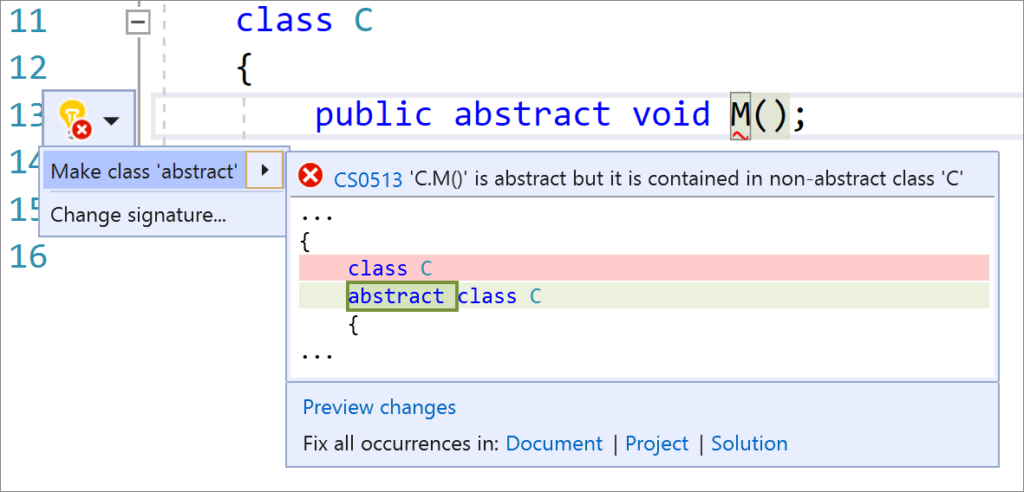
There is now a code fix to make a class abstract when you are trying to write an abstract method in a class that is not abstract. Place your cursor on the error. Press (Ctrl+.) to trigger the Quick Actions and Refactorings menu. Select Make class ‘abstract’.
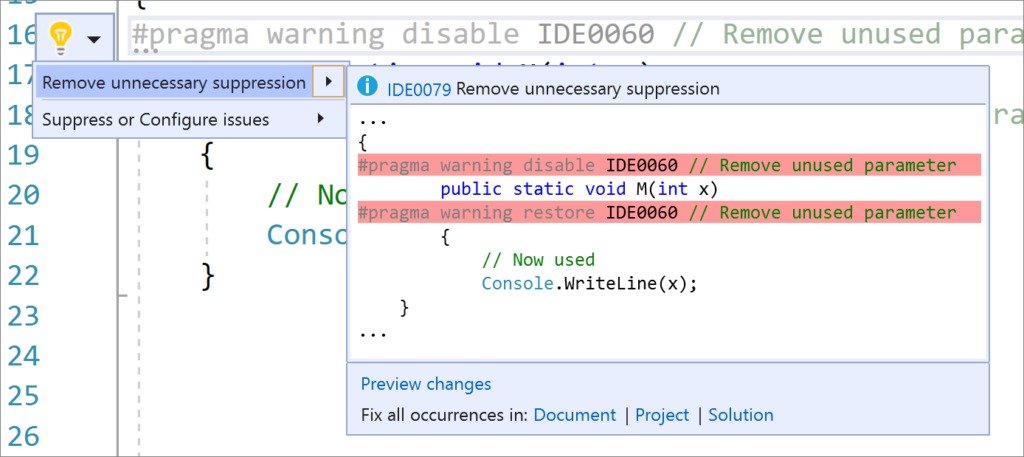
Remove Unnecessary Pragma Suppressions
There is now a code fix to remove unnecessary pragma suppressions and SuppressMessageAttributes. Place your cursor on the pragma warning or the SuppressMessageAttribute. Press (Ctrl+.) to trigger the Quick Actions and Refactorings menu. Select Remove unnecessary suppression.
Let us know what you think!
Thank you for the constant vibrancy you bring to the world’s community of software development. Once again, as you try out our newest features, we would love to hear your feedback on Developer Community.

I update my visual studio 2019 version 16.7.2 To 16.7.3 today.
when debugging Blazor Client assembly Windows blue Screen appears. (DPC_WATCHDOG_Violation)
I debug the same project yesterday for hundreds of times with no problem.
-------------------------------------------
DPC_WATCHDOG_VIOLATION (133)
The DPC watchdog detected a prolonged run time at an IRQL of DISPATCH_LEVEL
or above.
Arguments:
Arg1: 0000000000000000, A single DPC or ISR exceeded its time allotment. The offending
component can usually be identified with a stack trace.
Arg2: 0000000000000501, The DPC time count (in ticks).
Arg3: 0000000000000500, The DPC time allotment (in ticks).
Arg4: fffff80461171358, cast to nt!DPC_WATCHDOG_GLOBAL_TRIAGE_BLOCK, which contains
additional information...
The current version of Git is 2.28. Which version of Git is VS2019 16.7.2 using? Does Visual Studio use the locally installed version of Git??
Thanks
Hey James – In 16.7 we’re using MinGit 2.25. And we’ve moved to MinGit 2.28 for 16.8. We don’t use the locally installed version, just to ensure nothing in VS breaks if you update or remove your local installation of Git.
Yeah, IntelliSense is as broken as it gets, has been this way for several VS2019 updates. Rather than auto-complete obvious identifiers when you Ctrl+Space, it now litigates with every possible combination of letters even if you already typed the first several characters of the exact identifier you want. It paralyzes you with choice, seemingly on purpose.
Rather than fix it, they add more Big Brother nonsense that nobody asked for and nobody wants. Fake customer consensus. I'm not fooled.
NEGATIVE on AI-assisted IntelliSense. Turn it off, turn it off. I don't need your machines spying on my work to see if I'm...
Where can we report C++ compiler and MSBuild related issues with this particular release? (16.7)
There is code that was working prior to 16.7 has now stopped compiling (refer: https://github.com/ThePhD/sol2/issues/1008) and for some reason, MSBuild is not invoking fxc.exe (DirectX shader compiler) in 16.7. (refer: https://github.com/sdslabs/Rootex/pull/236/checks?check_run_id=1042684225#step:4:2622)
While I understand the need for change I accept that but what I dont accept is the fact that you have taken away the commit option from the solution explorer But I here enough of us have complained and that it will be coming back in a next release it interrupts my work flow having to go to yet another window !!! just to commit my changes.
Try publishing a website from 16.8 P1 it’s very hard when the publish button doesn’t exist.
Has stopped me rolling out a major update. I understand it is a preview version but this is a basic error and should not have been released.
Are you referring to pushing a new repo to Azure DevOps or something else?
The design time data feature is awesome! Unfortunately, we have many custom controls in our project and it doesn’t work for properties on those controls. Is there any way to make this feature work for dependency properties on custom controls?
I have two remote repositories for a project and I can’t seem to find how to choose which one to push to. What am I missing?
Don’t worry it’s not you, the experience itself is still missing that capability. We’re designing it now. You can upvote and follow for updates here – https://developercommunity.visualstudio.com/idea/1052042/new-git-experience-select-remote-to-push-to-when-h.html
There is a good start point to open a solution from “Solutions” section in “Team Explorer – Home” view currently. As far as I see there is no such functionality in the new Git experience. Will it be available in the release version of the new UI?
We’re working on that experience now and plan to have the Solution list in the Solution Explorer when the new UI is released. You can track it here – https://developercommunity.visualstudio.com/idea/991502/team-explorer-or-new-git-panel-is-not-showing-the-3.html
Nothing about the most voted issues to restore the old new project dialog and the old start page in order to make Visual Studio 2019 useable.