
We are excited to announce the release of Visual Studio v16.10 preview 2. This release continues a theme of developer productivity and convenience. We’ve added C++20 ranges, IntelliSense completions, margin icons for inspecting the inheritance chain, and new features for testing, Docker tooling enhancements, and Git integration!
Download the latest Visual Studio preview release to try the new features in 16.10. And as always, we love your feedback and interactions through our Developer Community.
New Features for C++
We’ve continued to add C++ 20 conformance features, as well as support for CMake preset files, and improved security for remote connections.
Use Ranges in C++ 20
We are delighted to announce that our C++20 Ranges implementation is now feature complete. Compile with /std:c++latest if you want to try it out.
Use CMake Presets
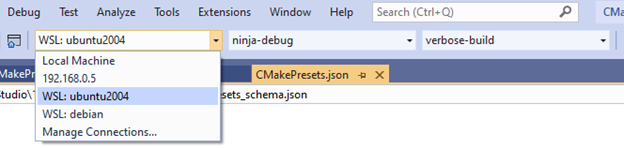
The CMakePresets.json file is now supported in Visual Studio as a common alternative to CMakeSetting.json.
CMake 3.19 and 3.20 added support for CMakePresets.json, which allows you to specify common configure, build, and test options, and share them with others. Use the same CMakePresets.json file to configure and build with CMake in Visual Studio, Visual Studio Code, and from the CLI on Windows, Linux, and macOS. The three dropdowns in the screenshot below indicate the active Target System, Configure Preset, and Build Preset.
Customized Warning Levels for External Headers
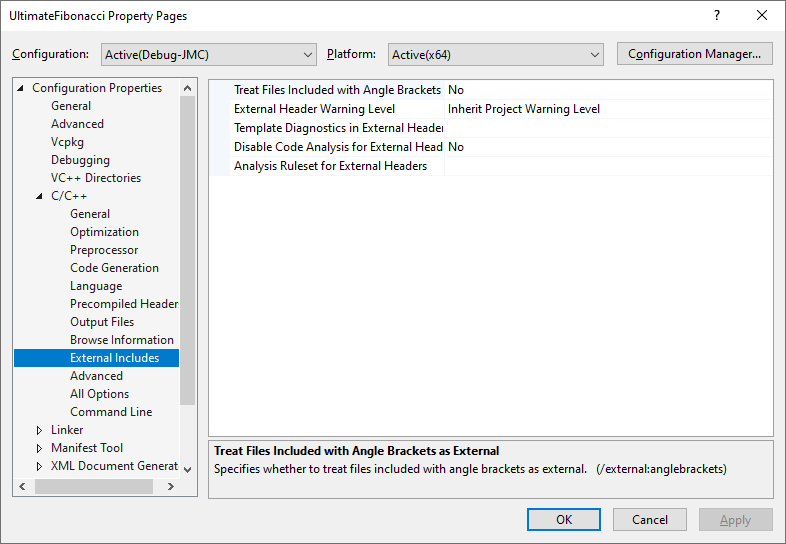
Compiler and code analysis warnings for headers that are not part of your project are frustrating. To help with this, we’ve made it easy to mark headers external to your project. External headers can have their own compiler warning level, code analysis, and template diagnostics settings. You can choose stricter settings for your project’s code to enforce code quality without getting bogged down with warnings from headers you don’t control.
Safely Connect Remotely
We’ve made creating remote connections safer by adding a prompt to accept or deny the host key fingerprint presented by the server. You may be familiar with this if you’ve used the OpenSSH command-line client or PuTTY before.
New Features for .NET
IntelliSense has several new completions that help automate common workflow tasks.
Completions for Casts, Indexers, and Operators
IntelliSense now offers completions for casts, indexers, and operators. Look for these new options in the standard completions list.
Automatically Insert Method Call Arguments
There is now a completion option that automatically inserts arguments when writing a method call.
This feature is off by default so you will need to enable it in Tools > Options > Text Editor > C# > IntelliSense and select Tab twice to insert arguments (experimental).
To use this feature, start writing a method call and press tab twice (tab+tab). Notice that the method call includes arguments based on the method’s default values. Use parameter info to cycle through the list of arguments that you would like inserted by pressing the up and down arrow keys. Start typing an argument to bring up the IntelliSense completion list and type semicolon, which will commit the argument and add a semicolon to the end of the method call.
User Interface for EditorConfig Files
EditorConfig now has a user interface.
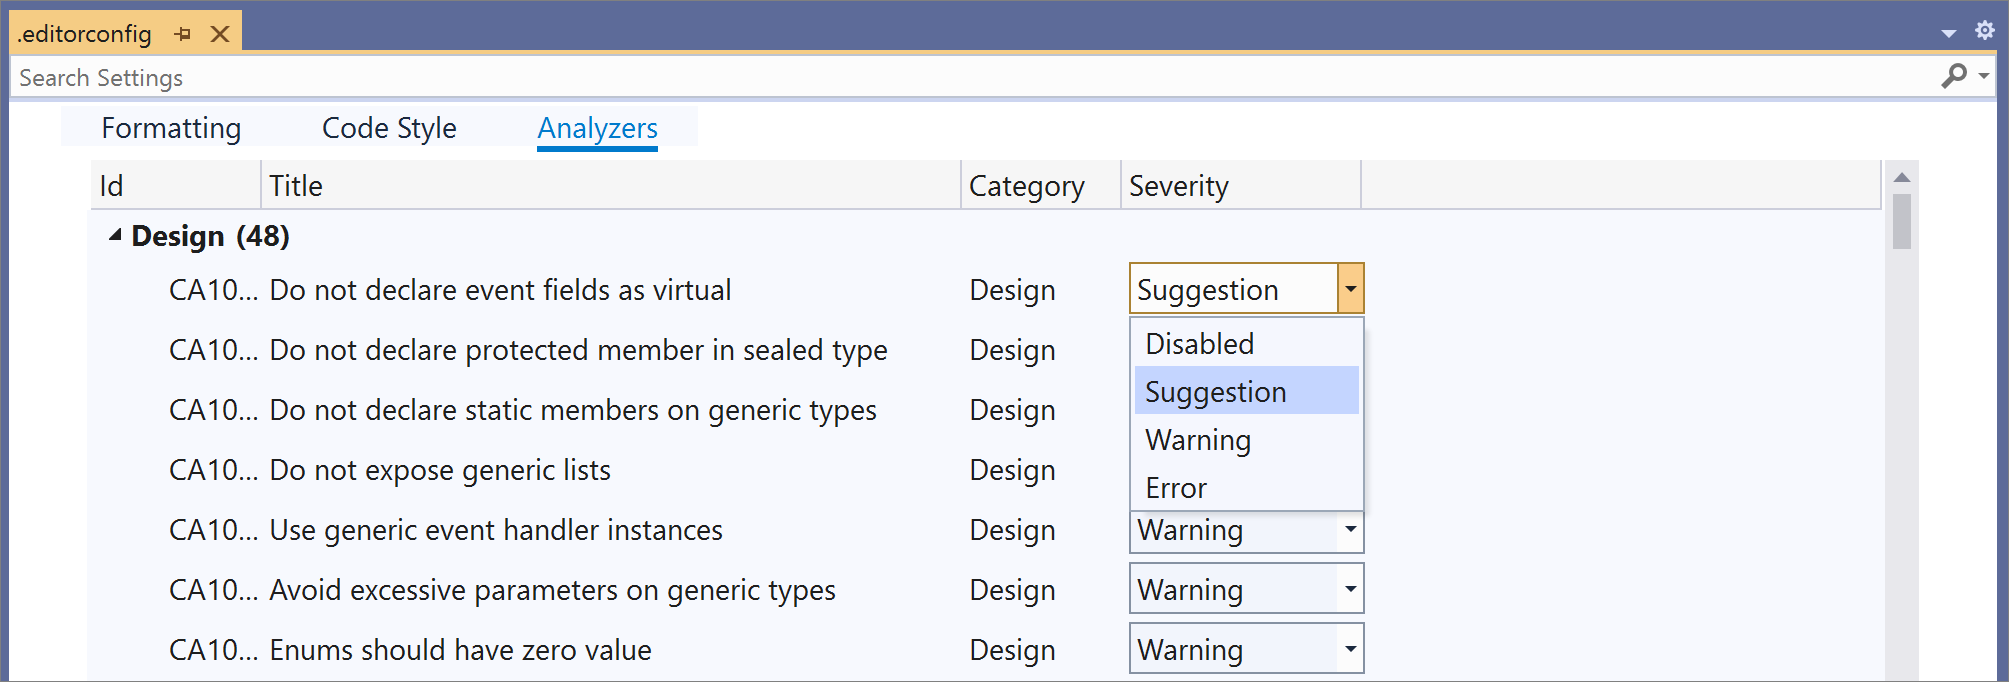
Open any .NET EditorConfig file from your solution. Notice that the new UI will automatically open and display code style and code quality configuration options for both C# and Visual Basic.
Visualize Inheritance Chains
There is now a visual representation for navigating and inspecting the inheritance chain.
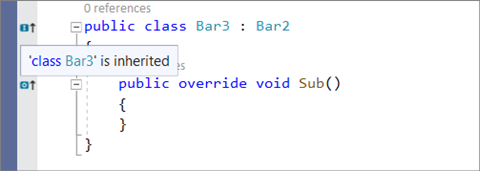
This option is off by default so you will need to turn it on in Tools > Options > Text Editor > C# > Advanced and select Show inheritance margin. Enabling inheritance margin will add new icons to the margins representing your code’s implementations and overrides.
Click the inheritance margin icon to display inheritance options that you can navigate to.

New Features for Containers
This release includes some exciting features for users of the Docker container tooling. You can now run any combination of services defined in your compose files, and enjoy improved container and image management in the Containers window.
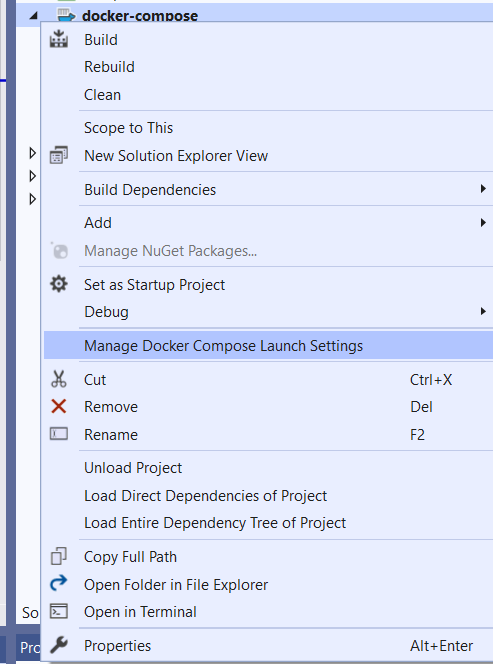
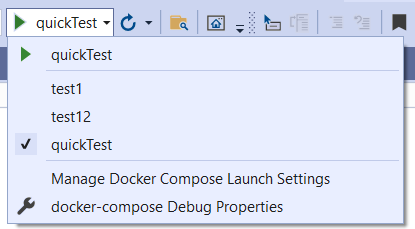
Run Launch Services Defined in your Compose Files
We listened to your feedback, and now our Docker Compose tooling in Visual Studio provides the ability to run any combination of services defined in your Compose files. Open the Debug dropdown or right-click on your docker-compose project and select Manage Docker Compose Launch Settings to get started.
The tooling finds all services defined in your Compose files and displays a dialog where you can choose services to start at launch. As you create a Launch Profile, you have the option to either select from the Docker Compose profiles declared in your Compose files, or individually select the services you want to start.
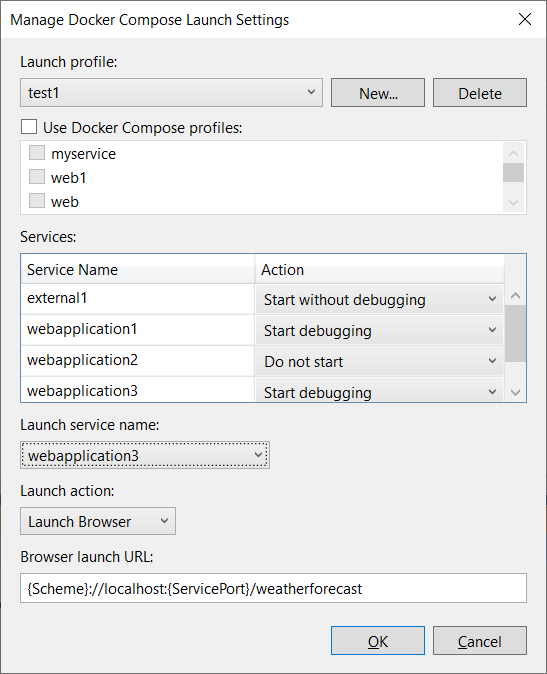
Any Launch Profile can be saved and run from the Debug dropdown in Visual Studio. This means you can create multiple options for launching your application’s services!
Advanced Interactions with Containers and Images
In Preview 2, we added many new features to the Containers tool window. We made it easier to view and interact with containers and images. Navigate to View > Other Windows > Containers in Visual Studio to open the Containers tool window and try out the new features!
Containers are now grouped by Compose project, which makes it easier to identify which containers are associated with your application. We also added a Labels tab in both Containers and Images so you can see which labels you are using during development.
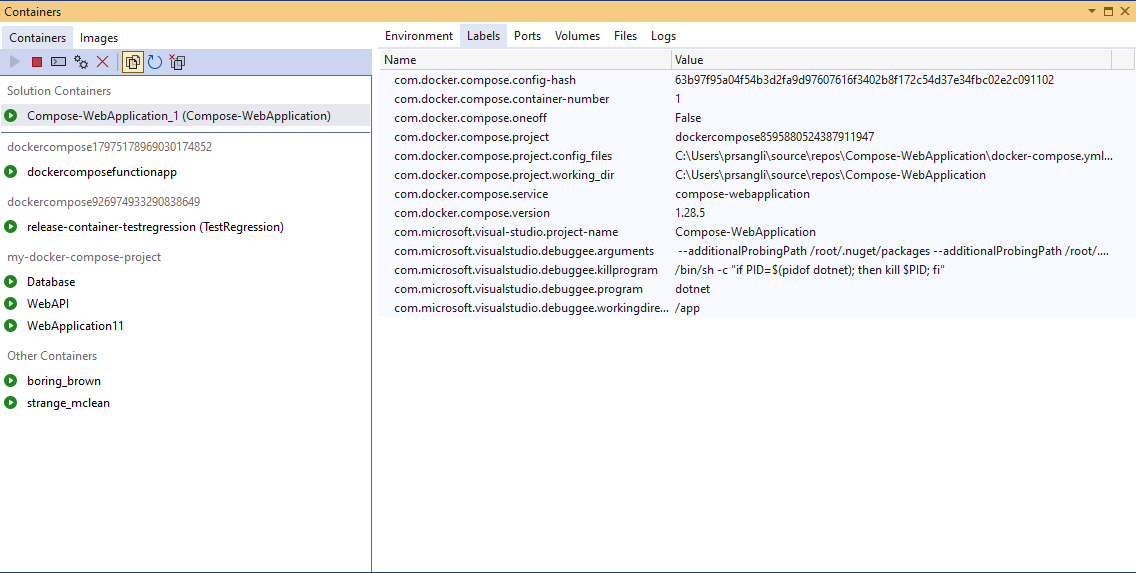
Our new Volumes tab allows you to see the volumes of a running container and even open the files in Visual Studio.
Finally, the Containers tool window also supports tagging an image! Right click on an image and select Tag.
Test Experience Accessibility improvements
We made several updates to improve the usability and keyboard accessibility of the test detail pane and log files in the Test Explorer.
View Console Logs in the Test Explorer
Console.WriteLine messages now show in the Test Explorer.
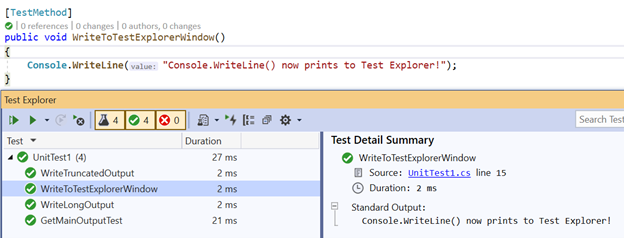
Output appears as a collapsible section in the test detail summary pane. Long output is truncated with an option to open the log in a separate window. Stack traces are truncated to 20 frames, and will only show the first and last 10 frames for long traces. An important part of the truncation design was focused on reducing VS freezes when test runs have large output. Tests that have large output will no longer block the UI thread.
Navigate Links from Log Files
Test output can now preserve tags so hyperlinks and stacktrace links are navigable from the log files. These links are now keyboard friendly as well.
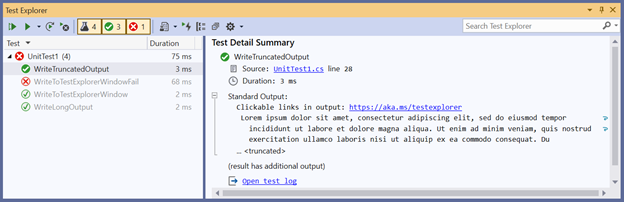
Automatically Create Log Files
Log files are created for a single test result when output is over 300 characters, or if there are over 10 files attached to the test result. Log files now open in preview so it’s easier to manage your tabs. Both the Test Explorer and log files support Ctrl PgUp/PgDn for navigating the cursor and Shift + Ctrl PgUp/PgDn for selection.
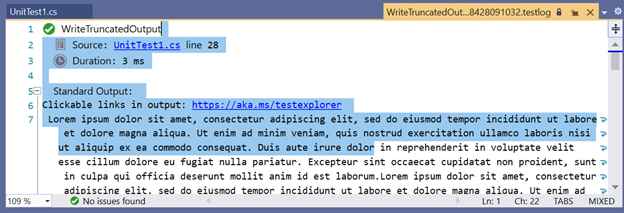
The log file editor now uses the IVsTextView interface and can now open very large text files. This should eliminate the need for users to “Copy All” truncated logs and open them in a separate editor. For MSTest, we also include a single log file that aggregates output instead of having individual log files for each data row.
Git Productivity
We’ve continued to enhance the Git tooling in Visual Studio and are excited to announce some long-awaited updates. We’ve improved how you switch repositories, view commits, interact with diffs, and synchronize your branches.
The status bar now features an enhanced branch picker, a repository picker, and a sync button. Select a commit to open an embedded view of its details and the file changes in the Git Repository window without having to navigate to other windows. You can compare commits in the same way! This view also allows you to pop out commits into their own windows if you want to deep-dive into changes.
Finally, the Git Changes window has a new overflow menu with commands to manage remotes, push tags, and manage branches. Get a walkthrough of all these features and more, in our latest Git blog post.
Visual Studio 2019 16.10 preview 2 adds a nice collection of productivity-enhancements for all Visual Studio users. Download the preview today to try out the new features and don’t forget to report a problem or give us feedback on Developer Community!
You can do the exact same improvement in "Team Explorer" , but some guy just create an another windows, and can not replace the “Team Explorer",
I wonder , Why can't you just rename "Team Explorer" to "Source Control" , and do the improvement in it ?
Just look at the "Git Changes"! , won't is exact same thing in "Team Explorer" -> "Changes" ?
I really do not understand that move "Changes" and "Connection" out of "Team Explorer" and take space from our source view or Solution View is called...
I tried adding LINQ to SQL classes to VB project targeting .Net 5 and it crashed.
Any update on integrated support for Azure Functions with .Net 5? dotnet-isolated debugging?
While I’m happy to see Microsoft continues to invest in Visual Studio, it doesn’t make sense to me to invest in two separate IDEs – Visual Studio and Visual Studio Code. I wonder what are the long range plans for both of these paths? Do they have different target audience? Will they eventually merge?
Any news on completion of Windows Forms Designer for .NET 5/6? Essentially this is still unusable for a lot of 3rd party controls
To me, “class Bar3 is inherited” doesn’t read right. It sounds like it’s saying the class has inheritors, whereas it’s actually saying that the class inherits from another.
The header units feature is still severly broken. I cant compile even an empty "Hello header units" project. I was tring to move my project on header units since 16.8 release, but the amount of errors and compiler crashes is absurd. I have reported already a dozen of problems. Part of them have been solved, but I have another serie of bugs and it seems endless. I dont even report some obvious bugs, like a project will never build succussfuly if it has a header unit. That's it, an empty project with an empty header unit. "unresolved external symbol" out...
I think a note should be added about the editorconfig UI. I opened a file and it didn’t open the UI. The issue turns out to be the fact that anyone who edits editorconfig regularly is probably using Mads’ EditorConfig Language Service extension. That extension prevents the new UI from appearing. You need to either disable or uninstall that extension before the new editorconfig UI will show up. It would be nice if this were documented somewhere to avoid confusion.
Michael,
Thanks for bringing this to our attention. I brought this up to Mads and we’re discussing how to address it!
UPDATE: We have filed a bug to track this here, thanks again for reporting this:
https://github.com/dotnet/roslyn/issues/52661
Lots of nice improvements, many thanks for them.
What I am missing on the C++ front is improved tooling for C++/WinRT, to reach feature parity with C++/CX, namely proper syntax highlighting and intelisense for IDL files, some kind of two way editing across XAML C++ IDL and not having to do VS job, manually copying and merging generated C++ files.
Waiting for the day ISO C++ ever gets reflection doesn’t seem to be the way forward, meanwhile the github issues and developer feedback seem to keep being ignored.
Got excited when i noticed “Git improvements”… but… still no staging hunks support? Are there plans to support this feature anytime in the near future, as VS Code does?
Hi Nico, yes we’re working on this! Please follow the request on Developer Community, we’re excited to show you designs soon 🙂