

Event handler leaks have been around for a long time, and they are one of the peskiest issues WPF (Windows Presentation Foundation) developers regularly deal with. You might be thinking: What makes event handler leaks so important? Event handler leaks are easy to cause, all it takes is to forget to unsubscribe to an event. Additionally, they are quite difficult to spot and even trickier to fix.
The new insight added to the Visual Studio Managed Memory Usage Tool introduced in update 17.9 Preview 1 significantly trivializes the process of spotting/fixing these leaks. It provides information on which objects are leaking and the event it subscribed to.
What is an Event Handler Leak?
An object leaks on the heap when it is functionally out of use, but not identified for Garbage Collection. This means that it will unintentionally remain alive in memory. Event handlers are notorious for causing this scenario. This is because event handlers create a direct reference between an object and the event it has subscribed to.
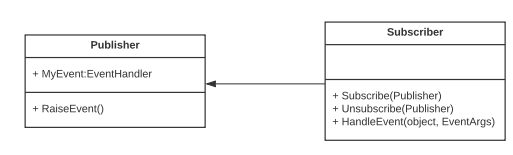
Figure 1: UML of pub/sub model with events in C#
In this example, we have a Publisher and Subscriber class. When Subscriber calls Subscribe(publisher), MyEvent will link Publisher and Subscriber in the heap:
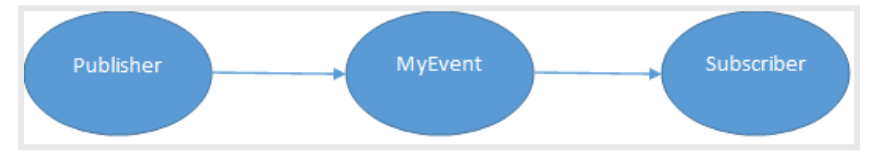
Figure 2: Heap view of Figure 1
The issue with this is that if Subscriber forgets to unsubscribe, these references remain on the heap, thus leaking Subscriber. The trivial solution here is to simply call the unsubscribe method, but in more complex applications, it is difficult to track an object’s subscriptions and when to unsubscribe. This is where the Memory Analyzer can come in and help developers fix these issues.
Okay, How Do We Fix it?
To demonstrate the insight, we will do a walkthrough debugging of a sample WPF app to find an event handler leak:
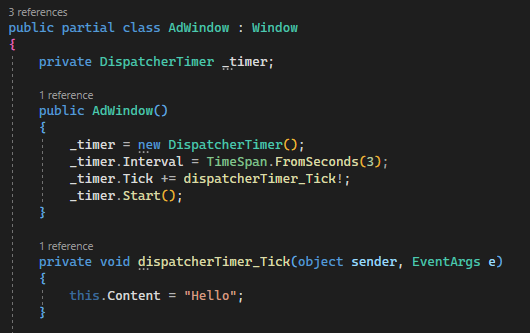
Figure 3: Sample code of a WPF application
In this case, we have a window which subscribes to the dispatcherTimer_Tick event when opened. What the event is doing doesn’t really matter. The important part of this code is where we forget to unsubscribe to the event when the window gets closed:
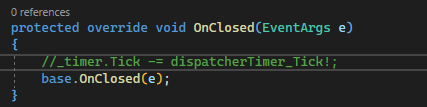
Figure 4: Code that causes event handler leak in the sample WPF app
The commenting-out of the unsubscribe statement here is problematic since it no longer unsubscribes properly as the window closes and will cause a leak. To find it, let’s start debugging this app (F5). For simplicity, let’s assume main() properly causes the leak, it opens AdWindow, causing it to subscribe to an event, then closes it.
First, we need the Diagnostic Tools window open. To get to it in a debugging session, go to Debug -> Windows -> Diagnostic Tools.
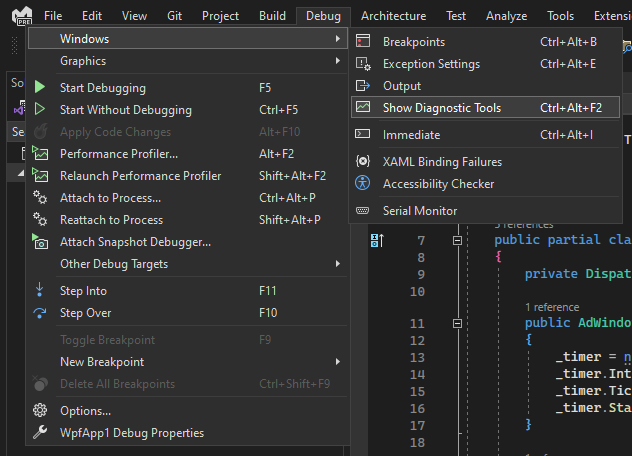
Figure 5: How to navigate to the Memory Analysis Tool
It should look like this when it is open in a debug session:
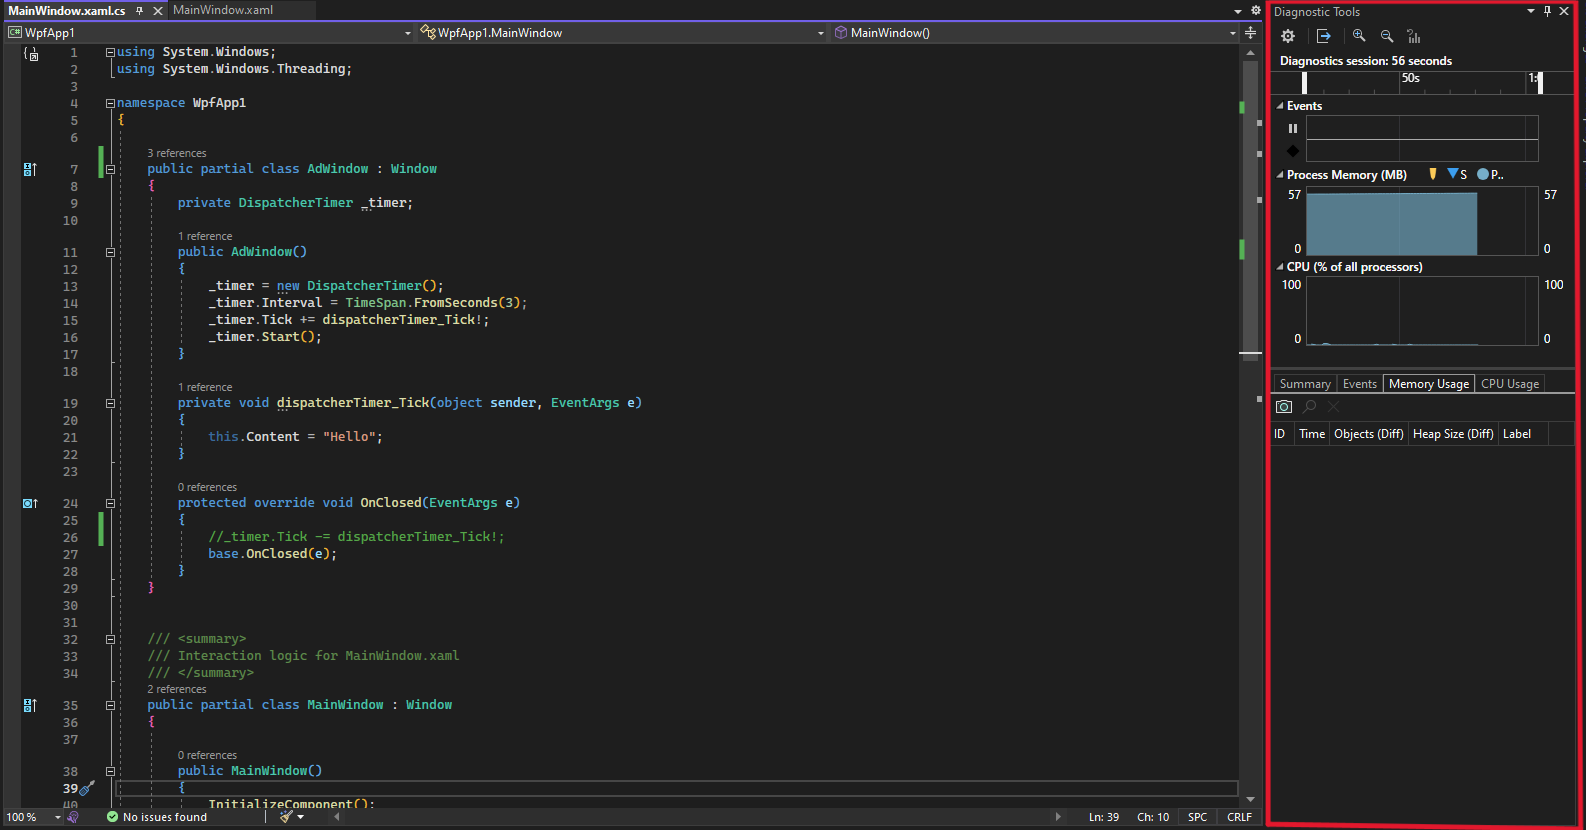 Figure 6: Memory Analysis Tool view in Debugger
This window shows the overall size of the heap and the CPU% for the application being debugged. When we click the camera icon to take a snapshot, we can view the heap and access the event handler leak insight by clicking the value under Objects.
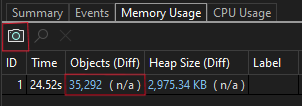
Figure 7: How to take and view a snapshot
Once we are in the heap view of the snapshot, navigate to Insights:
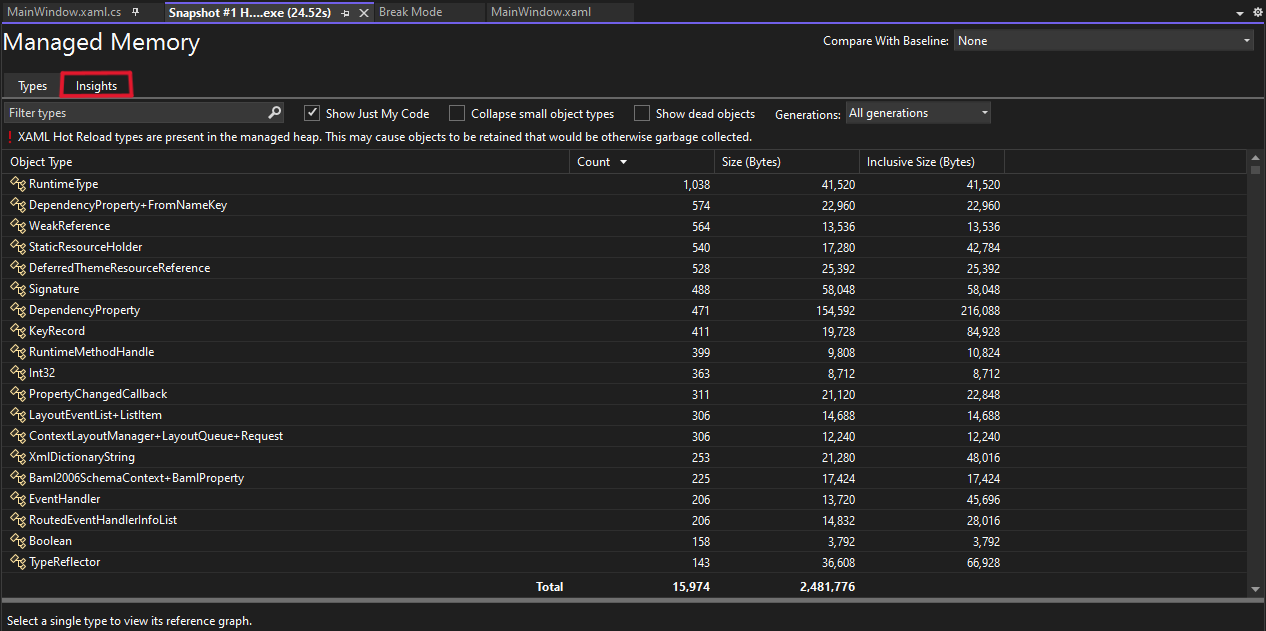
Figure 8: How to navigate to the Insights tab
We are finally here! In the Insights Tab, we can see the list of leaking event handlers, and we can see that our leaking window shows up. Additionally, we can see the total amount wasted by that leak. Just that one simple example caused a leak of 4.93 KB! This is because the window has a whole subtree of objects it references that also are leaking just from forgetting to unsubscribe.
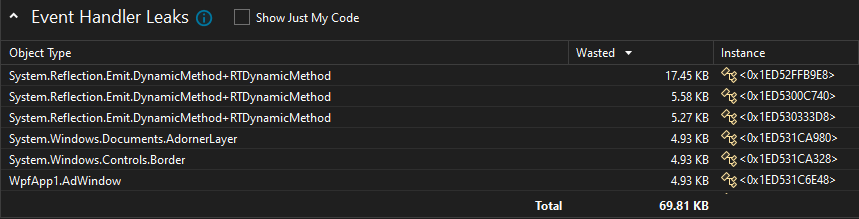
Figure 9: Instance view of event handler leaks
Additionally, you can filter out all the system code by clicking ’Show Just My Code’ to show just AdWindow.
That’s Cool, But What Now?
So far, we have successfully identified the leak in our app. Now if we want to fix it, we can click ‘View Details’ to see more information on what the issue is and more importantly, how to fix it.
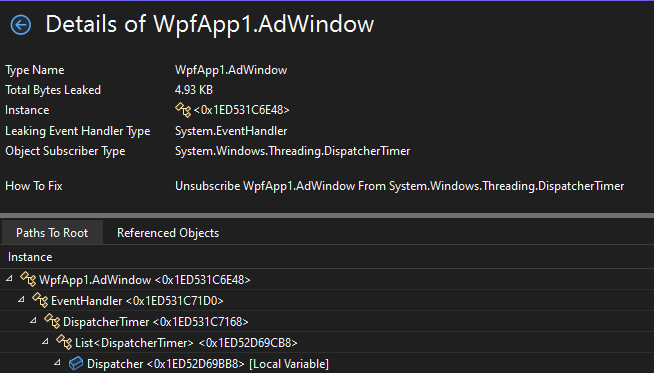
Figure 10: Details view of event handler leak
This view shows us some critical information about the leak. We can see the address of the object, the event handler that it is holding onto, and most importantly, the object it subscribed to. This conveys that to fix the issue, AdWindow must unsubscribe from DispatcherTimer. Additionally, you can see the reference graph of the AdWindow object. The ‘Referenced Objects’ tab shows just how many additional objects are leaked due to AdWindow.
What Else Can We Do?
If you’ve made it this far, you might be interested in the other uses this insight has. For instance, the detection logic can handle any kind of Event handler. Consider the console app with a publisher and subscriber class from earlier, if we create our own event handler, we can still detect it.
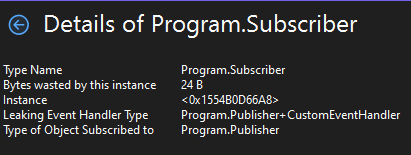
Figure 11: Details view of event handler leak with custom event handler type
Tell us what you think!
There are still plenty of improvements to come in future versions of this experience. Please Download the latest Visual Studio Preview and provide your feedback. Please raise issues and provide feedback within the Visual Studio with “Report a Problem” or directly at the Developer Community site.
Apologies for the inconvenience. The feature is in 17.9 Preview 1 and is compatible with both .NET Framework and .NET 5+.
How does it know I’m done with the subscriber, in general?
Is there a mistake in the article? Are you referring to 17.9 Preview 2 which is available right now?
Apologies for the confusion this feature is available in 17.9 Preview 1.
Thank you 🙏
Didn't get any "Event Handlers Leaks" category with 17.8.3 nor with 17.9.0 Preview 2, anything specific needed for that.
All aside the insights will help for common pitfalls with UI coding, especially those old ones made, and with iOS where that is most likely to happen due the heavy requirement to use weak references as that platform plays really weird with references being retained even though you would expect it to be gone.
However I think a small footprint in the blog might be needed that in your example the memory leak occurs because the DispatcherTimer is using Timer that has a...
I imagine this will only be available for applications using the CLR. .NET for iOS uses the Mono runtime. It would be great if they can get this tooling to work on both runtimes, but I see no signs of that (yet).
I tried with a Dump of a .Net FW 4.8, and also a Snpashot of the running process, but I only have ‘Duplicate Strings’ and ‘Sparse Arrays’ in the Register ‘Insights’. This is with VS Version 17.9.0 Preview 2.
Is this insight maybe only aviable with the .Net Core Framework?
Or is there some other contition?
I was wondering the same thing. VS Version 17.9.0 Preview 2.0 here. I’m debugging an ASP.NET Framework 4.8 application and in the “Insights” tab all I have are “Duplicate Strings” and “Sparse Arrays”.