Have you ever accidentally shipped a log statement to production? Are you tired of cleaning up log statements while debugging? The tool to solve your problems has been here all along!
Do you use log statements to debug?
Let’s be honest we have all done it at some point. Whether it be Debug.WriteLine(), console.log(), print(), etc. logging output to the console is a common practice that leads to what some might call “immediate feedback”. But what seems like a simple and enjoyable approach to debugging quickly turns into a lot of cleanup work because the log statements are now littered through your code. After all no one wants to see your log statements shipped to production.
Do you find code cleanup tedious?
If so, then Tracepoints are a great tool you can use in Visual Studio. This feature allows you to log desired information without modifying your code and is initialized in a similar fashion to breakpoints. When you are done debugging simply click on a tracepoint to remove it.
The solution has been here all along
Tracepoints are not a new feature. In fact, they have existed in Visual Studio since 2005, but we feel that many developers do not know about this capability. In this post, we will go over what tracepoints can do, how to use them, and why they are a feature worth using. For an even more thorough explanation of tracepoints, see our docs page: https://docs.microsoft.com/en-us/visualstudio/debugger/using-tracepoints?view=vs-2019.
Let’s look at an example
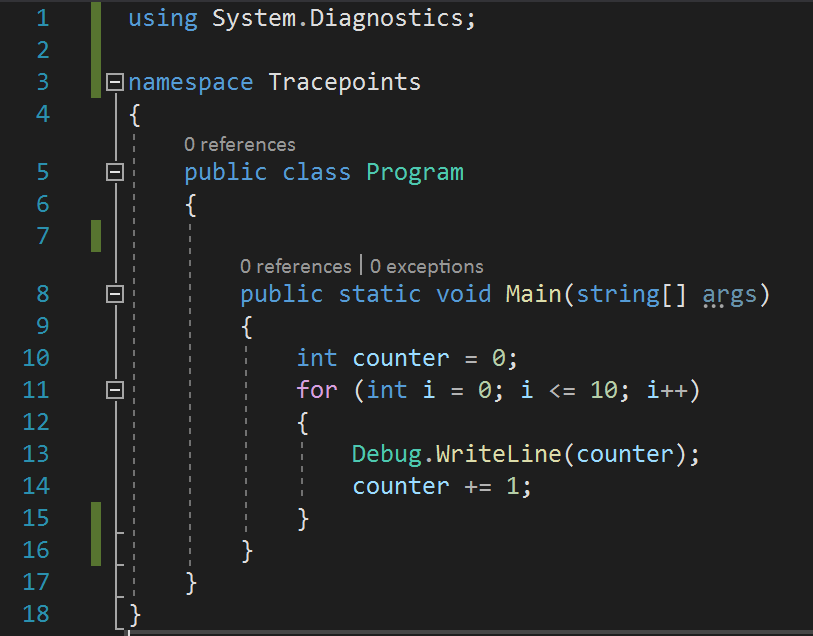
The following program is a for loop with a counter variable increasing by one each time the loop iterates. Let’s say we wanted to print out the value of counter for each iteration of the for loop. One solution is to use a log statement such as Debug.WriteLine(counter) to print out the values. Let’s see what that would look like:

While that certainly accomplished this simple task, it required us to modify our code and will necessitate we delete the statement later so that the log statement is not shipped to production. You also will need to delete log statements periodically even before shipping to production as you add newer log statements so that the Output window in Visual Studio is not cluttered with irrelevant information. Furthermore, there is no conditional logic to when these statements print such as only printing the “counter” variable when it is an odd number. Adding conditions would require more code, further complicating the debugging process and creating more cleanup for later. We believe that there is a better way to handle these situations.
Tracepoints to the rescue
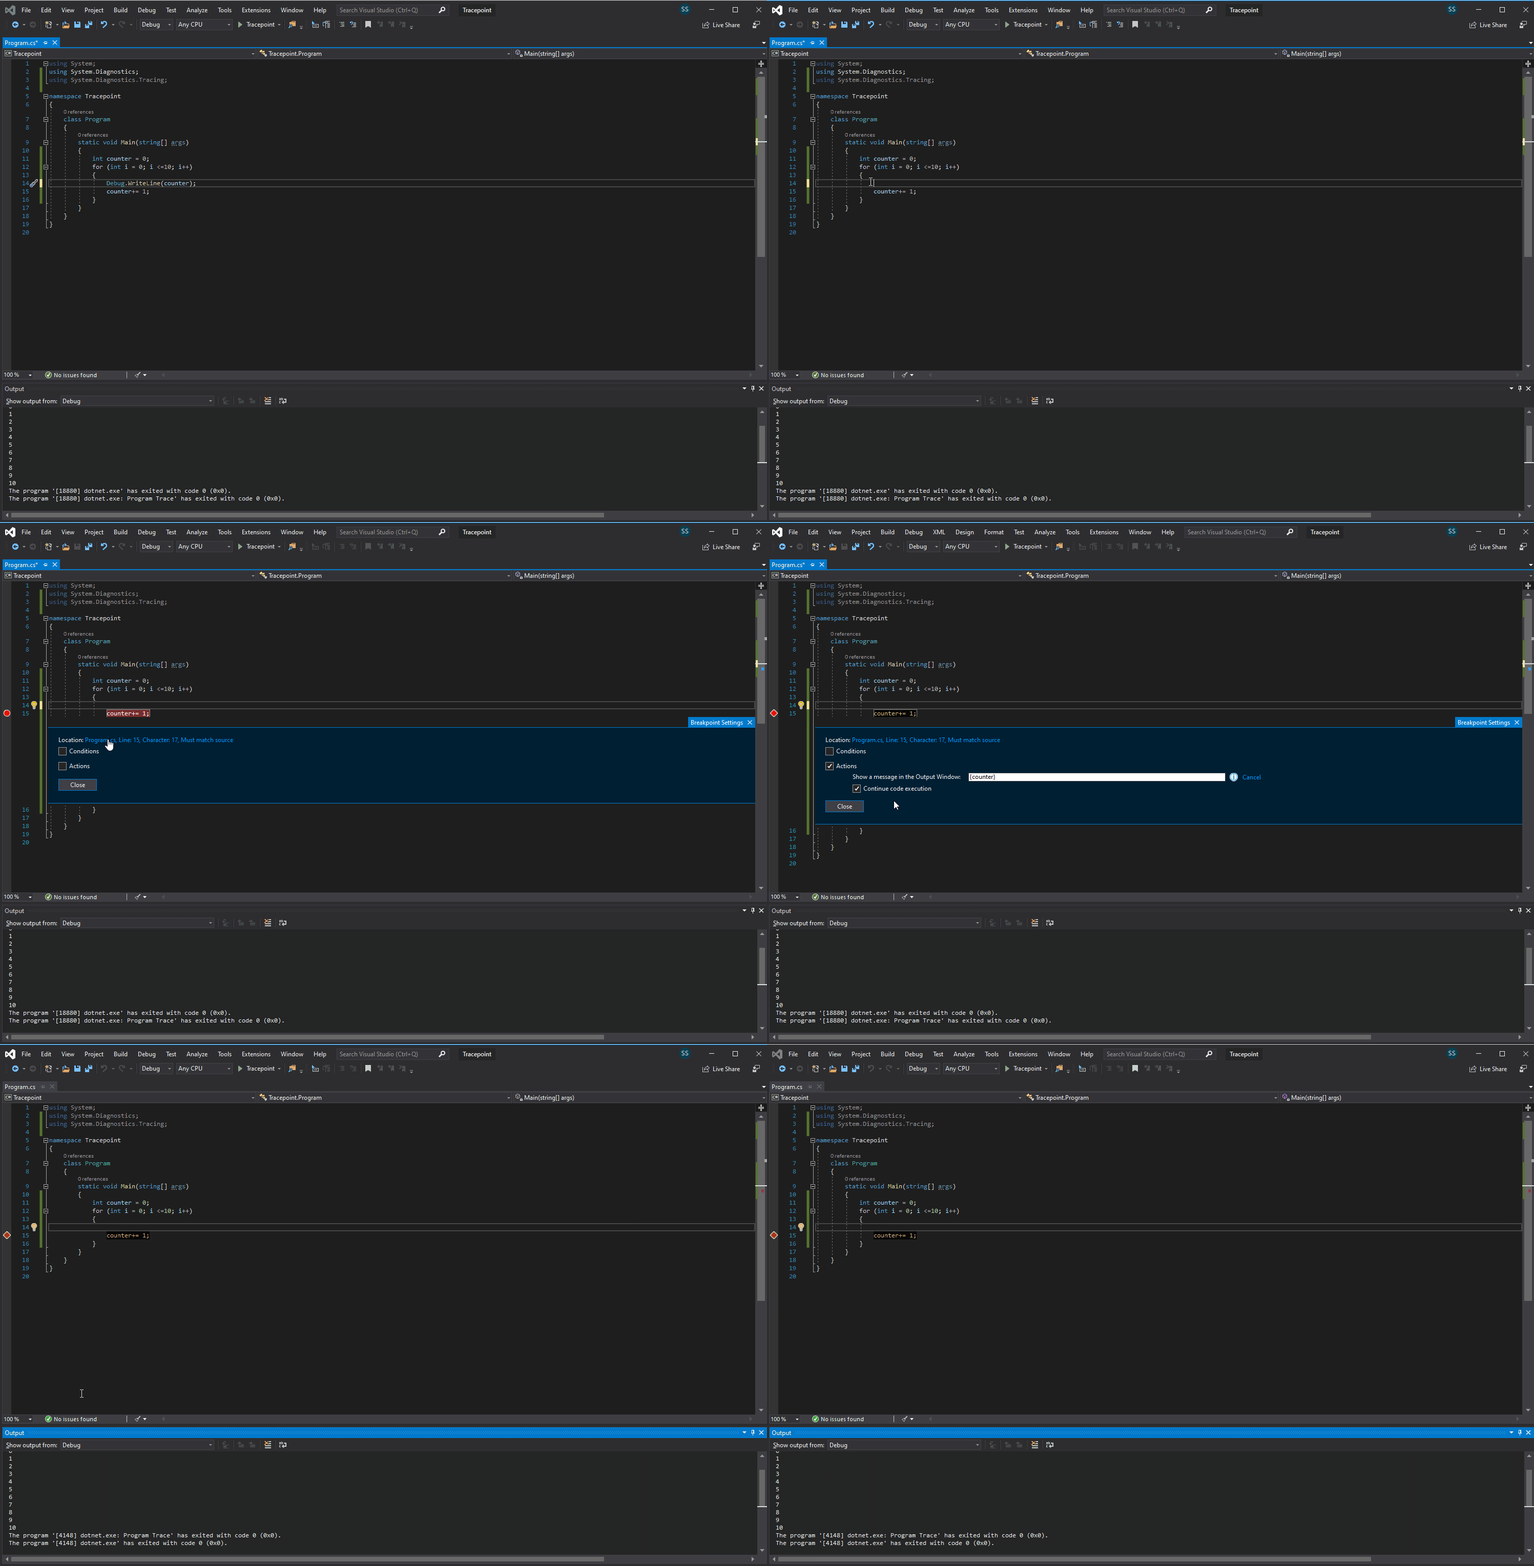
The GIF below demonstrates how to initialize a tracepoints.

Notice how when you add a message in the “Show a message in the Output window field” under the actions menu you are not modifying your original code in any way. By this I mean you do not need to add print statements or functions such as Debug.WriteLine() in the middle of your code just to see information in Visual Studio’s Output window. This allows you to get the desired information in Visual Studio’s Output window that you wanted before without compromising the readability of your code. Furthermore, when you are done debugging simply click on the tracepoint once to delete it. Simple as that. If you forget to delete a tracepoint don’t fret about the extraneous output showing up in production. That’s because tracepoints only exist locally on your machine.
You can add conditions too
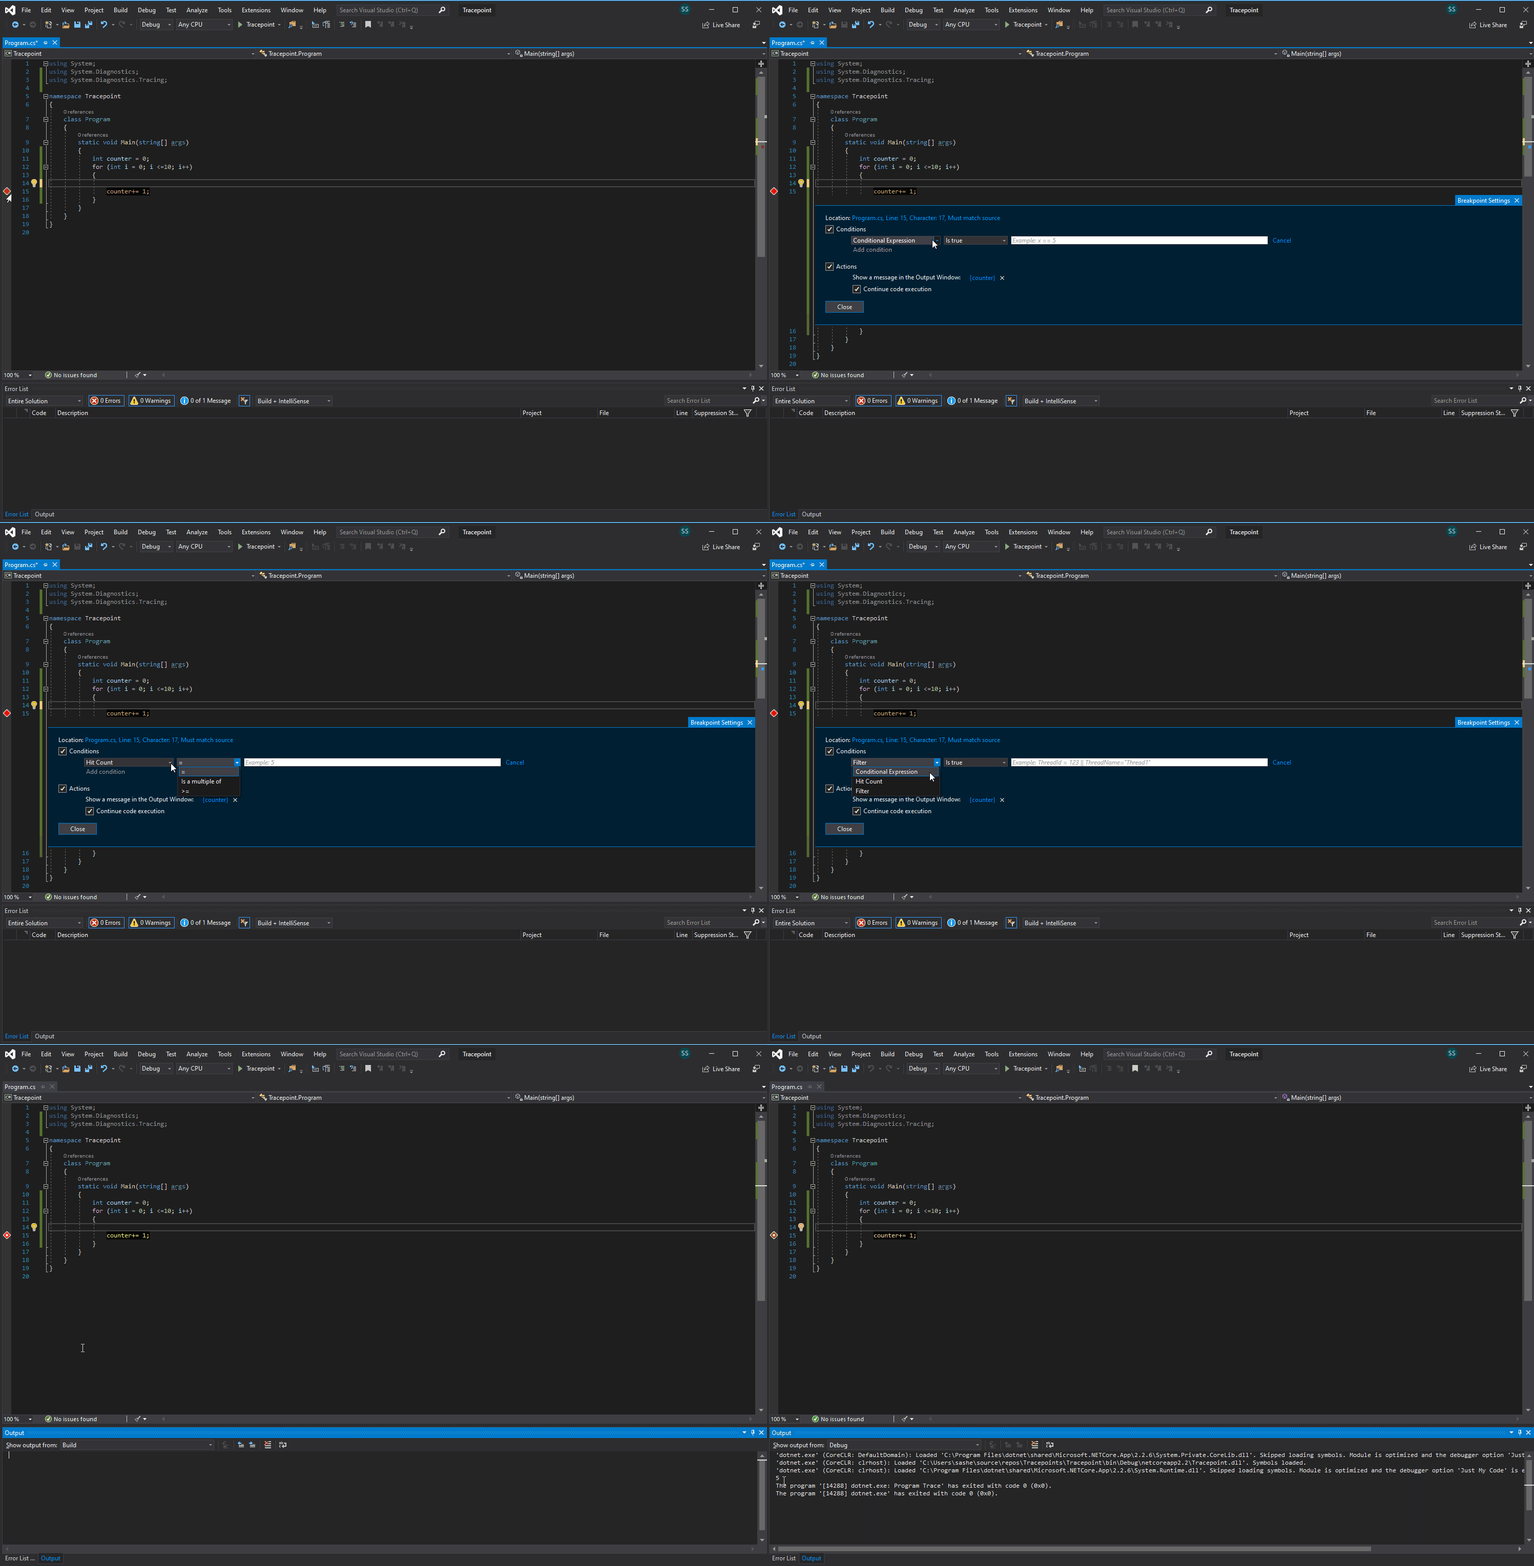
What about those cases earlier when we wanted conditions? Let’s say we wanted every other count or the value of counter during a specific iteration of the for loop. Well it turns out we can add conditions too in a similar fashion to conditional breakpoints.
 There are three condition types:
- Conditional Expression: Output message displayed only under certain conditions such as “counter >= 5”.
- Hit Count: This condition allows you to output only after a pre-specified number of times the line the tracepoint was set on has been executed.
- Filter: Tracepoint will only be activated on specified devices, processes or threads.
Adding these conditions will not modify your original code and unlike breakpoints does not stop the program and require a user to repeatedly step into or over a program (as long as the “Continue code” box under Actions is checked).
Tips and tricks
Currently tracepoint messages go to Visual Studio’s Output window. It is easy to lose track of the messages amongst the many other things that get sent to the same window.
- If you right click within the Output window, you can turn off classes of messages such as Exception Messages, Step Filtering Messages, Process Exit Messages, etc by clicking on them. By turning off some of these classes of messages that you may not want, it will make it easier to focus on your tracepoint output.
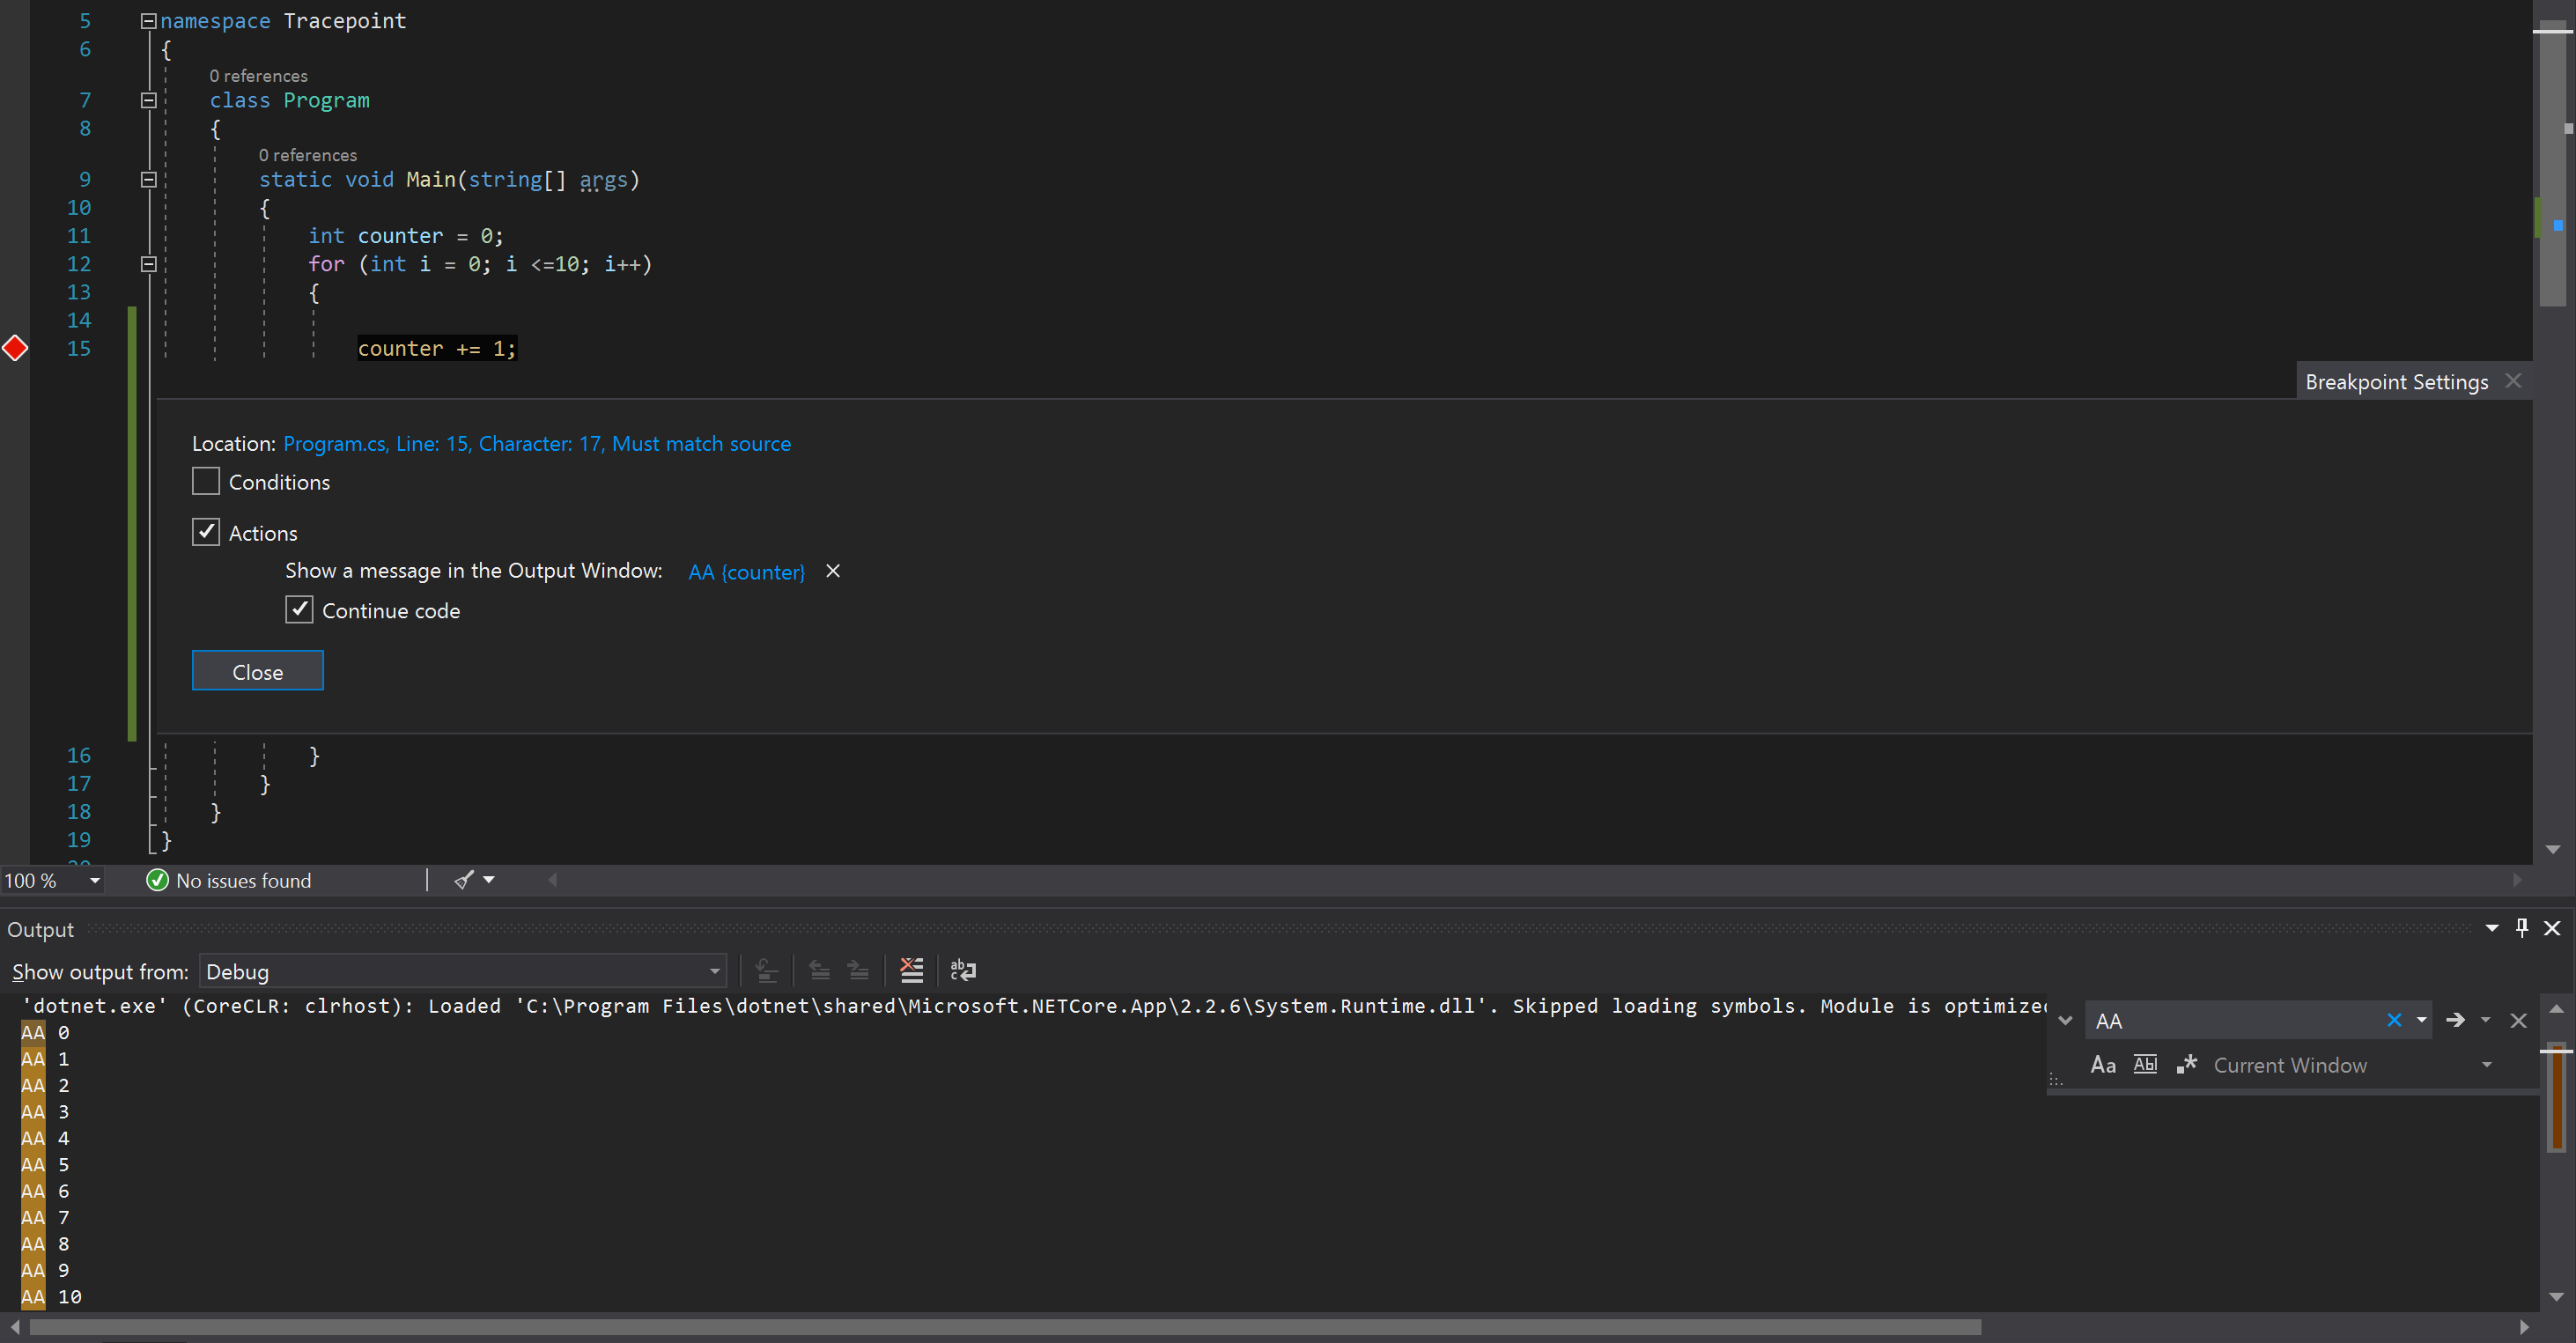
- If your current task requires you keep all the classes of messages on, another trick to make it easier to find your output is to prefix your action’s message with a unique phrase like “AA”. Once you start debugging your program you can use the CTRL-F command in the Output window to search for the prefix you set and it will take you straight to your output message (see image below).

- To temporarily disable a tracepoint without deleting it is to hit “Shift + left click” on the tracepoint.
- To view, disable, and/or delete all the Tracepoints and Breakpoints in your current file at once hit Debug -> Windows -> Breakpoints to access the Breakpoints window.
When logging might be useful
In some cases, a language’s log statement such as Debug.WriteLine() in C# may be a better choice than using tracepoints. For example, if you want to always see some output in the debugger that persists beyond the current debug session then Debug.WriteLine() might be the right option in that context. Tracepoints do not persist beyond a single (or possibly a few) debug sessions. Another consideration is efficiency. Tracepoints are also less efficient at debug time so if they too slow for your needs try a log statement instead. Lastly, tracepoints have limitations in what data they can collect because they can only virtually execute function evaluations. Despite some of these restrictions, we still feel like tracepoints are a great tool to have in your debugging toolkit.
Wrapping up
In conclusion, tracepoints are a great way to keep your code clean during debugging. You will not need to modify your original code or remove statements later. If you want conditions you can add those as well without needing continuously stop and step through your program. We hope you enjoy using tracepoints and that they streamline your workflow! For more information on tracepoints please check out our docs page: https://docs.microsoft.com/en-us/visualstudio/debugger/using-tracepoints?view=vs-2019
If you have any feedback, please feel free to reach out to us. We would love to hear from you!

Thanks for bringing this feature up! I've often used conditionals, but totally overlooked the Action checkbox. =)
I suppose trace points are kind of short-lived, but if I would like to share them anyway, and include the project as kind of a debug information layer (and avoid using Debug.WriteLine's cluttering the code). I found that breakpoints are saved as binary in .suo in the .vs settings folder (excluded from version control by default). However they can be exported to an XML-file, but they would go stale quickly, as code change. To get keep the trace/breakpoints up to date, perhaps a...
Hey Magnus thanks for the feedback. That is a great suggestion!
Looks great, but the UX seems clunky, with you having to create a breakpoint first, then transform it to a tracepoint. Something like right-clicking the variable and a “trace this” entry in the context menu, or a hotkey you could press while having the cursor on a variable would be a lot more convenient.
That is a great suggestion László! Thanks for the feedback. Another way you can initialize a tracepoint is to right-click and then select Breakpoints and then Insert Tracepoint from within the context menu.
Finally printf() debugging is back on the menu 🙂
Microsoft ought to consider buying SmartInspect (https://www.gurock.com/smartinspect) since it’s current owners are no longer showing it any TLC, as this is a much better way to perform tracing & logging.
I use this feature all the time, although for whatever reason, I’m constantly putting conditions in my actions and vice-versa…I almost miss the dual UIs from versions past. I also tend to still use code-based break/trace points since I usually already have my hands on the keyboard and also have issues with the soft breakpoints coming back if I delete them while debugging.
Hey Keith thanks for your thoughts! I would be curious to know more about what you liked about the dual UIs from previous versions. Do you mind describing those UIs a bit more and elaborating on why you liked them so much? What else could we do to make the actions and conditions menus more clear?
Off the top of my head, having the action/condition textbox get focus immediately would be nice (so I can click “Action” and just start typing instead of click “Action”, then put the caret in the textbox first. I double-checked since no focus change seems very un-VS-like, and it may just be a bug – right-clicking “Conditions…” puts focus immediately in the condition textbox, while right-clicking “Actions…” does not.
Couple more ideas I had this afternoon:
1. Bring back the ability to default the trace message to the current method signature (IIRC the older UI did that), although here a Populate button might be more appropriate.
2. Preview the trace message if I’m currently on a breakpoint (this would help when I screw up my message by doing something like leaving off my braces)
This is great feedback thank you!
Due to conditional compilation, it’s perfectly fine to ship Debug.Write* calls to production.
Hey Alex! Good point. I would say that even though conditional compilation avoids the production issue, using it with Debug.Write* still compromises the readability of the code while debugging for some users. Some may prefer the experience of writing the Output message under the collapsible tracepoint menu. The good news is at the end of the day you, the user, get to choose which experience you prefer for any scenario. If you are happy with the conditional compilation and Debug.Write* experience great! Tracepoints are another debugging tool at your disposal for you to use as much as you would like.
There is a hidden side-effect of using `Debug.Write*` though: when I last looked under the hood, I found when it writes to an output it takes a lock on the output for each write call. This can have unintended consequences for multi-threaded code, even to the point where the code works in debug (because threads are synchronised by the lock) but has issues in production (because the logging code isn’t even compiled in, and hence nor are the locks).
Do trace points also do this?
Hey David thanks for the question! Tracepoints do not do this.
Have the performance penalty with conditional breakpoints in .net code ever been fixed? I stopped using them back in VS05 or 08 after discovering that a conditional breakpoint would slow a hot loop in calculations down by an order of magnitude, while inserting a few lines of dummy code with the same condition in an if statement that I could stick a breakpoint inside of had near zero impact.
Hey Daniel thanks for the inquiry! Unfortunately this performance penalty still exists, so the scenario you described is one where log statements may be the better option if performance is an issue.
This is a true show-stopper for working either with break- oder tracpoints in VS. In many cases a condition is required, to debug, but when looping over several thousand collecion entries, VS conditional breakpoints are simply unusable. This issue should definitly be adressed by the VS team (its 2019!), as now developers are still forced to use oldfashioned Debug-code like
if (item.Id == 1234)
{
// Put break-point here
}
if they don’t wait for minutes instead of seconds.
I will try this during my next debugging session.
Glad to hear Jonas! Let us know what your experiences are once you have tried it. We would love to get your feedback!
Although a nice feature (especially the $variable expression we can use), what we can do with it seems far too simple. Plus we can only send the result to the (sluggish) Output Window? What about ETW?
Hey Simon thanks for the feedback! Unfortunately you cannot use tracepoints to view ETW events. Your critique of the Output Window is definitely fair. Both of these are issues we are aware of and thinking about but have no public announcements at this time. What scenarios did you have in mind for ETW? Were you wanting to view a real time stream of ETW events from certain providers for example or something else?
Best,
Sagar
If you make a static function which can send the ETW event, you could call it from the expression in the tracepoint. Writing debugging helper methods like this is a way that you can extend the debugger functionality.
Thanks for the suggestion Adam!
Thanks Sagar!
You are very welcome Matías!