In Visual Studio 2013 we added a tool in the performance and diagnostics hub to enable you to analyze memory usage for Windows Store apps built using XAML. Since last fall, we’ve gotten requests to support WPF and Win32 apps. Today we’re happy to share the progress we’ve made on these requests by enabling WPF and Win32 app support in last week’s Visual Studio 2013 Update 3 CTP 2 release. While the current support is limited to Windows 8.1 and .NET 4.0, we feel this is a good step in the right direction, and are exploring further support going forward. In addition, we took this opportunity to add some awesome features, such as the ability to force a garbage collection and to see what modules are responsible for memory allocation. This post will briefly highlight these improvements.
Force GC
Focus on objects that are important by explicitly forcing a garbage collection in your application to get rid of short-lived objects and objects in the Finalizer queue before taking a snapshot.
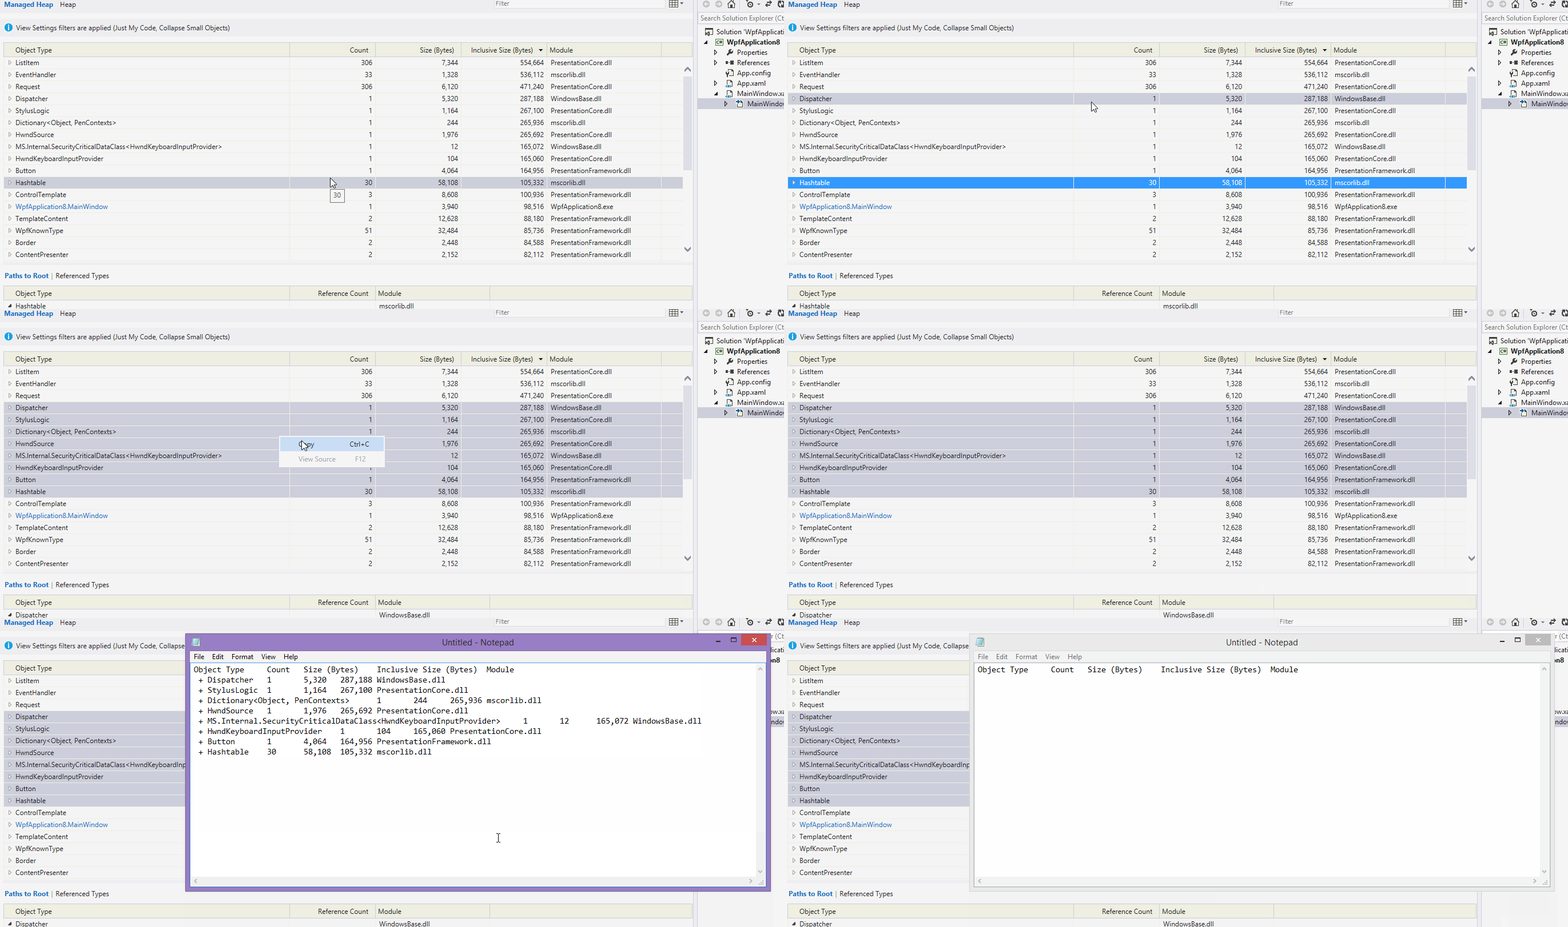
Copy Multiple Rows
No more copying data row by row. Copy and paste formatted content from multiple rows in any data grid in the heap analysis views using standard gestures like CTRL + Click.
Module Column
View the module from which a Type or a Stack Frame originated in the new Module column in the details views.
Faster native heap analysis
Native heap analysis completes faster than ever. We delay load symbols for non-user assemblies until you explicitly turn off Just My Code. We have seen upwards of a 10X improvement in load times for large session files.
Conclusion
For further reading, check out this post by Adam Welch for a sneak peek at some more new improvements to the Memory Usage Tool in Visual Studio “14” CTP. We are interested in knowing more about what you think about these experiences and what you would like to see in the Performance and Diagnostics hub going forward. Please send us your feedback through replies to this post, Connect bugs, User Voice requests, the MSDN diagnostics forum or the Send a Smile button inside Visual Studio.


0 comments