As part of our continued effort to provide great diagnostic tools for developers, Visual Studio 2013 introduces a new Memory Usage tool as a part of the Performance and Diagnostics hub. The Memory Usage tool supports Windows Store and Windows Phone Store apps using C#/VB/C++ and XAML. This blog post gives you an overview of this tool and helps you understand how to use the tool to solve common memory issues using some examples.
Overview
It’s important that apps use memory efficiently for the following reasons:
1. ****Memory caps on Phone devices: In particular for Phone, there are specific memory limits enforced on an application based on the size of the memory in the device. Allocating more than the specified limit will cause an OutOfMemoryException and will result in app termination.
**2. ****Apps might get terminated when suspended: **Using a large amount of memory will increase the likelihood of your app being terminated when suspended. Having applications quickly resume is important for a delightful customer experience
3. ****App responsiveness and system reliability: Apps that allocate a large amount of memory are liable to slow down the system and cause reliability issues. Allocating a large amount of memory within a short period of time can cause the application to stop responding
Let’s take a quick tour of the major features of the Memory Usage tool by solving a couple of issues in the Photo Filter sample application. The application is a hybrid XAML App using a managed front end and a native WinRT library for image filtering.
Detecting and analyzing memory issues
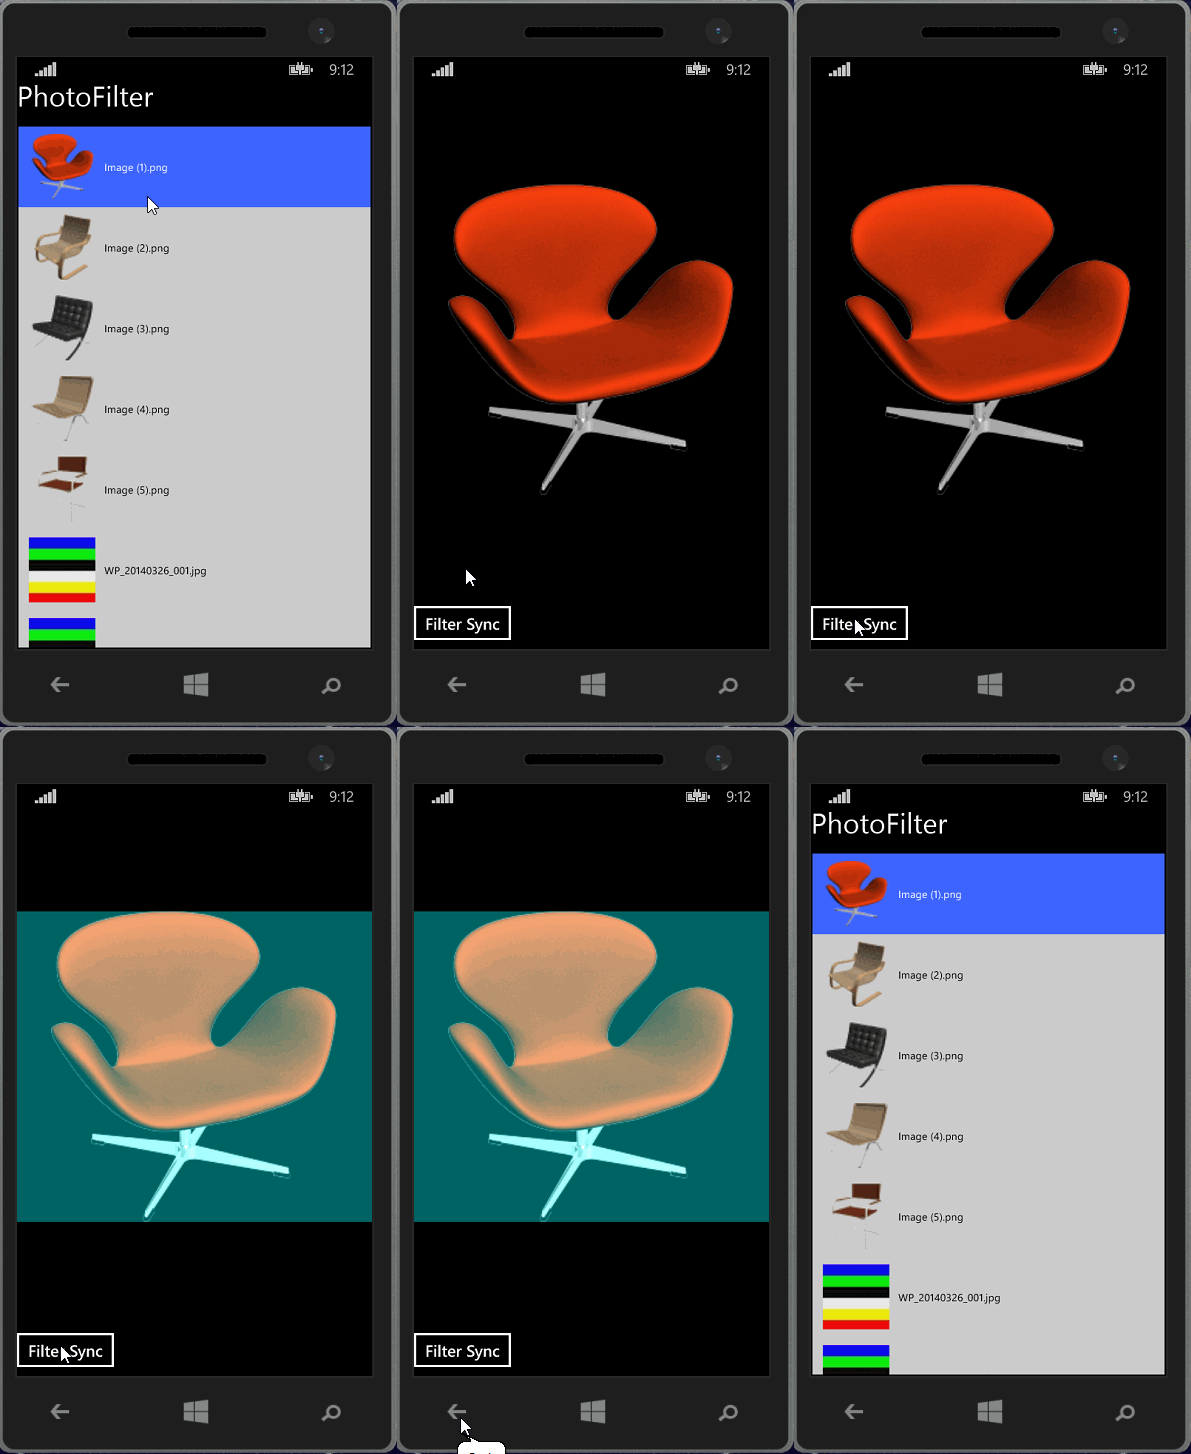
Download the sampleand open it in Visual Studio. If you run the application and apply a filter multiple times on different images you can notice that the memory usage of the application keeps on growing
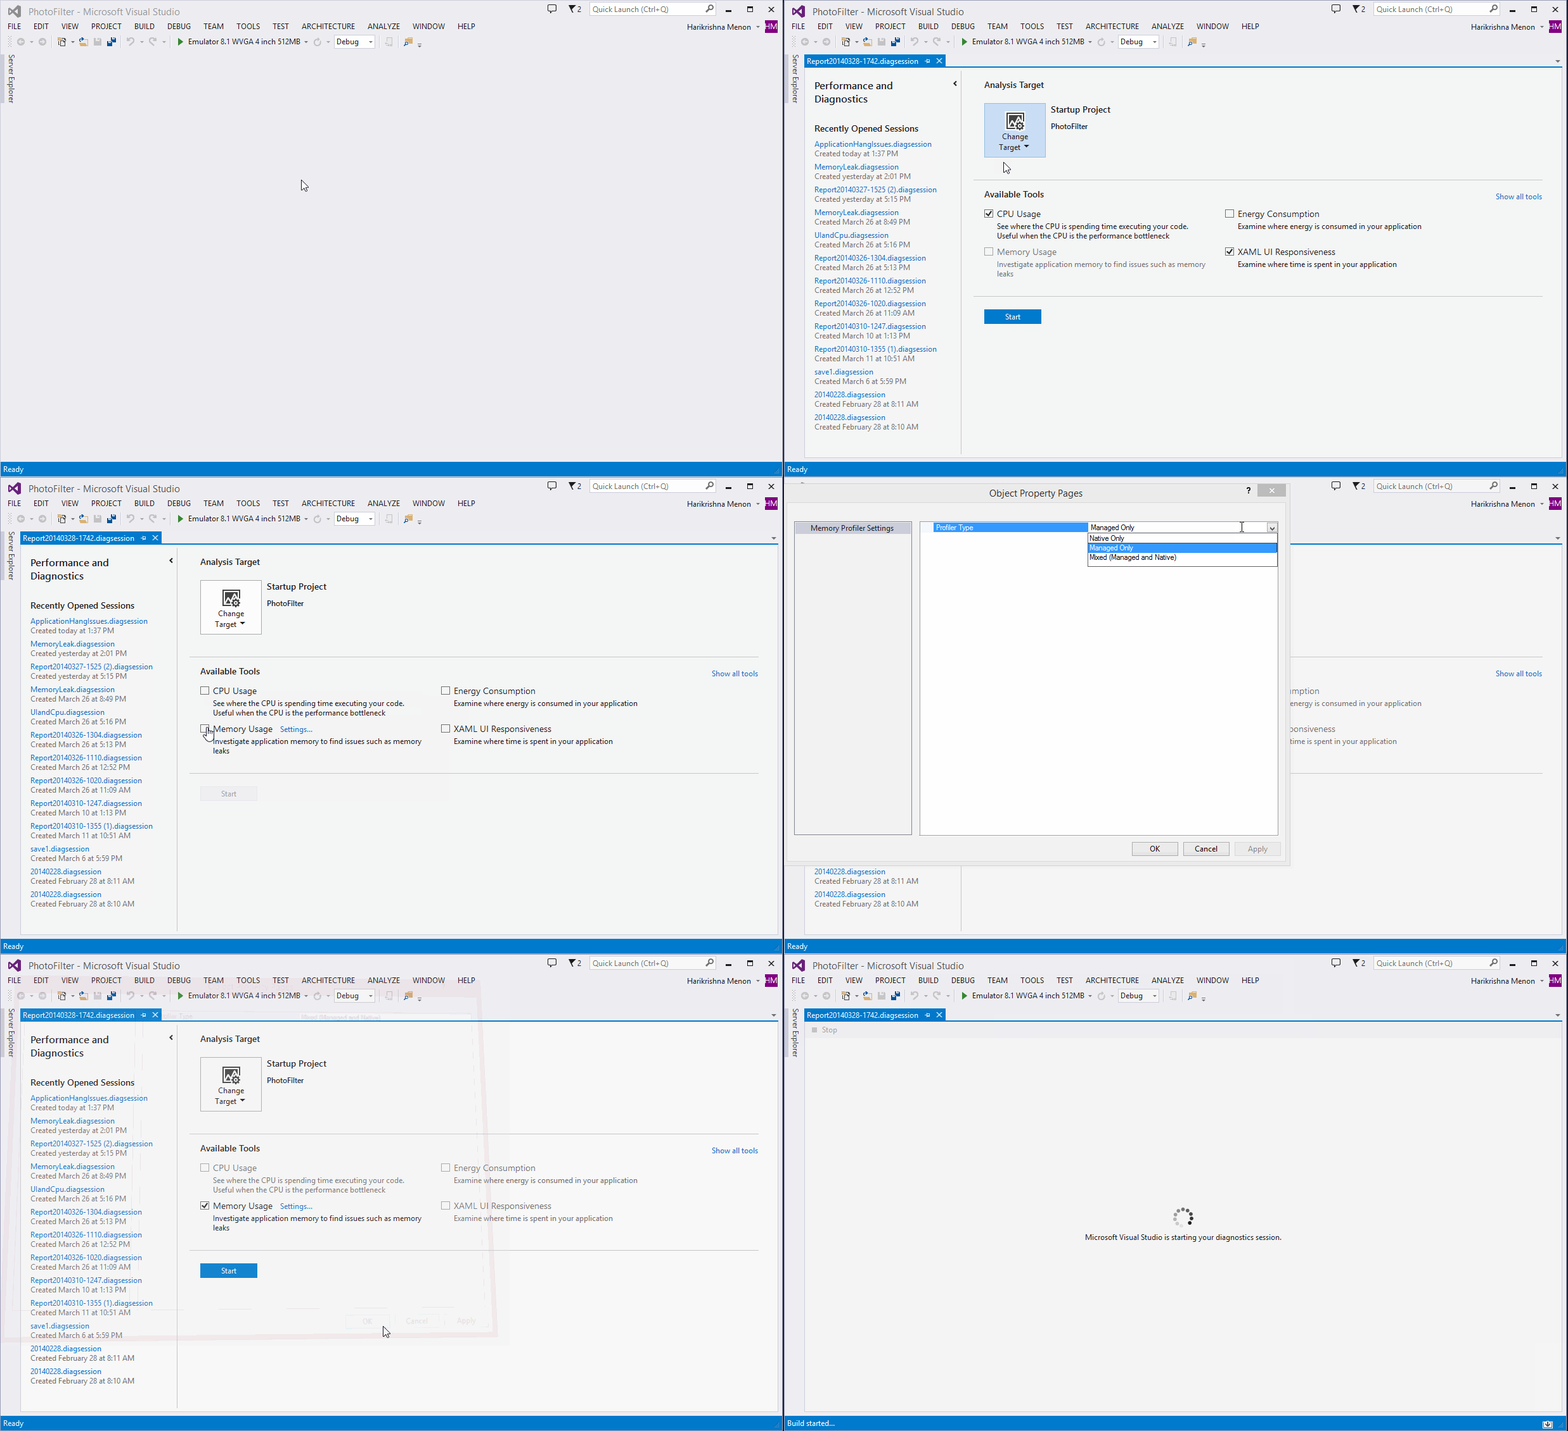
Open the Performance and Diagnostics hub from the Debug -> Performance and Diagnostics (ALT+F2) menu. We support 3 profiling modes for the Memory Usage tool. You can set this using the Settings link available next to the Memory Usage tool prior to starting a profiling session.
1. Managed: For managed applications, the profiler only collects managed heap information by default. Managed heap profiling is done by capturing a set of CLR ETW events in the profiler.
2. Native: For native applications, the profiler only collects native heap information. For collecting native heap information, we enable stack tracing and the collection of heap traces (ETW) which are very verbose and will create large diagsession files.
3. **Mixed: **Information for both the managed and native heap is collected in this mode. This is primarily used to analyze memory issues in hybrid applications. Because both managed and native allocations are being tracked, the diagsession files created are large.
**Note: **In this release, the Memory Usage tool cannot be used in combination with the other profiling tools.
For the purpose of this exercise we will set the profiling mode to Mixed as we have both native and managed components in our application. Let’s go ahead and click on Start.
**Ruler: **The ruler shows events of interest that happen in the application during the profiling session as well as the session timeline. Events that happen concurrently or within a very short period of time might get merged into a single mark. If you want to get your log messages to show up in the ruler you can use the new APIs in Windows 8.1 to do so. For more information see this MSDN sample.

Live Graph: When the application starts up, the Memory Usage tool starts displaying a live graph of the memory consumed by the application. The Private Bytes counter indicates the total amount of memory that a process has allocated, not including memory shared with other processes. This is the metric that is also used by the Windows Phone OS to monitor the memory consumption of an application.
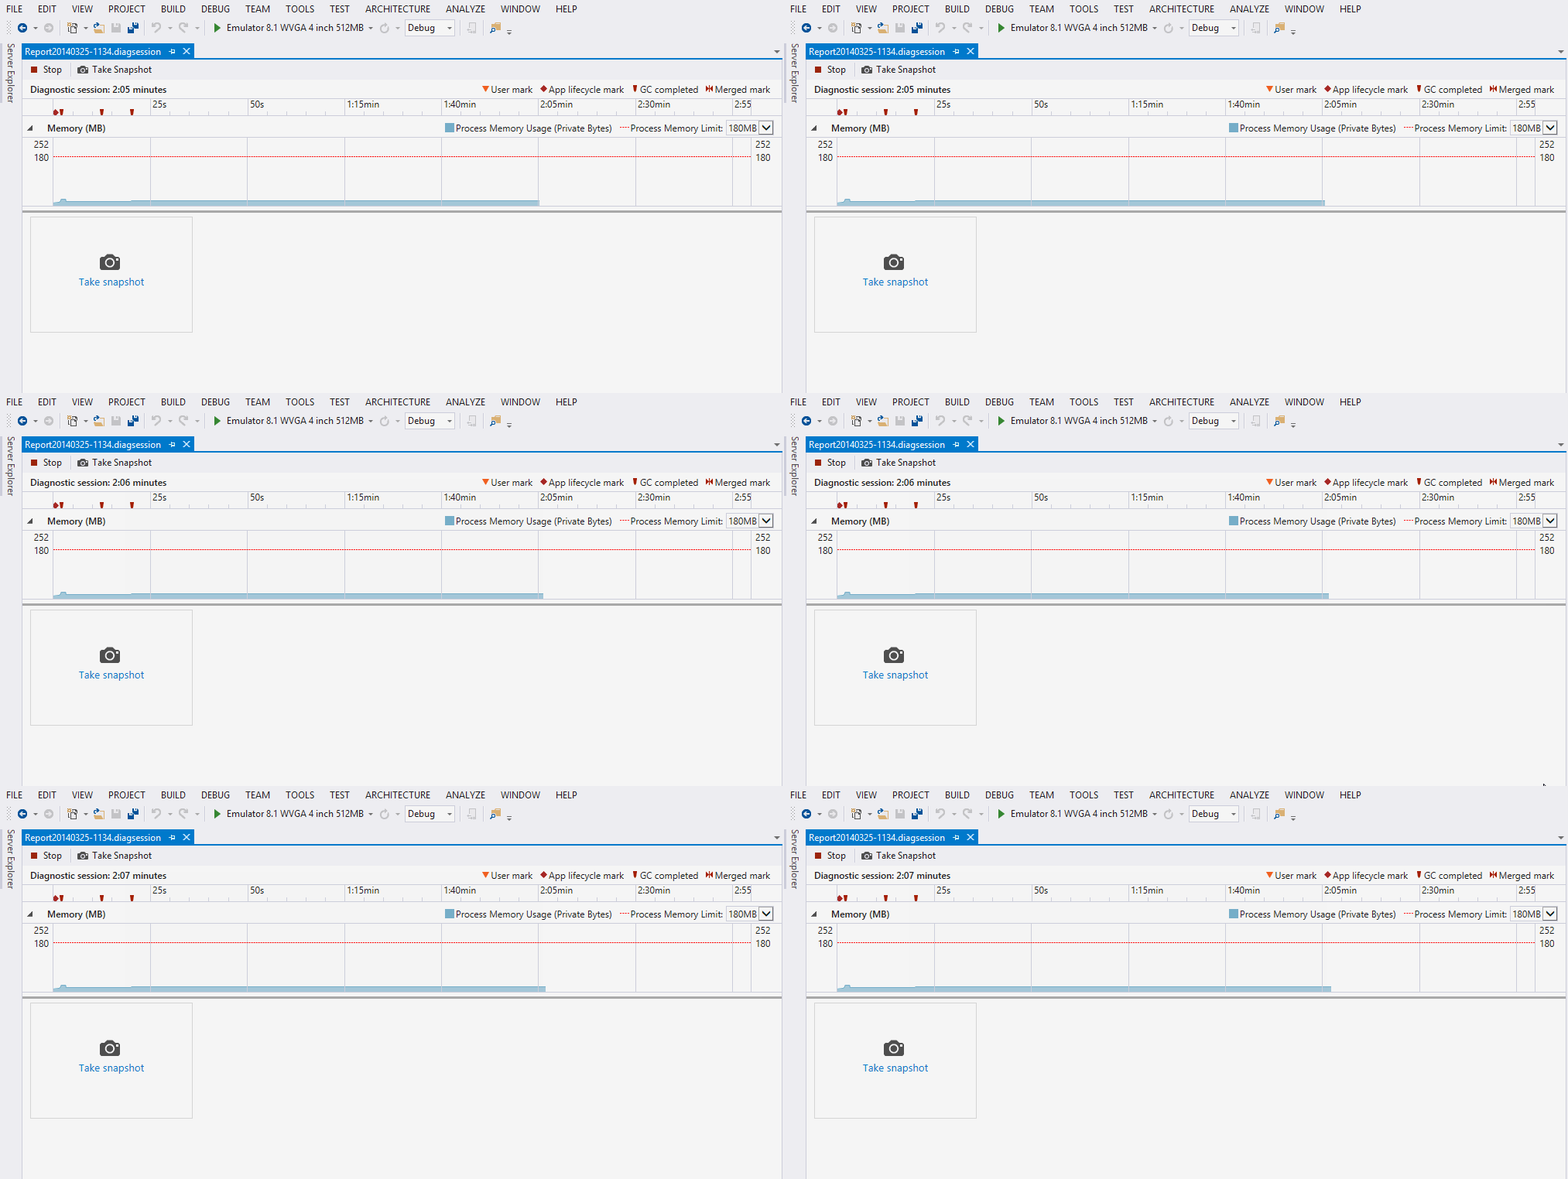
Memory Threshold: You will notice that a red dotted bar appears over the graph with a value of 180 MB. This is the maximum memory that can be allocated by an app on a Phone with 512 MB physical memory (lowest supported memory by the Windows Phone OS). Targeting the largest set of devices out in the wild enables you to maximize the monetary returns from your application. If you are developing only for 1 or 2 GB devices, you can choose to change the limit by selecting the right threshold in the graph.
Note: The threshold line only enables you to monitor application memory relative to the memory cap and does not in any way modify the memory limit on the device. Support for memory threshold is not available for Windows Store apps as there are no preset memory limits for those apps.
**Take Snapshot: **This is a snapshot based profiler which means you need to explicitly take snapshots in-order to capture the state of the application memory at that point in time. When the Take Snapshot button is clicked, the following actions are taken by the tool.
1) We request the CLR for heap information which in turn causes CLR to do a GC and generate heap information via ETW events. Underneath the covers, the analysis of this information is done the same way as done in the Dump Analysis tool in Visual Studio.
2) The time stamp at the point of command invocation is taken to determine the set of allocations and frees in the native heap till that point.
3) A screenshot of the application is taken. This helps you to relate the state of the app with its memory consumption across sessions. Note that this functionality is not available when the application is executing in the simulator.
Getting it to leak: Now let’s do the following operations in the sample application.
1) Click on an Image tile
2) Apply filter
3) Navigate back
4) Take a snapshot

Repeat the steps 1 – 3 a few times in the application and then take another snapshot. You will see that the application memory steadily increases and refuses to go down as you go through these steps. The next two sections of this post will help you understand how to use the data in these snapshots to troubleshoot and fix the memory issues in this sample application.
Troubleshooting managed memory
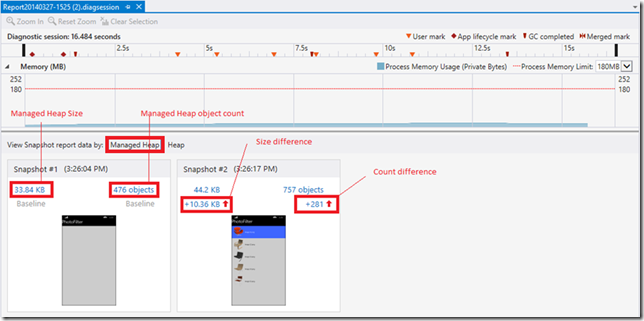
Once you stop profiling the profiler analyzes the results and populates the snapshot tiles with the following information
1) Managed Heap size: The total size of the managed heap at that point in the applications lifetime.
2) Managed Object count: The total number of objects in the managed heap including COM proxies like RCW and CCW’s.
3) Size difference: The first snapshot is treated as the baseline and this value is the difference in the size between successive snapshots.
4) Count difference: The first snapshot is treated as the baseline and this value is the difference in the object counts between successive snapshots.
First let’s go over some Managed Heap specific functionality we have built into the tool. Open the Count Difference link. You will see that managed heap information is aggregated by the type of the objects in the heap.
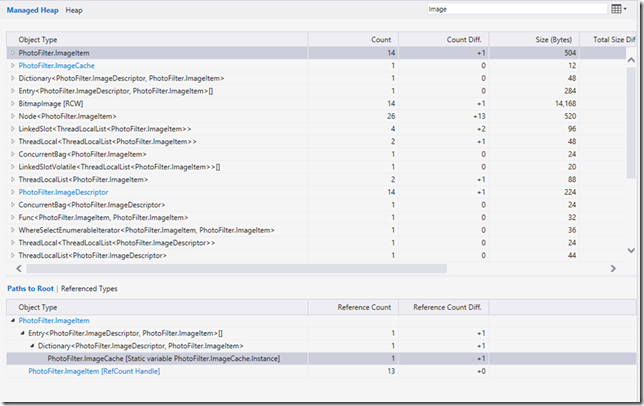
Paths to Root and Referenced Objects / Types: When you select a type or an instance, you can see its GC roots as well as its references. This is the primary view that you will be using to understand why certain types or instances are not being collected during a garbage collection run. An object can have multiple roots and the leaf nodes in the tree view are the GC roots. For example, ImageItem cannot be collected during GC as it is rooted by a static instance whose lifetime is the same as the application.


Just My Code: The CLR during application boot up and execution might allocate a number of objects on its behalf. The Just My Code filter, which is set by default, removes these objects from the list and folds their cost into their roots thus reducing the number of system objects visible in the list. The list of types that can be filtered out is currently internal to the tool and cannot be customized in this release.
Collapse small objects: There might be large number of objects in the managed heap. Sifting through this data can be time consuming and sometimes does not help in any way in solving the problem. Collapse small objects is a filter which is set by default that removes relatively small objects (objects whose size is less than .5% of the total heap) from the list and associates their cost to their roots.

Let’s take a look at our sample app now and fix the memory leak.
When you open Count Difference link you will see right off the bat that there are four*(based on number of times you navigated before taking the second snapshot) instances of ImagePage. You would expect this object to get collected when you navigate back to MainPage but for some reason the instances of this page are being kept alive.
Note: XAML types are allocated on the native heap and the CLR interacts with them through the COM proxies. Even if you only see a relatively small increase in the managed heap size due to a WINRT type leaking, it might translate to a large increase in the native heap. So it’s important to optimize memory consumed by WINRT objects that are referenced in the managed heap.

On selecting this type you will see that in *Paths to Root *this type is being kept alive by WindowsSizeChangeEventHandler. Clicking on the type name in the row will take you to its definition.

You will notice that in the code we have registered a listener to this event but have failed to unregister while navigating away from the page. Unregistering the event handler will cause the page to get collected in the next GC and will force the native resources to get released as well.
1:
2: protected override async void OnNavigatedTo(NavigationEventArgs e)
3: {
4: base.OnNavigatedTo(e);
5: ImageDescriptor descriptor = (e.Parameter as ImageItem).GetDescriptor();
6: var image = await ImageItem.FromDescriptor(descriptor);
7: await image.FetchPicture();
8: imgSelectedImage.Source = await image.GetPictureAsync();
9: this.DataContext = image;
10: Window.Current.SizeChanged += WindowSizeChanged;
11: }
12:
13: protected override void OnNavigatedFrom(NavigationEventArgs e)
14: {
15: base.OnNavigatedFrom(e);
16: //Uncomment to free the page
17: //Window.Current.SizeChanged -= WindowSizeChanged;
18: }
Before

After

If you run the app after making the above changes you will notice that the memory consumption in the app will have reduced considerably. Now that you have solved the leak in the managed heap, let’s move on debugging the leak in the native heap. In order to do that, let’s go to the document tab that shows the snapshots and switch to the native heap snapshot summary.
Troubleshooting native memory
The Heap snapshot view shows the following information for the snapshots
1) Native Heap size: The total size of the native heap at that point in the applications lifetime
2) Native Heap allocation count: The total number of allocations in the native heap.
3) Size difference: The first snapshot is treated as the baseline and this value is the difference in the size between successive snapshots.
4) Count difference: The first snapshot is treated as the baseline and this value is the difference in the allocation counts between successive snapshots.
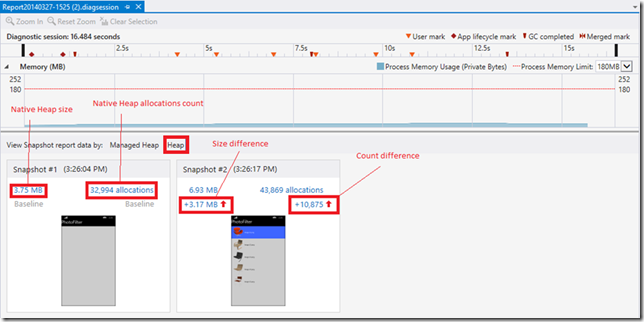
Before we get on to the serious business of troubleshooting the leak, let’s go over some native heap specific functionality we have built into the tool. Let’s go ahead and open the Count Difference link on the second snapshot. Information in the native heap view is aggregated by the frames in the call stack. Selecting a frame will show all the allocations that can be attributed to that function in the allocation list.
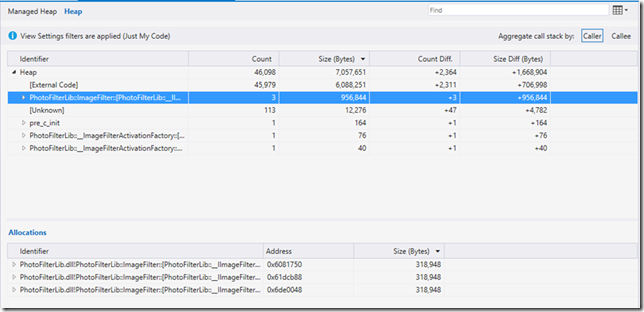
Callers and Callees view: You can choose to switch between Callers and Callees while viewing the aggregated data. The Callers view brings the function that allocated memory to the front while the Callees view helps you trace allocations from the root of the call stack. By default, the native heap view is set to Callers view and you can change this by using the Aggregate by toggle button.

Just My Code: By default we pre-apply the Just My Code filter when you open a native details view. This brings your user code front and center. We use an internal list to determine our Just My Code functionality. You can choose to turn this off if you would like to see external code in this view by deselecting the filter.
Note: If you haven’t set up the connection to the Microsoft symbol server you might see a large number of unresolved frames. This is because Visual Studio needs symbol files in order to resolve call stacks from system assemblies. You can enable Microsoft Symbol Servers from Tools -> Options -> Debugging -> Symbols. If you have a session file opened, you will need to save and reopen the file for the changes to take effect.
Include Freed Allocations: Freed allocations are an important aspect while troubleshooting app responsiveness issues resulting due to a large number of transient allocations happening in a short interval. You can choose to enable this view by selecting the Include Freed Allocations filter which forces the tool to aggregate freed allocations as well.

Cull List: We remove common allocation functions like RTLAllocateHeap from the call stack as we believe this information to be primarily redundant. You can choose to override our default cull list by using the techniques below.
1) If you don’t want any frames to be culled. Create an empty txt file and add its location to the registry using the below command
2) If you want to specify a custom list of frames to be culled then create a txt file with the specific frames in mind (Format: ModuleName!FrameName and separated by a newline) and use the below command to add its location to the registry.
REG ADD HKCUSoftwareMicrosoftVisualStudio12.0_ConfigMemoryProfiler /v CustomCullListLocation /t REG_SZ /d “
Search: We support searching for specific call frames in the native heap view. This can be accomplished by using the Search box and using either the ‘Enter’ or the ‘F3’ key to search for successive frames that match your input.

Now onto fixing the leak. With the Diff view opened, you will notice that AntiqueImage is the user function that seems to be allocating the most memory. Also there are 3 new (Count Diff.) instances of allocations made inside this function that are still alive which corresponds to the number of times the Filter function was called (User Mark in the ruler).
At this point you will require knowledge of the app you are building to troubleshoot why this function seems to keep 3 allocations alive. You would expect the filtering function to do its job and not leave any memory behind.
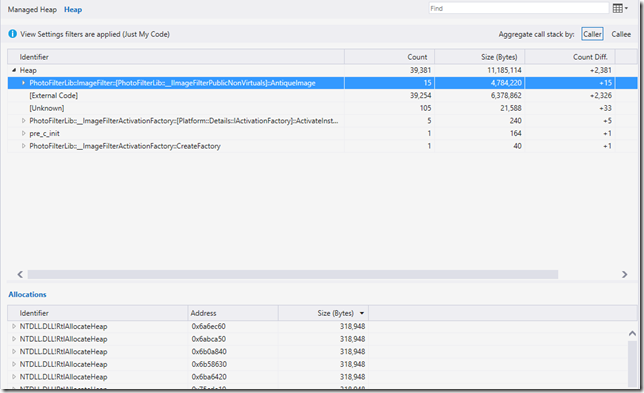
Opening the source for this function shows that we are not cleaning up the byte array that was allocated during its execution.
1: Platform::Array<unsigned char>^ ImageFilter::AntiqueImage(const Platform::Array<unsigned char>^ buffer)
2: {
3: auto pixels = ref new Platform::Array<unsigned char>(buffer->Length);
4: byte* computeBuffer = new byte[buffer->Length];
5:
6: for (unsigned int x = 0; x < buffer->Length; x += 4)
7: {
8: int rgincrease = 100;
9: int red = buffer[x] + rgincrease;
10: int green = buffer[x + 1] + rgincrease;
11: int blue = buffer[x + 2];
12: int alpha = buffer[x + 3];
13:
14: if (red > 255)
15: red = 255;
16: if (green > 255)
17: green = 255;
18:
19: computeBuffer[x] = red;
20: computeBuffer[x + 1] = green;
21: computeBuffer[x + 2] = blue;
22: computeBuffer[x + 3] = alpha;
23: }
24:
25: for (unsigned int x = 0; x < buffer->Length; x ++)
26: {
27: pixels[x] = computeBuffer[x];
28: }
29:
30: // Uncomment to free memory
31: //delete[] computeBuffer;
32: return pixels;
33: }
Before
![clip_image001[6] clip_image001[6]](https://devblogs.microsoft.com/devops/wp-content/uploads/sites/6/2014/04/0871.clip_image0016_thumb_0627B122.png)
After

Rerunning the profiling session after deleting the byte array before returning the pixels seems to solve the memory leak in user code in the native component. Now if you run the app after solving both the managed and native memory leaks you can see that the application memory consumption across navigations and filtering operations remain almost unchanged.
It is recommended that you do performance profiling on a device instead of an emulator or simulator as they have different performance characteristics when compared to an end user device. In order to do Memory Profiling on a device you will need to install a Developer Update package after unlocking your Phone.
We need your feedback!
We are interested in knowing more about what you think about these experiences and what you would like to see in the Performance and Diagnostics hub going forward. Please send us your feedback through replies to this post, Connect bugs, User Voice requests, the MSDN diagnostics forum or the new Send a Smile button inside Visual Studio.


0 comments