
With Visual Studio 2022, we promise to bring new tooling to improve the inner loop productivity and debugging experience. In addition, we have several exciting debugging updates, and the new Attach to Process dialog experience is one of them.
We have added command-line details, app pool details, parent/child process tree view, and the select running window from the desktop option in the attach to process dialog. These make it convenient to find the right process you need to attach. Also, the Attach to Process dialog is now asynchronous, making it interactive even when the process list is updating. All these features should be available in the latest Visual Studio 2022 preview version.
Let’s check them out!
Command-Line and AppPool details in Attach to Process dialog
When debugging multiple ASP.NET Core applications, numerous instances will show as dotnet.exe’s in the available process list.
Similarly, when you have multiple web applications running with multiple application pools on your machine, they will create multiple worker processes (W3WP.exe). To make sure the Visual Studio debugger pauses at your breakpoint you need to select the right worker process that belongs to the target web application.
For both the above scenarios, figuring out the process to attach to was challenging. To find the right process you will need to get the PID using tools such as Task Manager and then use command line details to determine the right dotnet.exe process or use appcmd.exe utility to determine which PID belongs to which IIS process. Finally, select that process in the attach to process dialog to attach with the debugger.
Starting VS2022 Preview 2 you will see all these details in the Attach to Process dialog itself. We have added a new Command-Line column or App Pool details in the Title column when applicable, so you don’t need to go back and forth with other tools to differentiate between identical-looking processes.
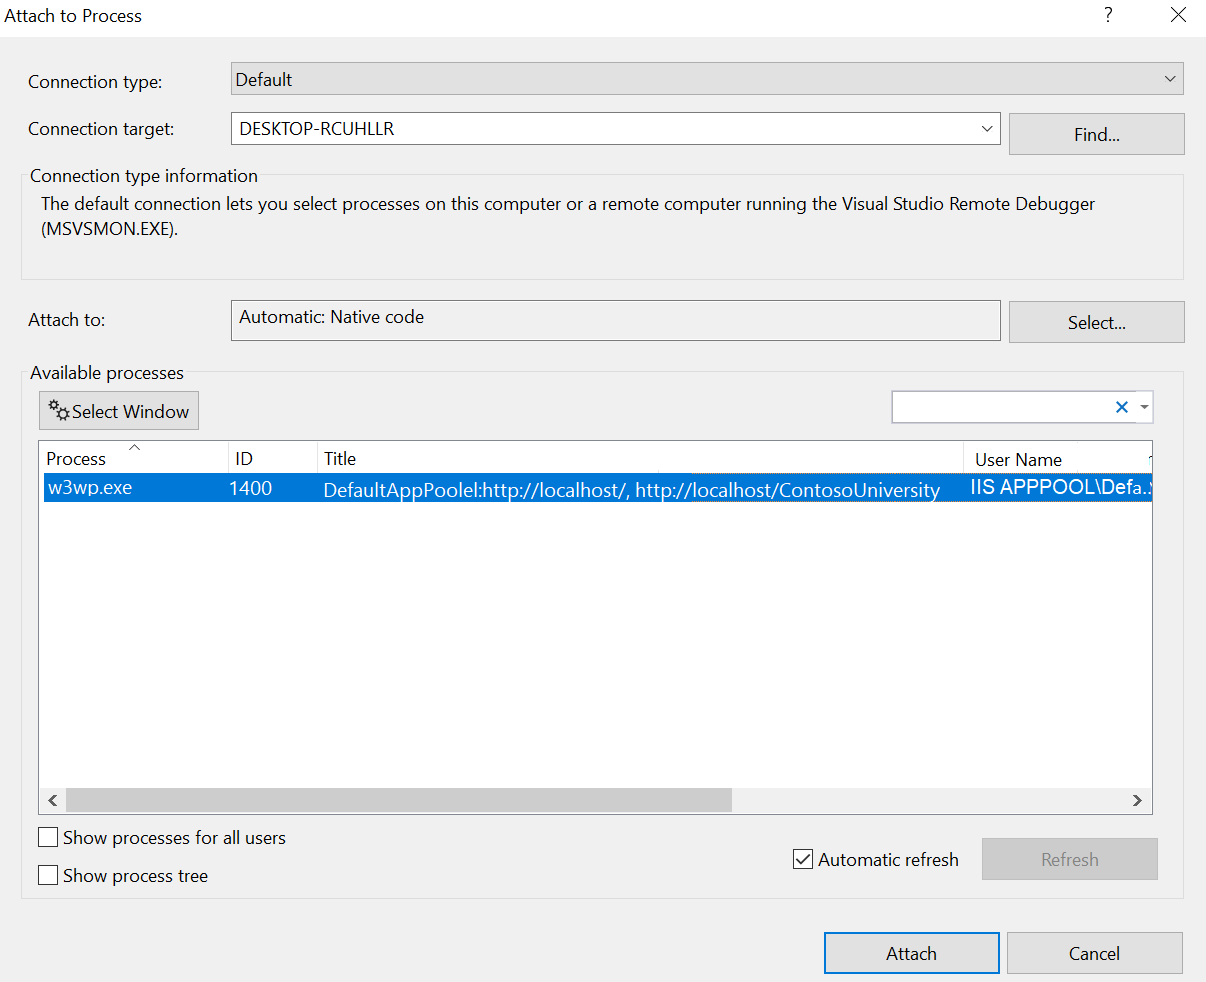
Attach to Process dialog: AppPool details in the Title column
Automatic refresh Process View
When checked, the auto-refresh checkbox will refresh the process list automatically with the available processes. Thus, the process list gets updated asynchronously and gives the updated processes in real-time.
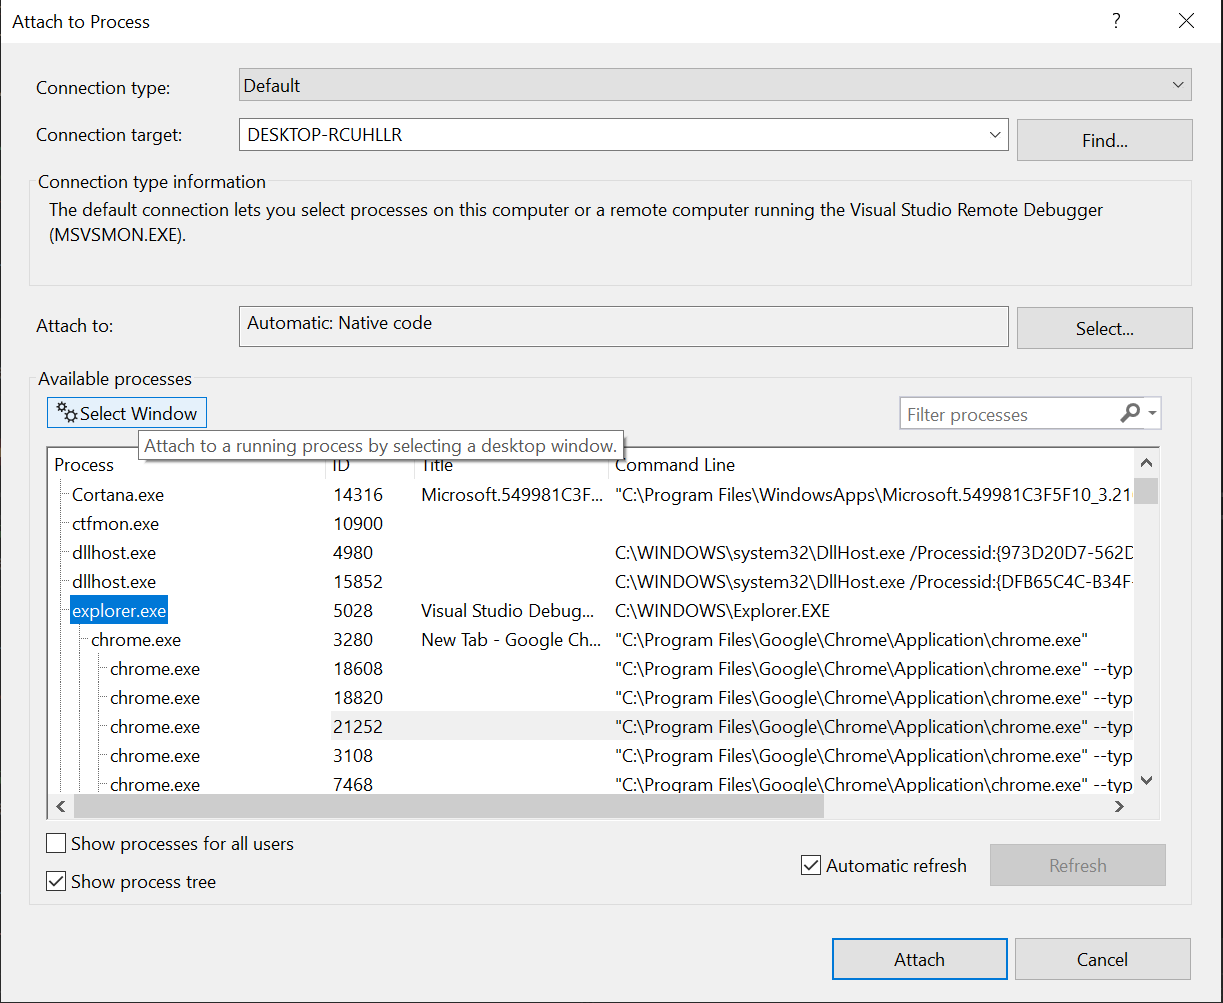
Show Process Tree
This checkbox will swap out available processes flat list to hierarchical parent-child view. This could be helpful when the application you are debugging spawns multiple processes.
For e.g. if you are trying to debug Chromium, it can become challenging because of its multi-process architecture. When you select Run in the debugger, by default only the main browser process will be debugged. The code that renders web pages will be in separate child processes. The new process tree view can show you how these processes are related, making it easy to identify the right child process to attach to.
Attach to Process dialog: Process Tree View
Attach to running process from the desktop
The “Select Window” button under the Available Process lets you pick any running window/application and attach it to its associated process.
You don’t need to know the process name associated with that application or need to search through the processes list; you can conveniently point to the window on your desktop and attach it to the process in just couple of clicks.
Attach to Process dialog: Select running window process
Your feedback matters!
We want your help making Visual Studio 2022 the best developer experience for you. We encourage you to download Visual Studio 2022 Preview and try out these features. We appreciate your time in providing feedback via Developer Community, reporting a problem.
Hi,
Could someone provide me a link or doc on how we can debug the Azure Web App in VS2022?
Kind regards,
Jing
You can't do remote debugging in VS2022. At least not yet in the RC2. Or I couldn't find how to do it.
There used to be a Cloud explorer that made the process super easy. Just right click on the app service and select attach debugger. Done.
Now the Cloud explorer is also gone. So who knows.
Oh wait, RC means that it's already feature complete, only ironing bugs and no functionality missing. So maybe there is no remote debugging anymore. Or There is remote debug coming in the final version without giving the people a chance to try it and...
I would love for the “Reattach to Process” menu item to persist between sessions on the same Visual Studio solution. It is a minor inconvenience but it helps saving time re-selecting a process, and it also helps when re-opening solutions I haven’t worked with in a while.
Yes ! And I’d ask for ability to add filter “only my projects”. Since believe I really never ever debug processes like chrome.exe, conhost.exe or GoogleCrashHandler.exe
Seems like a useful improvement, but is it really that hard to also have it support dark mode?
First thing that came to my mind when i read the title: I hope it is themed according to Visual Studio itself. It just hurts my eyes when everything else is dark, and one dialog is white.
thanks for the feedback. Yes, we are looking into improving the support with the dark theme and themes in general. For now, I also created this suggestion ticket to track the request and more community input.
https://developercommunity.visualstudio.com/t/Theme-the-attach-to-process-dialog–with/1528641?entry=myfeedback
Hi @Harshada,
The ticket in the Developer Community site doesn’t exist, when clicking on the link you’ve provided, the site says:
“We were unable to get this feedback item. It could be because you don’t have access to it or it doesn’t exist
Error details: [“If you recently created this ticket, our systems are still syncing. Please refresh in 15-20 minutes and the ticket details should be available. Ticket with id ‘1528641’ not found”]”
Do you have the correct link for it? I would like to follow that ticket in the Developer Community site, thanks!
sorry, the link has been fixed now and you should be able to access the ticket.
We typically use ASP.NET Core projects with vue-cli for the front end. Debugging the REST API’S works like a charm. Debugging the SPA website is more of a console.log experience. Edge/Chrome developer tools kind of works. Is there any tlc for smooth front end debugging with VS2022?