New Dynamic Instrumentation Profiling for .NET

Sagar Shetty

With the release of version 16.9 of Visual Studio, instrumentation profiling in Visual Studio just got better. Introducing our new dynamic instrumentation tool. This tool shows the exact number of times your functions are called and is faster than our previous static instrumentation tool. It also supports .NET Core instrumentation without needing PDBs.

Image 16 9 P3 dynamic instrumentaion

Try it yourself!

You can access the dynamic instrumentation tool by launching the Performance Profiler for a .NET Project in Visual Studio (Debug -> Performance Profiler or Alt-F2). Once you are on the summary page, select the Instrumentation checkbox.

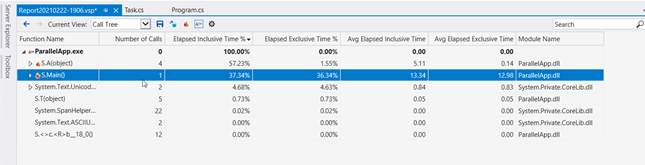
When it comes to profiling there’s two mechanisms of collecting data. Collection via instrumentation or via sampling. With instrumentation, every function call in your application is annotated and instrumented so that when it gets invoked it’s added to the trace along with information about the caller. With sampling, the current call stack executing is polled from the CPU at an interval and then each frame is added to the trace.

The value of sampling is that it has less overheard and is thus more likely to be statistically representative of the application running in production. The value of instrumentation profiling is that you can get exact call counts on how many times your functions were called. This gives you much more detailed information than normal sampling profiling cost of distorting the time taken in some scenarios. For example functions that don’t do much, but are called frequently will show up more than they would in the real world.

Image instrumentation call counts

With the new dynamic instrumentation scenario there are a few more benefits. First you should see performance improvements in how quickly the tool is able to run. This is because we no longer need to use VSInstr to use instrumentation in this scenario.

Second, our dynamic instrumentation supports .NET Core projects without PDBs. Before you had to modify your build to produce full PDBs in order to use instrumentation. Ultimately, this means you can run your projects as is without needing to do any extra work to instrument your managed code.

Finally, we have architected this instrumentation tool to not require modifying your assembly files. This means that we won’t accidentally break any signing you may have and be able to instrument all your managed code.

Come talk with us!

If you want to speak with our engineering team on how we can improve this tool, please fill out the survey below. We will be reaching out to customers soon.

Happy profiling!

14 comments

Discussion is closed. Login to edit/delete existing comments.

  • Leo,Anoop 0

    Hi Sagar
    Is there an option to run this without visual studio
    Previously there was a standalone profiler which we could run, do we have something like that
    We have a requirement to run profilers both sampling and instrumentation but without visual studio

    • Patrick Nelson (VS)Microsoft employee 0

      Hello Anoop,
      Running the dynamic instrumentation profiler without a Visual Studio install is not officially supported yet, but it should work if you copy the required binaries to the machine where you want to perform profiling, set some environment variables, and go through a non trival set of steps.

      Here are the environment variables you need to set: It’s important to set these in a separate command prompt as they will affect every managed app you run.

      COR_ENABLE_PROFILING=1
      COR_PROFILER={324F817A-7420-4E6D-B3C1-143FBED6D855}
      CORECLR_ENABLE_PROFILING=1
      CORECLR_PROFILER={324F817A-7420-4E6D-B3C1-143FBED6D855}
      COR_PROFILER_PATH_32="C:\Program Files (x86)\Microsoft Visual Studio\2019\Preview\Common7\IDE\CommonExtensions\Platform\InstrumentationEngine\x86\MicrosoftInstrumentationEngine_x86.dll"
      CORECLR_PROFILER_PATH_32="C:\Program Files (x86)\Microsoft Visual Studio\2019\Preview\Common7\IDE\CommonExtensions\Platform\InstrumentationEngine\x86\MicrosoftInstrumentationEngine_x86.dll"
      COR_PROFILER_PATH_64="C:\Program Files (x86)\Microsoft Visual Studio\2019\Preview\Common7\IDE\CommonExtensions\Platform\InstrumentationEngine\x64\MicrosoftInstrumentationEngine_x64.dll"
      CORECLR_PROFILER_PATH_64="C:\Program Files (x86)\Microsoft Visual Studio\2019\Preview\Common7\IDE\CommonExtensions\Platform\InstrumentationEngine\x64\MicrosoftInstrumentationEngine_x64.dll"
      MicrosoftInstrumentationEngine_ConfigPath32_PerfProfiler="C:\Program Files (x86)\Microsoft Visual Studio\2019\Preview\Common7\IDE\CommonExtensions\Platform\DiagnosticsHub\x86\PerfProfiler.config"
      MicrosoftInstrumentationEngine_ConfigPath64_PerfProfiler="C:\Program Files (x86)\Microsoft Visual Studio\2019\Preview\Common7\IDE\CommonExtensions\Platform\DiagnosticsHub\amd64\PerfProfiler.config"
      VSPERF_MODULES=ModuleYouWantToInstrument.dll;MoreModulesToInstrument.dll
      VSPERF_EXCLUDE_SMALL_FUNCTIONS=1

      You’ll need to locate the binaries in the VS install, copy them to the machine where you want to do the collection and modify the paths accordingly. You’ll also need to copy the contents of “C:\Program Files (x86)\Microsoft Visual Studio\Shared\Common\VSPerfCollectionTools\vs2019” to the machine doing the collection. Include that directory in the path in order to run “vsperfcmd.exe”. “VSPERF_MODULES” is a semicolon delimited list of modules to instrument. If you omit it, the profiler will instrument everything.

      Create a .cmd with the following commands and run it in a different command prompt:

      VSPerfCmd /start:trace /output:report.vsp
      pause
      VSPerfCmd /shutdown

      While paused, run your app from the command prompt with the environment variables set above. Once you are done collecting instrumentation data, allow the paused command prompt to resume. This will create a .vsp file that you can open with Visual Studio on a development machine.

      Finally, if this is an important scenario for you, please add suggestion here: https://docs.microsoft.com/en-us/visualstudio/ide/suggest-a-feature?view=vs-2019. Having votes for supporting standalone collection will allow us to prioritize making this officially supported and easier.
      Thank you for using Visual Studio!
      -Patrick Nelson
      Visual Studio Diagnostics Team

  • Roman Charnashei 0

    Currently in Microsoft Visual Studio Community 2019 Version 16.9.0 in ASP .NET 5 application check box “Instrumentation” placed in “Not Applicable Tools” and disabled, was it intended ? How to make it available ?

    • Patrick Nelson (VS)Microsoft employee 0

      Hello Roman,
      I tried this myself and Instrumentation shows up as an applicable tool. Make sure no other tools are selected as Instrumentation is only available if no other tools are selected. If that’s not the problem, do you have a sample project that I try locally to see what’s going on?
      -Patrick Nelson
      Visual Studio Diagnostics Team

      • formalist@gmx.com 0

        Patrick,
        this happens also for ASP.NET Core 3.1. I just created a new ‘ASP.NET Core Web API’ (or ‘ASP.NET Core Web app’) project , targeted .NET Core 3.1, selected Debug -> Performance Profiler, and the ‘Instrumentation’ options is in the ‘Not applicable tools’.
        I have the 16.9.0. Enterprise.

          • formalist@gmx.com 0

            > It may take 20 min or so to show up

            after more than 24 hours, it still doesn’t show up 🙁

  • Carlos Rodrigues Batista 0

    dont know about you guys but after installing Vs2019 update 16.9.0 everytime when i click on any menu Vs crashes
    how i will explain this to my bosses ?.
    “microsoft making our lives worse Again!”

    • Jorge Morales Vidal 0

      Please open a case in the Developer Community portal with the details of the problem you’re seeing.

  • Chris DaMour 0

    this post could use some screenshots or links to better docs IMO

  • formalist@gmx.com 0

    (it seems I can’t edit a comment, adding a new one)

    Regarding the unavailability of the Instrumention tool for ASP.NET Core projects, I just found this post where they said (in March, 13, 2020) that “[…] the Instrumentation tool currently only works for ASP.NET framework, it has not been updated to work with .NET core yet”.

    Is that still true?

    • Sagar ShettyMicrosoft employee 0

      Hello formalist!

      This tool should work with .NET Core in addition to framework.

      Best,
      Sagar

      • formalist@gmx.com 0

        But it doesn’t 🙁

        A ticket was opened

  • Siber _ 0

    Are there specific contexts in which this tool is or isn’t available? Everything I’ve found about it reads to me like it should just replace VSInstr profiling in all situations, but after upgrading to a current version of visual studio choosing instrumentation on my current project still seems to launch the same old thing, which is doubly frustrating since I have problems getting that to work as well.

Feedback usabilla icon