


The latest Visual Studio update (v17.13) brings a strong set of debugging and profiling features designed to speed up troubleshooting, making it more efficient. With AI-driven features in this release, variable analysis and data inspection are smarter and more intuitive, and problems are easier to identify and debug. Profiling tool improvements also deliver better support and visualization for multi-process execution, native code, and async workflows, with clearer insights into performance bottlenecks. For a full list of debugger and diagnostics features in this release, check out the release notes.
GitHub Copilot Assisted Debugging Features
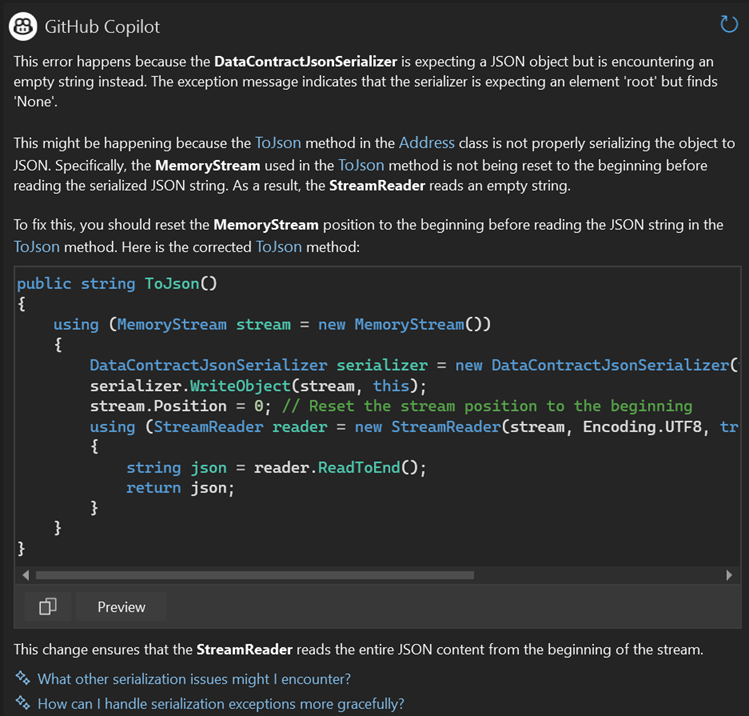
Smarter exception and variable analysis
GitHub Copilot Exception Analysis and Variable Analysis now use your project context intelligently to find and bring to your attention the most relevant code to errors.
With sharper, actionable insights and smarter, context-aware solutions, these capabilities can guide you to the root cause of issues more quickly, make your debugging workflow more streamlined, and provide greater overall accuracy in debugging errors.
AI-Powered Parallel Stacks window
Auto-Summarize in Parallel Stacks gives you AI-generated summaries so you can get a quick idea of what each thread is doing. Copilot Chat Integration with App Summarization goes a step further, identifying probable problems, recommending solutions, and enabling you to ask questions, get them explained, and get AI-powered suggestions—all in the context of your debugging session.
Combined, these tools simplify parallel debugging so you can diagnose and repair threading problems more quickly and confidently.

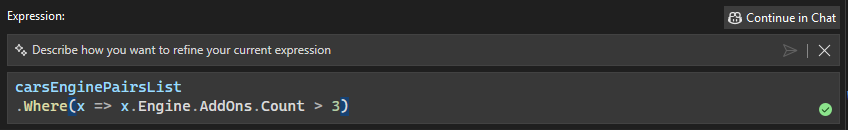
Enhanced Editable Expressions in IEnumerable Visualizer
The IEnumerable Visualizer now features GitHub Copilot Inline Chat, allowing you to refine editable expressions using natural language. Open a prompt with the Copilot sparkle button, tell it what you would like to change, and receive AI-generated LINQ queries for customized filtering your data. Including syntax highlighting to make it easier to read.
Profiling Features
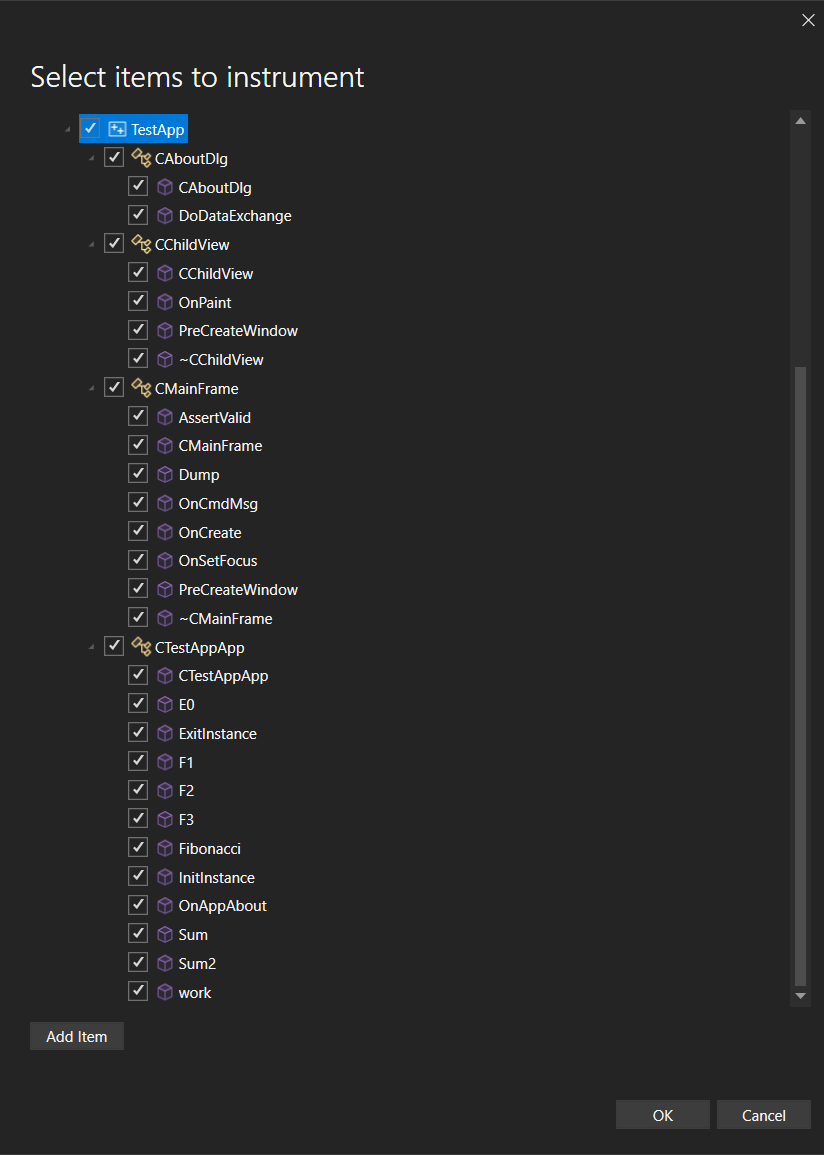
Targeted Instrumentation for native code
The Instrumentation tool in the Visual Studio now has targeted instrumentation for native code, allowing you to choose functions and classes to inspect thoroughly.
This improves performance monitoring and makes it easier for you to spot issues, streamlining your debugging experience.
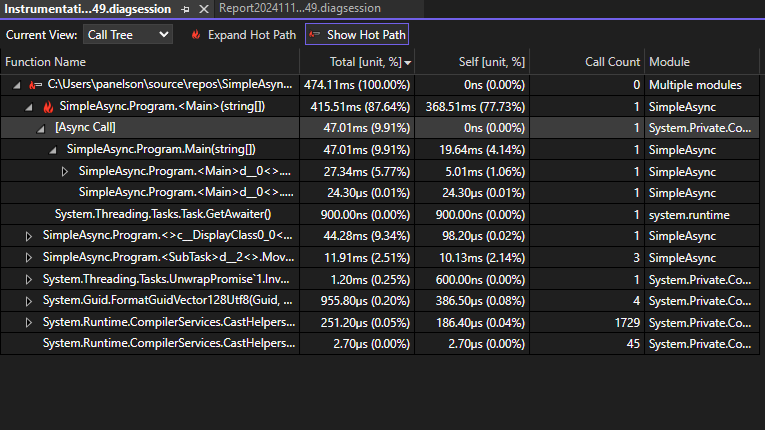
Display unified async stacks in profiler
The Visual Studio profiler now improves debugging of .NET applications by showing stitched async stacks in the summary and detail call tree windows.
This feature gives a more cohesive, clearer picture of asynchronous operations, making it easier for developers to follow the entire execution path, including asynchronous method calls, in a single, unified stack trace.
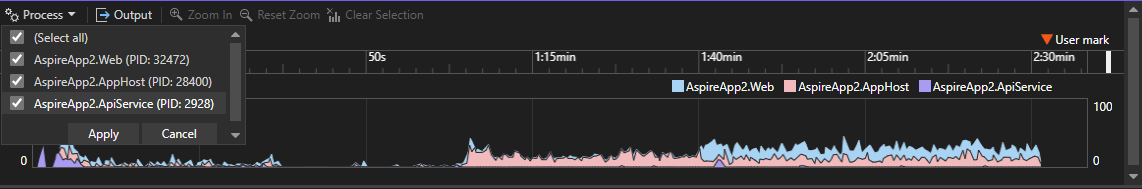
Multiprocess Analysis with Color-Coded Swimlanes in CPU Usage
CPU Usage tool in the Visual Studio profiler now supports multiprocess analysis, with performance graphs displayed as separate color coding for each process in swim lanes.
The graphs are displayed as stacked area charts. You can also filter processes by a dropdown at the top left, to enable focused analysis.
This enhancement enables you to profile and isolate CPU usage by process with ease in one session. Providing better visualization of resource usage, it optimizes profiling performance and simplifies multiprocess application performance tuning.
Thank you!
We aim to make your debugging and profiling experience as smooth and productive as it can be. We really appreciate the feedback and suggestions you provide, as that is what determines the direction of the tools you use daily. Never stop providing us with feedback, as we can keep making Visual Studio an excellent and user-friendly tool for developers like you.
Happy coding!
0 comments