For problems that do not manifest in logs or that you cannot investigate by debugging locally you might attempt to capture a diagnostics artifact, like a memory dump, while the issue is active in your production environment. However, upon talking to developers and support engineers we know that memory analysis can be time consuming, complex, and requires a skillset that can take years to perfect.
Our new .NET analyzers have been developed to help identify the key signals in your memory dump that might indicate a problem with your production service. This blog post details how to use Visual Studio’s new .NET Memory Dump Analyzer to find production issues by:
- Opening a memory dump
- Selecting and executing analyzers against the dump
- Reviewing the results of the analyzers
- Navigating to the problematic code
Finding async anti-patterns
Asynchronous (async) programming has been around for several years on the .NET platform but can been difficult to do well. There has been some confusion on the best practices for async and how to use it properly which has led to some antipatterns that may not reveal themselves until your service is under high load.
We talked to a bunch of support engineers and the “sync-over-async” antipatterns have a set of negative performance characteristics:
- Service response times are slower than normal.
- Increase in the number of requests resulting in timeouts.
- CPU and memory tend to remain within normal range.
Of course, at this point, there are still a wide range of underlying causes that might be at the heart of your problematic service behavior. Our team wanted to make it easier for developers to find these kinds of issues and also identify where you might remediate the problem.
In pursuit of this goal, we have started developing a new .NET Diagnostics Analyzer tool to help developers, new to dump debugging, quickly identify (or rule out) issues we know impact customers in production environments, let’s look at an example.
Automatic analysis of a memory dump
Let’s assume the service has been exhibiting the symptoms we noted earlier (timeouts, slow response times, etc.), how do you go about validating (or invalidating) the possible root cause?
Open the memory dump
First, let’s open the memory dump in Visual Studio by using the File ->Open -> File menu and select your memory dump. You can also drag and drop the dump into the Visual Studio to open it.
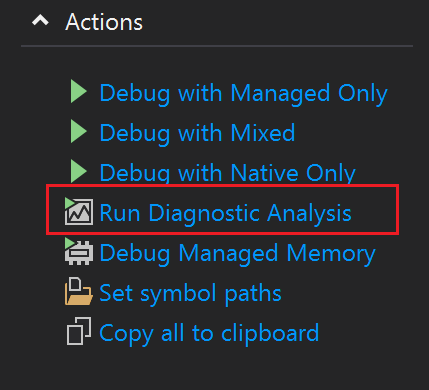
Notice on the Memory Dump Summary page a new Action called Run Diagnostics Analysis.
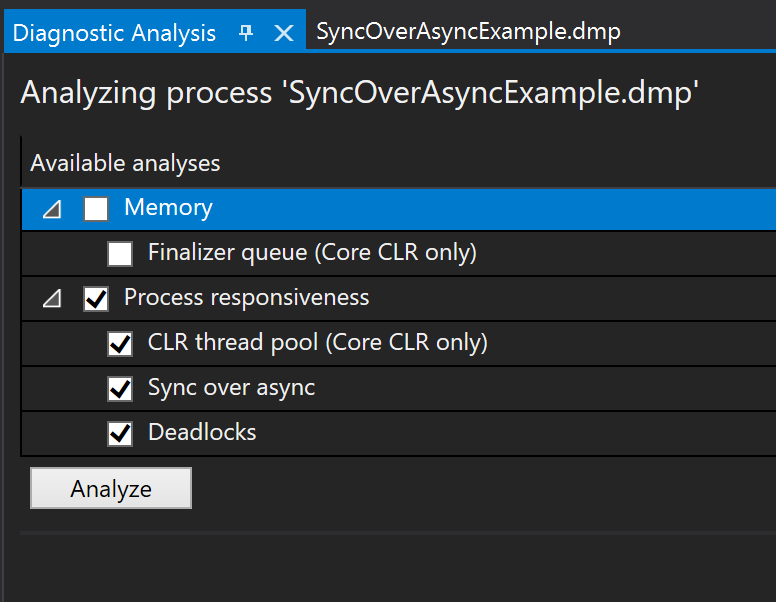
Selecting this action will start the debugger and open the new Diagnostic Analysis page with a list of available analyzer options, organized by the underlying symptom.
Selecting and executing analyzers against the dump
In my example I am concerned with my “app not responding to requests in a timely manner”. To investigate these symptoms, I am going to select all the options under Process Responsiveness as this best matches my app’s issue.
Hitting the Analyze button will start the investigation and present results based on the combination of process info and CLR data captured in the memory dump.
Reviewing the results of the analyzers
In the image below the analyzer has found two error results, and upon selecting the first result (“Thread pool is out of threads”) I get to see the Analysis Summary which is proposing that the “CLR thread pool is experiencing starvation”. This information is really important to an investigation, it suggests that the CLR has currently used all available thread pool threads, which in turn means we cannot respond to any new requests until a thread is released.
Selecting the second results “Thread pool is out of threads due to blocked async methods”, reveals the heart of the problem more specifically. By looking at the dump, the analyzer was able to find specific locations where we have inadvertently called blocking code from an asynchronous thread context, and this is leading directly to an exhaustion of thread pools.
The call out in this case is “Do not synchronously wait on Monitors, Events, Task, or any other objects that may block your thread. See if you can update the method to be asynchronous.”. My next job is to find that problematic code.
Navigating to the problematic code
By clicking on the Show call stack link Visual Studio will immediately switch to the threads that are exhibiting this behavior and the Call Stack window will show me all the methods that require further examination. I can quickly distinguish between my code (SyncOverAsyncExmple.*) from Framework code (System.*), and I can use this as the starting point of my investigation.
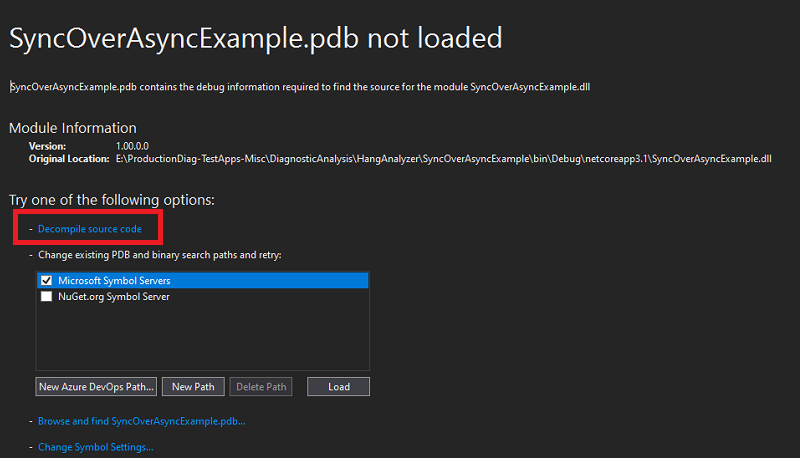
Each frame (or row) of a call stack corresponds to a method and by double-clicking on any of the stack frames I prompt Visual Studio to lead me to the code that led directly to this scenario on this thread. Unfortunately I do not have the symbols or the code associated with this application so on the Symbols not loaded page below I can select the Decompile Source code option.
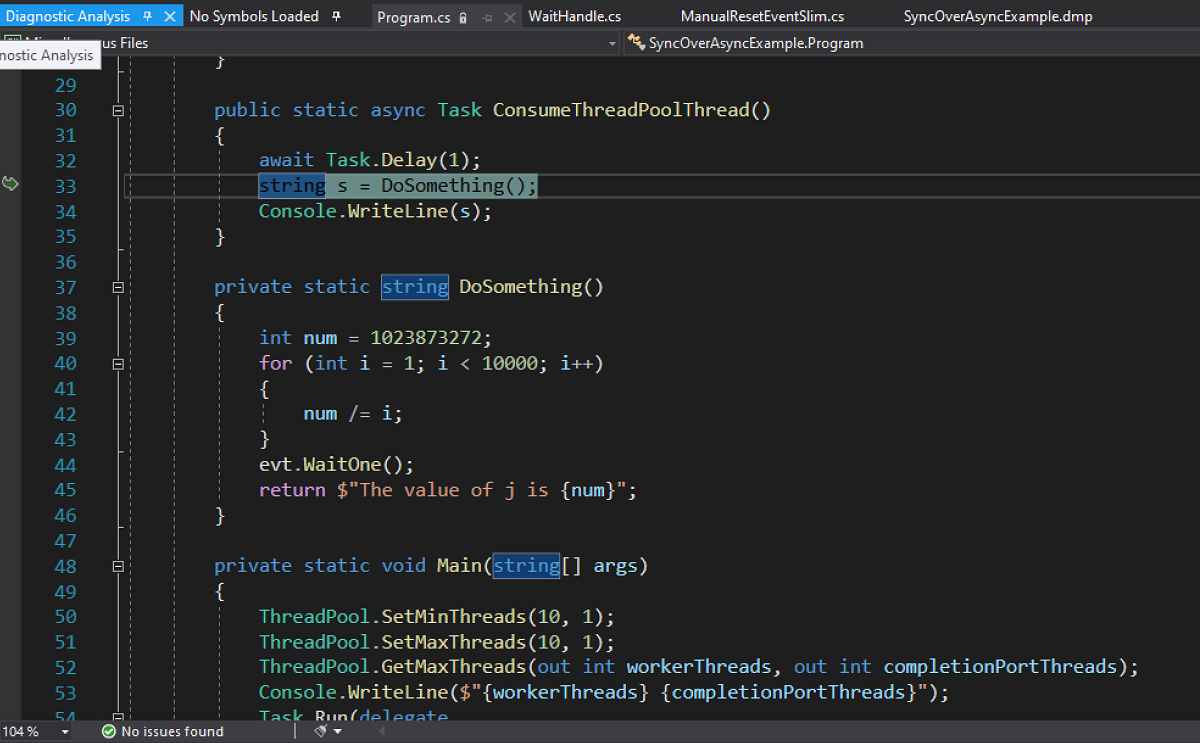
In the decompiled source below it is clear to me that I have an asynchronous Task (ConsumeThreadPoolThread) calling a function (DoSomething) that contains a WaitHandle.WaitOne method, which is blocking the current thread pool thread until it receives a signal (exactly what I want to avoid!). So to improve the responsiveness of my app I have to find a way to remove this blocking code from all asynchronous contexts.
Check it out now!
The new .NET Memory Analyzer tool makes it easier for developers and support engineers to get started debugging and diagnosing issues in memory dumps, allowing them to quickly root cause issues in production environments.
We currently support the following Analyzers with new and improved analysis coming in the very near future:
- Finalizer queue
- CLR thread pool
- Sync over async
- Deadlock detection
We believe there are many more problematic issues that can be quickly confirmed by using dump analyzers and we are hoping to get community feedback on which ones are the most important to you.
Please help us prioritize which analyzer to improve and build next by filing out this survey!


Log Name: Microsoft-Windows-Kernel-PnP/Configuration Source: Microsoft-Windows-Kernel-PnP Date: 2020-12-23 8:54:51 PM Event ID: 442 Task Category: None Level: Warning Keywords: User: SYSTEM Computer: LAPTOP-R4Q8O097 Description: Device USB\VID_04E8&PID_6860\R58M779M9JB was not migrated due to partial or ambiguous match. Last Device Instance Id: SWD\WPDBUSENUM_??_USBSTOR#Disk&Ven_RIM&Prod_Disk&Rev_1.0#97ADD97173AB3CEBE0F5680285DBC758852E1558&0#{53f56307-b6bf-11d0-94f2-00a0c91efb8b} Class Guid: {eec5ad98-8080-425f-922a-dabf3de3f69a} Location Path: Migration Rank: 0xF000FFFFFFFFF122 Present: false Status: 0xC0000719 Event Xml: 442 0 3 0 0 0x4000000000000000 672 Microsoft-Windows-Kernel-PnP/Configuration LAPTOP-R4Q8O097 USB\VID_04E8&PID_6860\R58M779M9JB SWD\WPDBUSENUM_??_USBSTOR#Disk&Ven_RIM&Prod_Disk&Rev_1.0#97ADD97173AB3CEBE0F5680285DBC758852E1558&0#{53f56307-b6bf-11d0-94f2-00a0c91efb8b} {eec5ad98-8080-425f-922a-dabf3de3f69a} 0xf000fffffffff122 false 0xc0000719
Thats how U find old memory dumps. You find out how and why they broke so we can repair the data before its broken any further so we can reuse it.
Hey Mark. I answered the survey but forgot to include this.
It would be very helpful if there was a more informative view over stack/stackframe sizes in general. We are currently going through a few really hard to debug StackOverflowExceptions and the information provided inside VS while checking the dump is very subpar.
A way to show the stack sizes for each thread, and being able to see what the stack frame sizes are for each call would be perfect for investigating the issue on our side. The only way to get some of this information today is through the stack pointer...
hey, when opening a 1GB full dump, i get nothing in the Managed heap window. did i do something wrong?
Hey Alexander,
You should have no problem opening a 1Gb memory dump, while it is is possible to run out of memory the threshold is much higher and you should receive a message about it, not a blank heap. Could you open a feedback ticket and I can get our engineers to start investigating?
First thank you for the nice article,
can you please elaborate on how to open Memory Dump, in the article, there is a statement “First, let’s open the memory dump in Visual Studio”
but I did not find a way to open that panel, I am using VS 2019 community
Thank you again, sir.
As noted you can do a File ->Open -> File and select your memory dump.
It your dump has no extension (managed Linux dump) you can use the Open-Open With option in the Open File window and select the Managed Linux Code Dump File Summary.
It is also possible to drag and drop the dump into the Visual Studio to open it.
File -> Open -> File (Ctrl+O)
select file type Dump Files if you want to filter, or see the corresponding file extensions.
Double clicking a dmp file should also work.
that was my problem too. thanks