Have you ever found a bug in your code and wanted to pause code execution to inspect the problem? If you are a developer, there’s a strong chance you have experienced or will experience this issue many, many times. While the short and sweet answer to this problem is to use a breakpoint, the longer answer is that Visual Studio actually provides multiple kinds of breakpoints and methods that let you pause your code depending on the context! Based on the different scenarios you may experience while debugging, here are some of the various ways to pause your code and set or manage a breakpoint in Visual Studio 2017:
While my app is running, how can I pause to inspect a line of code that may contain a bug?
The easiest way to pause or “break” execution to inspect a line of code is to use a breakpoint, a tool that allows you to run your code up to a specified line before stopping. Breakpoints are an essential aspect of debugging, which is the process of detecting and removing errors and bugs from your code.
- Select the left margin or press F9 next to the line of code you would like to stop at.
- Run your code or hit Continue (F5) and your program will pause prior to execution at the location you marked.
Where can I manage and keep track of all my breakpoints?
If you have set multiple breakpoints located in different areas or files of your project, it can be hard to find and keep track of them. The Breakpoints Window is a central location where you can view, add, delete, and label your breakpoints. If it’s not already visible, this window can be accessed by navigating to the top tool bar in Visual Studio and selecting Debug –> Window –> Breakpoints (or CTRL + ALT + B).
How can I stop execution only when my application reaches a specific state?
Conditional Breakpoints are an extended feature of regular breakpoints that allow you to control where and when a breakpoint executes by using conditional logic. If it’s difficult or time-consuming to manually recreate a particular state in your application to inspect a bug, conditional breakpoints are a good way to mitigate that process. Conditional breakpoints are also useful for determining the state in your application where a variable is storing incorrect data. To create a conditional breakpoint:
- Set a breakpoint on the desired line.
- Hover over the breakpoint and select the Settings gear icon that appears.
- Check the Conditions option. Make sure the first dropdown is set to Conditional Statement.
- Input valid conditional logic for when you want the break to occur and hit enter to save the breakpoint.
How can I break a loop at a certain iteration when debugging?
You can select the Hit Count option when creating a conditional breakpoint (see above) to specify a specific loop iteration where you want to halt your code. Instead of having to manually step through each iteration, you can use hit count to break at the relevant iteration where your code starts misbehaving.
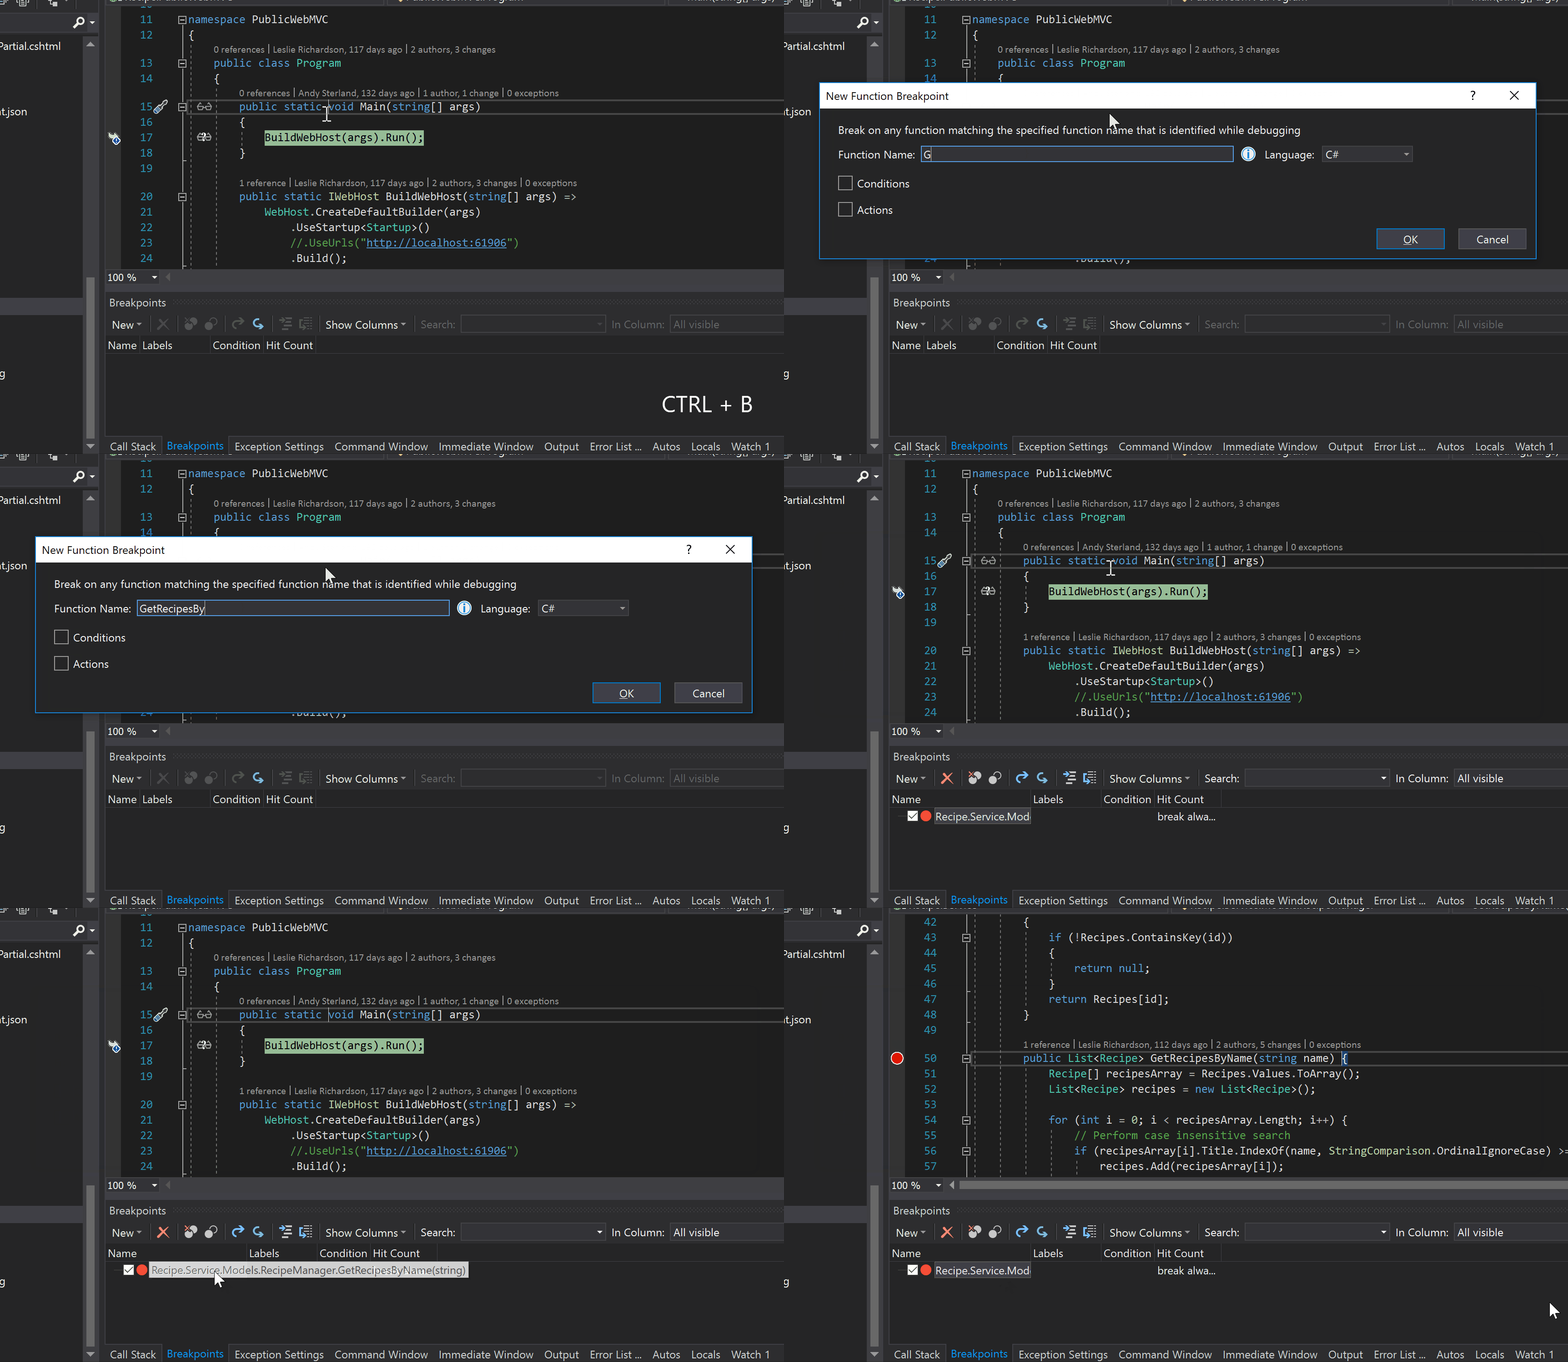
How can I break at the start of a function that I know the name of but not its location in my code?
Though a standard breakpoint can be used here, function breakpoints can also be used to break at the start of a function call. Function breakpoints can be used over other breakpoints when you know the function’s name but not its location in code. If you have multiple overloaded methods or a function contained within several different projects, function breakpoints are a good way to avoid having to manually set a breakpoint at each function call location. To create a function breakpoint:
- Select Debug –> New Breakpoint –> Break at Function.
- Input the desired function name and hit enter. These breakpoints can also be created and viewed via the Breakpoints Window.
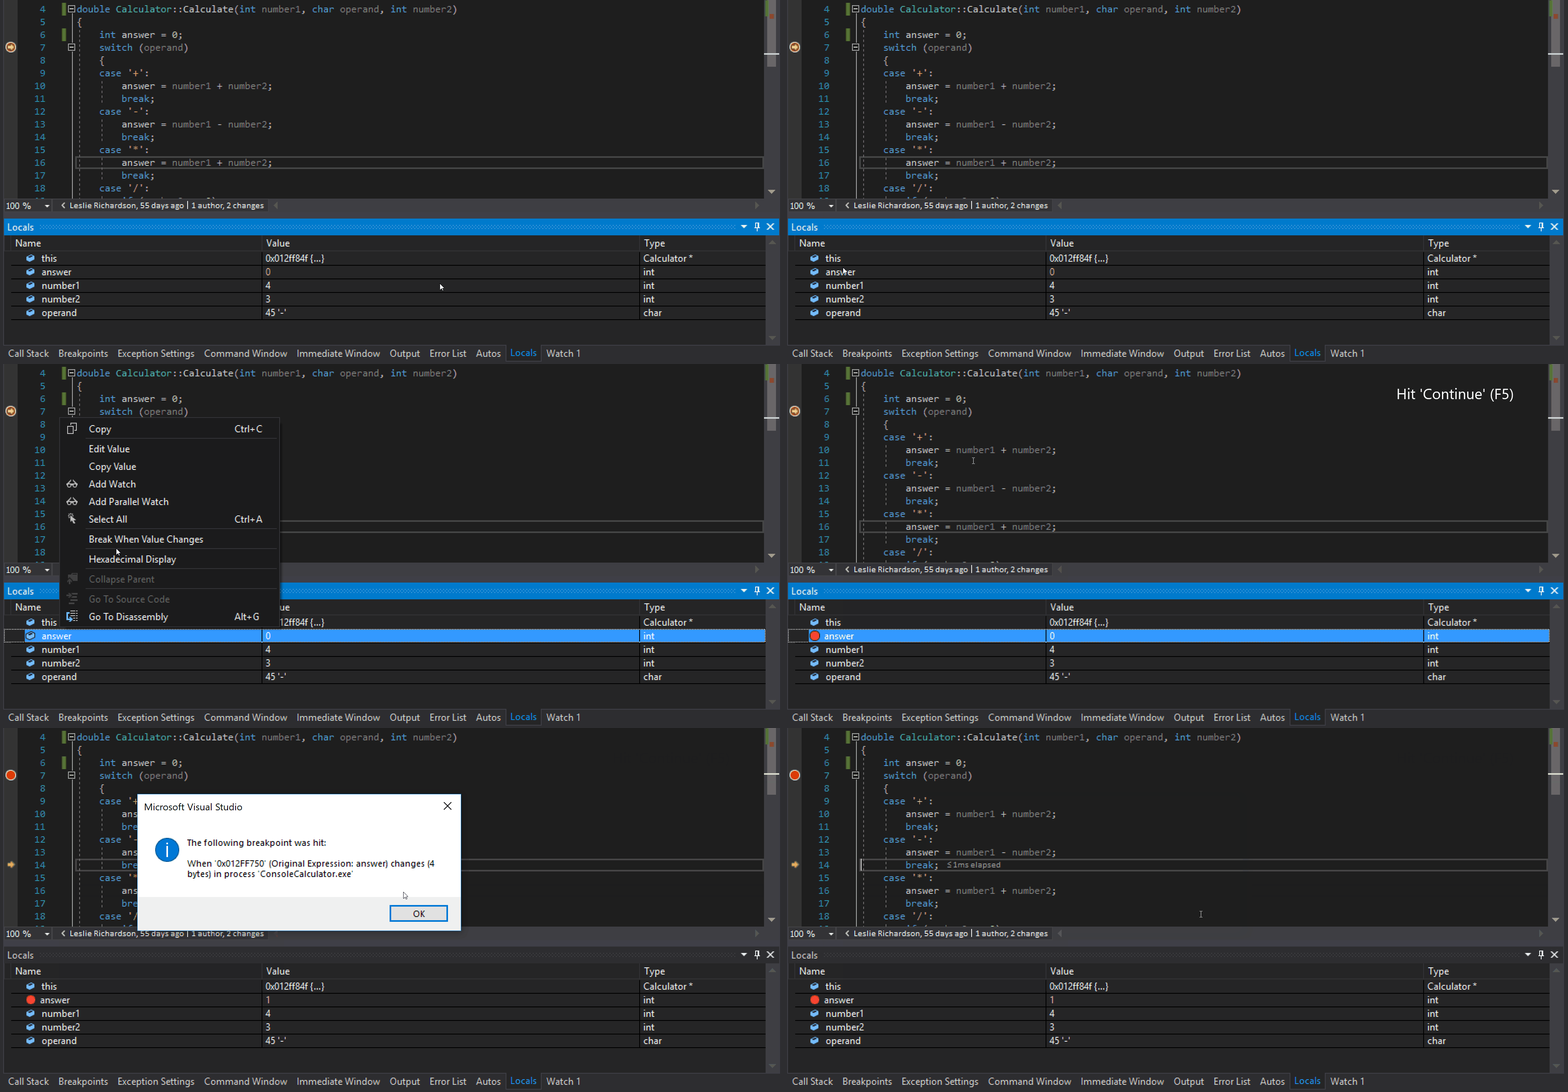
How can I break only when a specific object’s property or value changes?
If you are debugging in C++, data breakpoints can be used to stop execution when a particular variable stored at a specific memory address changes. Exclusive to C++, these can be set via the Watch Window or the Breakpoints Window. For more info on data breakpoints, check out this blog post on Data Breakpoints in Visual Studio 2017 version 15.8.
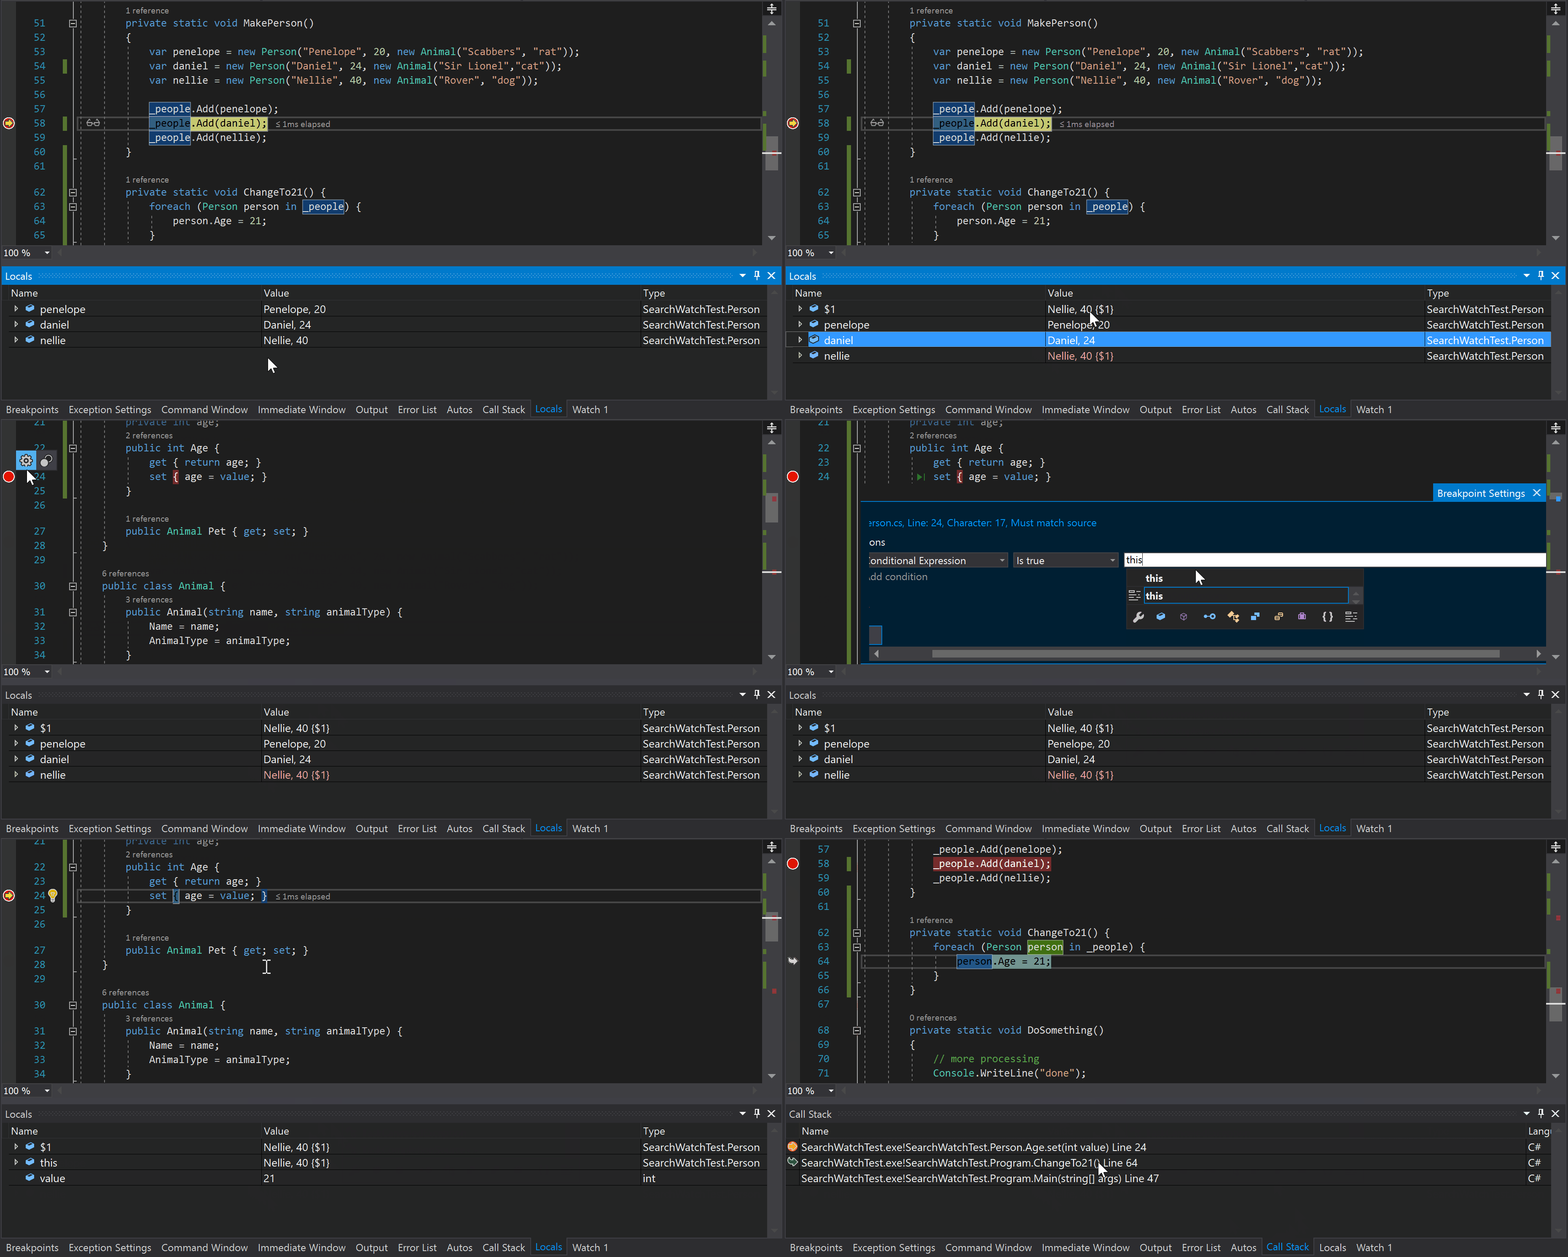
If you are debugging managed code, a current workaround and equivalent alternative to data breakpoints is to use an Object ID with a conditional breakpoint. To perform this task:
- In break mode, right click on the desired object and select Make Object ID, which will give you a handle to that object in memory.
- Add a conditional breakpoint to the desired setter where the conditional statement is “this == $[insert handle here].”
- Press Continue (F5) and you will now break in the setter when that particular property value changes for the desired instance.
- In the Call Stack, double click on the previous frame to view the line of code that is changing the specific object’s property.
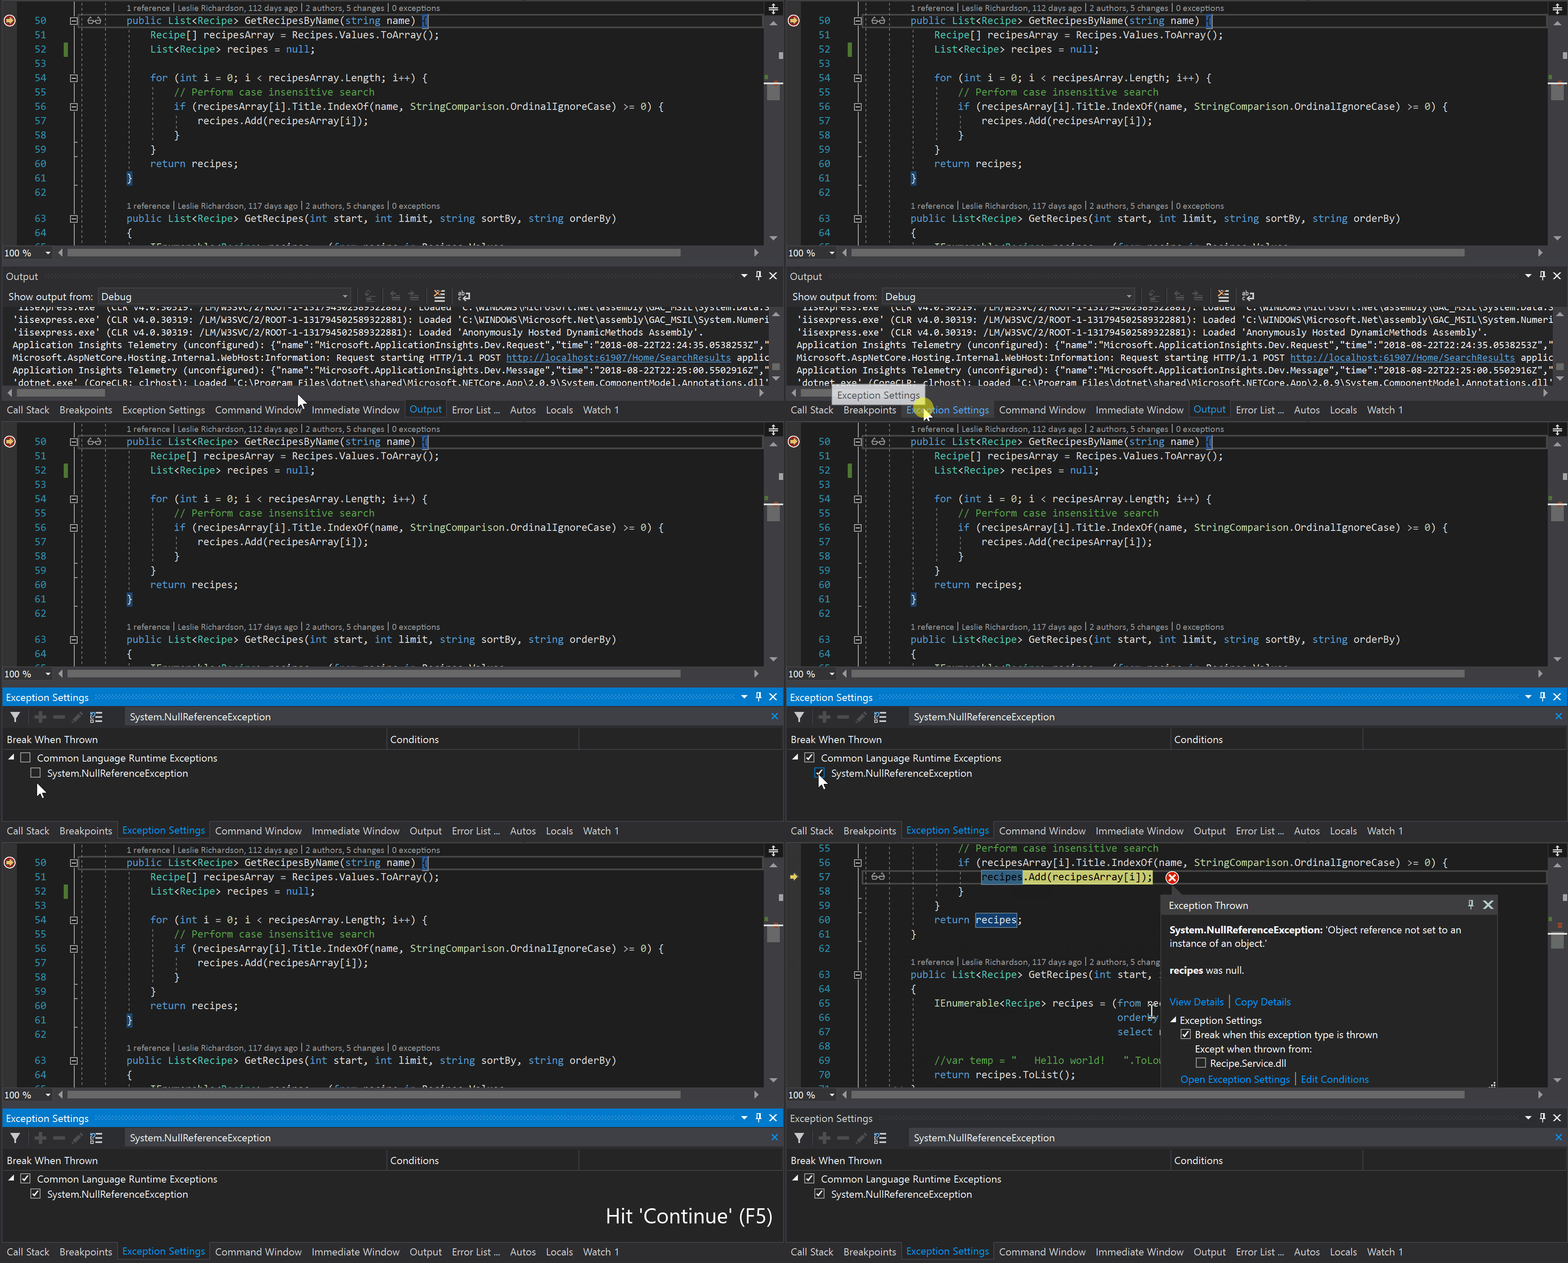
How can I break when a handled or unhandled exception is thrown?
When exceptions are thrown at runtime, you are typically given a message about it in the console window and/or browser, but you would then have to set your own breakpoints to debug the issue. However, Visual Studio also allows you to break when a specified exception is thrown automatically, regardless of whether it is being handled or not.
You can configure which thrown exceptions will break execution in the Exception Settings window.
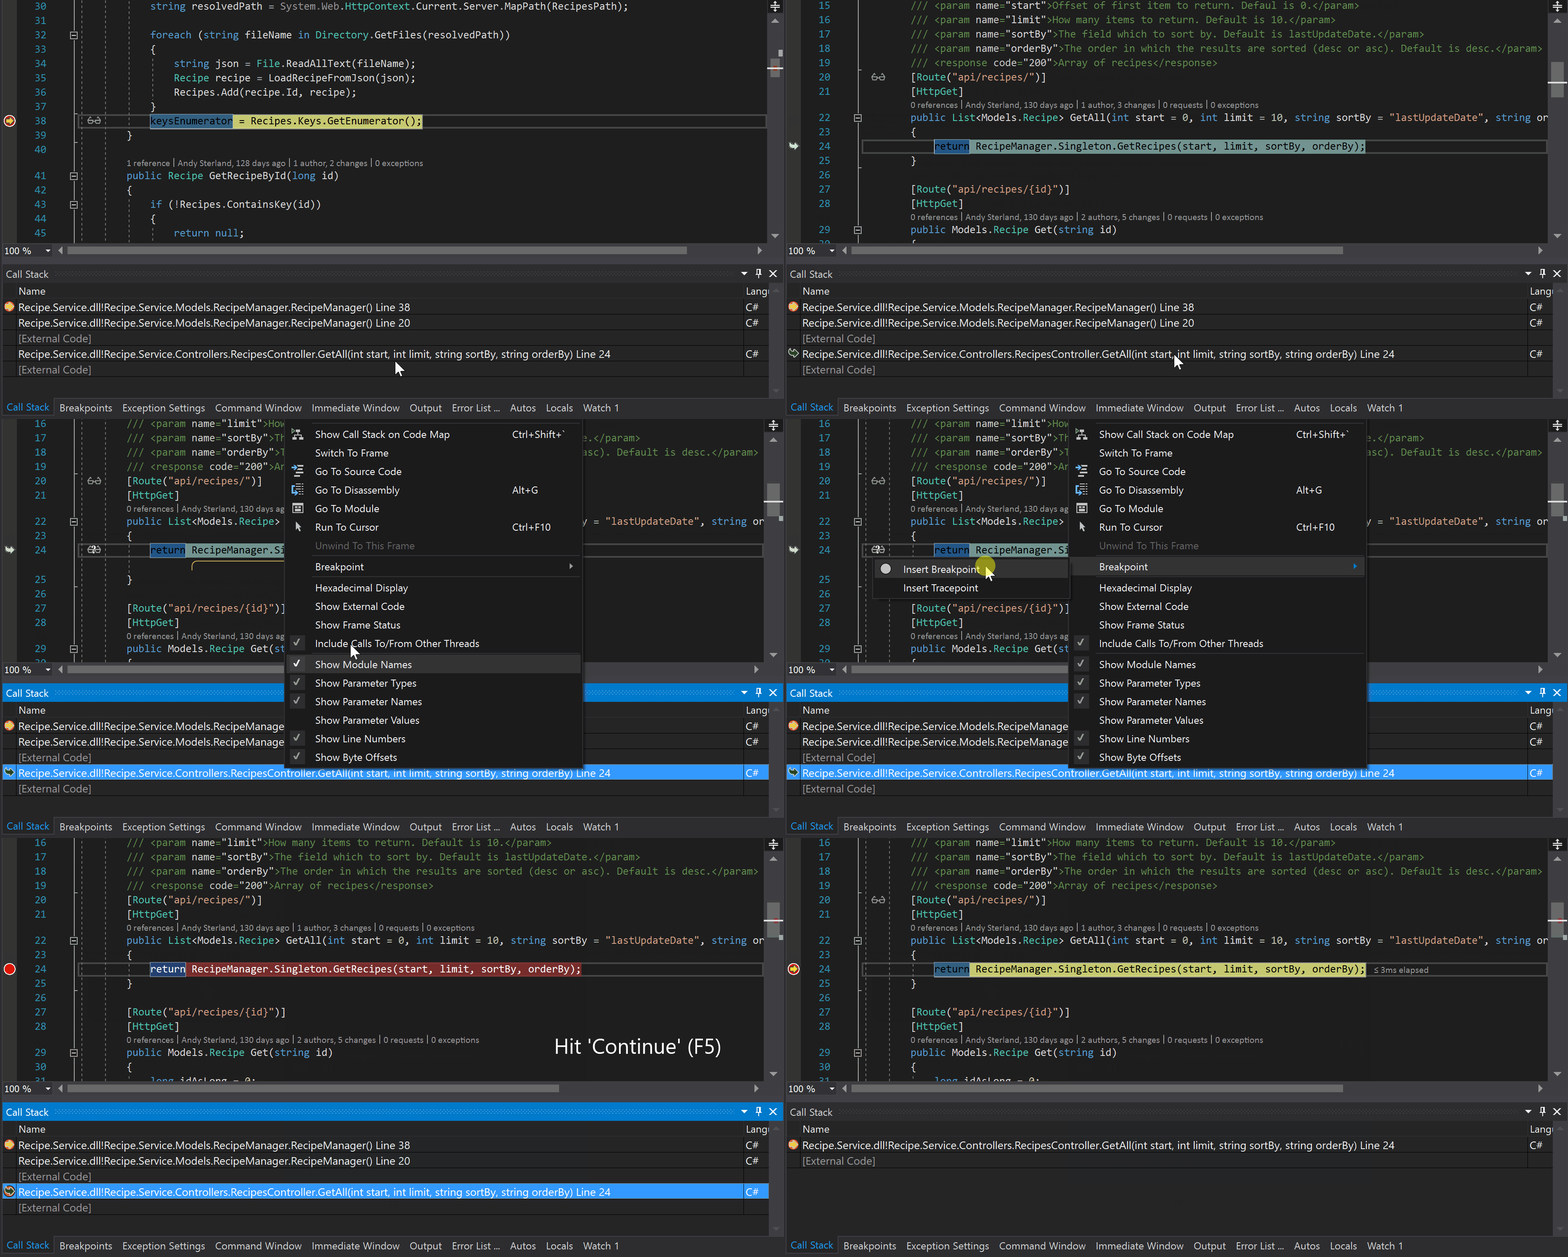
Can I set a breakpoint in the call stack?
If you are using the call stack to examine your application’s execution flow or view function calls currently on the stack, you may want to use call stack breakpoints to pause execution at the line where a calling function returns.
- Open the call stack (Debug –> Windows –> Call Stack, or CTRL + ALT + C)
- In the call stack, right-click on the calling function and select Breakpoint –> Insert Breakpoint (F9).
How can I pause execution at a specific assembly instruction?
If you are examining the disassembly window to inspect method efficiency, inexplainable debugger behavior, or you just want to study how your code works behind the scenes when translated into assembly code, disassembly breakpoints may be useful to you. Disassembly breakpoints can be used to break at a specific line of assembly code, accessible only when code execution is already paused. To place a disassembly breakpoint:
- Open the disassembly window (Debug –> Windows –> Disassembly, or Ctrl + Alt + D)
- Click in the left margin at the line you want to break at (or press F9).
Excited to try out any of these breakpoints? Let us know in the comments!
For more info on Visual Studio 2017 breakpoints, check out the official documentation. For any issues or suggestions, please let us know via Help > Send Feedback > Report a Problem in the IDE.



0 comments