Back when we started 4.0 development, I polled readers of the MSBuild blog to find out what features were most important to them. Debugging was #1 which was very surprising to us. Thinking about it more, it makes sense. In our team we’ve become so proficient ourselves at reading the XML and making sense of logs that it’s easy to forget how difficult it is – especially for someone new. John Robbins, debugging guru, also requested a Visual-Studio-integrated debugger.
Fast forward to the 4.0 release earlier this year, and we addressed 7 out of 16 of the requests by my count. We had to balance the requests with what Visual Studio itself needed from MSBuild. There were two major requirements it had on MSBuild: to enable VC++ to move onto MSBuild (#5 request), and to help enable more powerful and fine grained multi-targeting.
It turned out that these two in turn required many other features, most of which were happily also popular requests on that blog poll. We added the ability to define a task with inline code (#7 – see powershell example) a new, comprehensive object model (#14; in three parts, one, two, three), improved performance and scalability in many cases (#8 — and here), property and item functions (#9 – albeit not currently extensible) , and accurate automatic dependency checking by performing file system interception (#11), plus some small syntax additions (label, import group, import by wildcard) and a more configurable build engine (eg see here, here, and here), plus easier build extensibility and some performance diagnostics.
We didn’t have time, unfortunately, to address converting the solution file to MSBuild (#3) – which we would dearly love to do – nor to add a Visual Studio integrated debugger (#1).
At least, not a supported one!
Mike Stall approached us to demonstrate an ingenious reflection-emit idea which made it considerably more feasible to create an MSBuild specific debugger with many of the features of the real managed code debugger. While on leave I wrote and checked-in the code to do it. Unfortunately we couldn’t complete it in time to make the 4.0 schedule.
For that reason, it’s in the product, but disabled by default. It does work, it’s just not supported or documented, and has a few limitations and bugs: it may be slow, it’s not always pretty, and in at least one case, it’s a little inaccurate. This blog post is “unofficial” documentation of how to use it in the hope it will be useful. Although it’s not supported we will welcome Connect feedback, but it will likely will be moved to our backlog rather than fixed immediately. It would also be a great idea to add any bug reports and feedback to the comments on this blog post.
Debugging Walkthrough
I’m going to walk through each debugging scenario in turn.
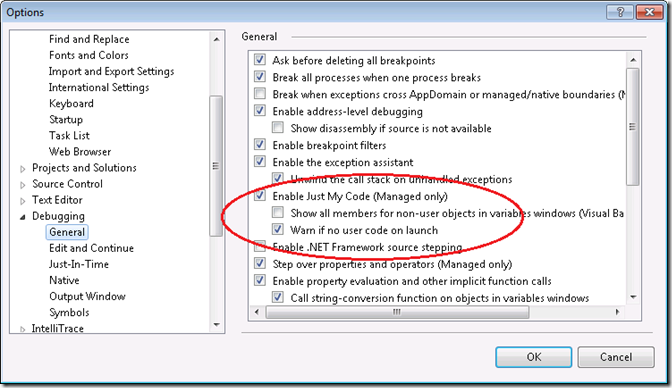
Before you start, open Visual Studio briefly and make sure that “Just My Code” is enabled. It’s essential for this to work properly:
There’s a lot of screenshots here, but this blog is rather narrow, so some of them are distorted – you can click on them to see the full size version.
Scenario 1 – Command Line only
First, enable the undocumented “/debug” switch on MSBuild.exe by setting the HKEY_LOCAL_MACHINESOFTWAREMicrosoftMSBuild4.0 key to have debuggerenabled=true, as I’ve done here with reg.exe in an elevated Visual Studio prompt:
You should now have these keys, assuming C: is your system drive.
Run MSBuild /? and you’ll see the new switch has appeared.
We are now ready to debug.
Normally you’d be debugging some build process you’ve customized or authored, but for illustrative purposes I’m going to debug a brand new C# Windows Forms project. I’m going to build it with the /debug switch, and it will immediately stop:
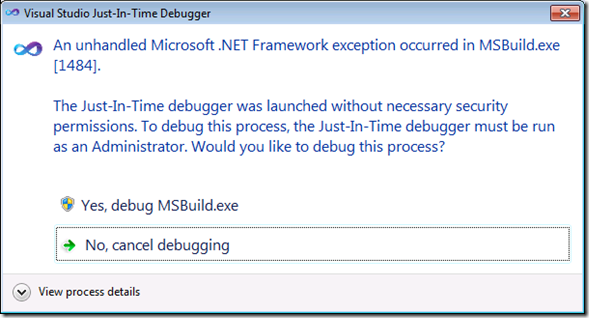
In my case I get a prompt to elevate, and hit Yes:
Then I get the standard JIT debugging prompt. Make sure you check “Manually choose the debugging engines”.
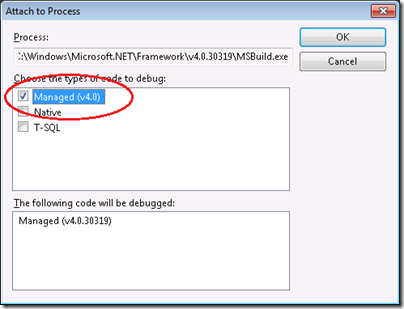
that causes a dialog to appear to choose the debugging engine: you want Managed only. (Mixed will work, is more clunky.)
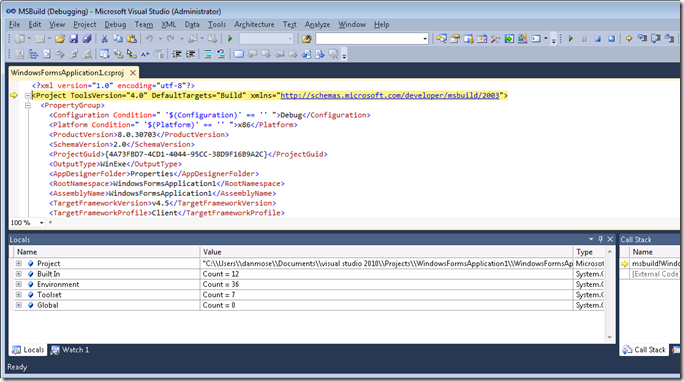
And you are now debugging!
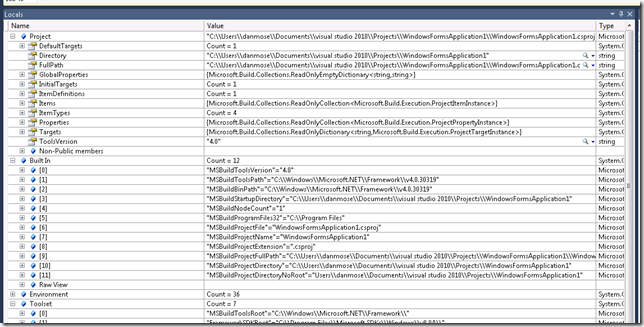
The first thing to notice is that we are right at the top of the first project file, the very first line MSBuild is evaluating. You are breaking in automatically at the very start, as if you started debugging a regular application with “F11”. Well, almost the very start: MSBuild already read in the environment and its other initial settings:
Now hit F10 and you will step line by line:
As you step over properties, you’ll see the locals window is updating:
As you probably know, MSBuild evaluates in passes. The first pass evaluates just properties, pulling in any imports as they’re encountered. Try to set a breakpoint (F9) on an item tag right now – you can’t! MSBuild is unaware of them at this point.
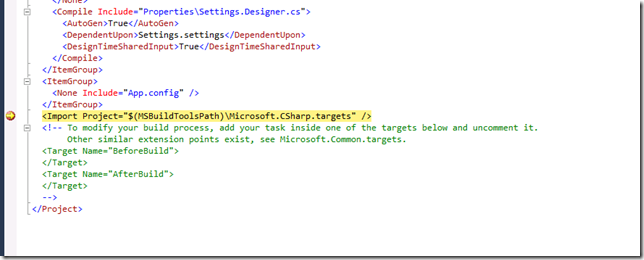
Set a breakpoint on the <Import> tag at the bottom and run to it (F5):
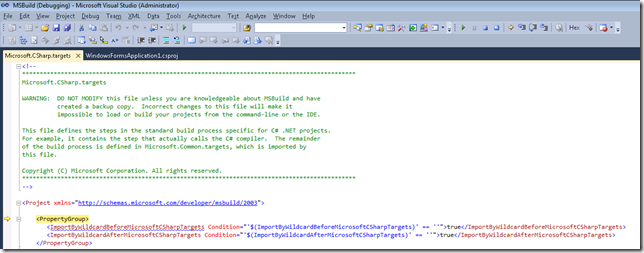
Now step in (F11). You’ll enter the file that’s being imported, which in this case is Microsoft.CSharp.targets.
The Callstack window shows that jump like a function call, including the location in the file:
Of course, <Import> does not have the semantics of a function call at all. Like an #include in C++, it simply logically inserts the content of another file. But I chose to make it work this way so that you can see the chain of imports in the Callstack window and figure out your context.
By setting some more breakpoints on Imports and doing step-into, I can go deeper to illustrate:
To get past the property pass, given that I can’t set a breakpoint on items yet, I’ll use a trick. I’ll Step Out repeatedly (Shift-F11) until we get to the project file again, then step to get to the next pass, which is Item Definitions. The C++ build process uses Item Definitions a great deal, but they’re not very interesting for C#, in fact there’s only one:
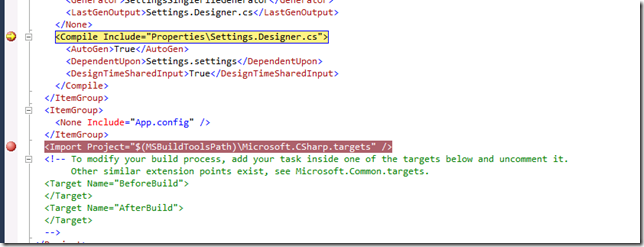
Use the same trick to get to the Item pass, and we’ll get to the first item. I’ve then set a breakpoint to illustrate that I can do that now.
Conditional Breakpoints work too, by the way as I believe do Trace Points.
Stepping a bit further, I can see items in the locals window, and also their metadata. A small bug here — ignore the red message, and go into “Non-public members” to see the names and values:
Sometimes you’ll want to figure what a condition evaluates to at the current moment. To do that, in the immediate window, pass the condition to the function EvaluateCondition:
It’s much the same if you want to evaluate (expand) an expression, but the function is named EvaluateExpression:
This is also a convenient way to see what a property value is, or what’s in an item list, without navigating through the locals window. Be sure to escape any slashes, as I’ve done here.
The Autos window doesn’t work, but Watch does:
In the Immediate window you can change almost any project state during the build, using the new object model. For example, I’ll modify this property while I’m stopped here:
You can do a lot through the new object model, so it’s very useful to be able to call it here.
My Watch window updated to match:
That’s the end of what I’m going to show for debugging MSBuild evaluation.
How it works
What’s happening at the high level (you can find out more from Mike’s blog) is that MSBuild is pretending the script is actually VB or C#. It’s doing this by emitting IL on the fly that’s semantically equivalent to what it’s really doing as it goes through the XML. The code of MSBuild itself is of course optimized, so Just My Code hides it, but conveniently the IL isn’t optimized, so it shows up. Inside the IL MSBuild emits line directives that point to the right place in the project file, completing the trick. As for the “locals”, they’re actually parameters passed to functions in the IL so that they appear. EvaluateCondition and EvaluateExpression are just delegates passed the same way.
As such, a large part of the basic features you get with the regular VB/C# debugger just work. Some that don’t: hovering over an expression doesn’t give you the result; you can’t just use the “?” syntax in the immediate window; Threads and Processes windows don’t make sense; I doubt Intellitrace works. Plus, there’s some of our internals leaking out in the windows here and there. But by using this trick, it was vastly less work to get the basics of an integrated debugger. I believe I spent a day or two tidying up Mike’s sample code, and another three days wiring it straightforwardly into MSBuild. Creating a real debugger engine would be much more costly; and something comparable with what you get for C# would be fantastically costly, so I expect that long term, this will be the MSBuild debugging story. I hope you’ll agree it’s a lot better than staring at XML and logs or adding <Message> tags.
In my next post I’m going to cover
- Debugging during the build – ie., debugging what happens inside targets, and project references;
- Debugging a multiprocessor build;
- Debugging the build of projects loaded into Visual Studio
See you then!
Dan
Visual Studio Project & Build Dev Lead










0 comments