In Visual Studio 17.13 Preview we have released our updated BenchmarkDotNet diagnosers, allowing you to use more of the tools in the performance profiler to analyze benchmarks. With this change it is super quick to dig into CPU usage and allocations of benchmarks making the measure, change, measure cycle quick and efficient.
Benchmarking a real project
So, to show how we can use the tools to make things better let’s go ahead and benchmark a real project. At the time of writing this article, CsvHelper is the 67th most popular package on Nuget.org with over 9 million downloads of the current version. If we can benchmark this and make it better, we can help lots of users.
You can follow along by pulling down my fork of this at: CsvHelper Fork. The notable changes are that I have added are a new console project (CsvHelper.Benchmarks) that we can use to store our benchmarks, adding the BenchmarkDotNet package to do the actual benchmark runs, and a simple EnumerateRecords benchmark that parses a CSV stream into records which is shown below.
public class BenchmarkEnumerateRecords
{
	private const int entryCount = 10000;
	private readonly MemoryStream stream = new();

	public class Simple
	{
		public int Id { get; set; }
		public string Name { get; set; }
	}

	[GlobalSetup]
	public void GlobalSetup()
	{
		using var streamWriter = new StreamWriter(this.stream, null, -1, true);
		using var writer = new CsvWriter(streamWriter, CultureInfo.InvariantCulture, true);
		var random = new Random(42); // Pick a known seed to keep things consistent

		var chars = new char[10];
		string getRandomString()
		{
			for (int i = 0; i < 10; ++i)
				chars[i] = (char)random.Next('a', 'z' + 1);
			return new string(chars);
		}

		writer.WriteHeader(typeof(Simple));
		writer.NextRecord();
		for (int i = 0; i < BenchmarkEnumerateRecords.entryCount; ++i)
		{
			writer.WriteRecord(new Simple()
			{
				Id = random.Next(),
				Name = getRandomString()
			});
			writer.NextRecord();
		}
	}

	[GlobalCleanup]
	public void GlobalCleanup()
	{
		this.stream.Dispose();
	}

	[Benchmark]
	public void EnumerateRecords()
	{
		this.stream.Position = 0;
		using var streamReader = new StreamReader(this.stream, null, true, -1, true);
		using var csv = new CsvReader(streamReader, CultureInfo.InvariantCulture, true);
		foreach (var record in csv.GetRecords<Simple>())
		{
			_ = record;
		}
	}
}
A few things to note here. We have a global setup function that creates a simple CSV stream and holds it in a memory stream for us. We do this inside the [GlobalSetup] of the benchmark run so that it doesn’t skew the results of our benchmark, we only want to benchmark the actual parsing of the CSV file, not creating test data.
Next, we have a global cleanup function that properly disposes our memory stream, which is just good practice in the event more benchmarks get added so we don’t continuously leak memory.
Lastly, our benchmark simply creates a CsvReader from a stream and then reads each record from it. This exercises the parsing functionality of CsvHelper which is what we are going to try and optimize.
Getting insight into the benchmark
From here you can add a BenchmarkDotNet (BDN) Diagnoser to the benchmark class to capture information about the benchmark while it is running. BenchmarkDotNet comes with an included [MemoryDiagnosers] which captures allocation and overall memory usage information. If we add this attribute and run the benchmark you should get something like
From here you can see the normal mean, error, and standard deviation that BDN provides along with output from our diagnoser which shows we have allocated 1.69 MB of memory during the benchmark and its breakdown in the different GC heaps. If we want to dig further, which I do 😊, then we can include the Microsoft.VisualStudio.DiagnosticsHub.BenchmarkDotNetDiagnosers package from Nuget.org, which hooks BenchmarkDotNet into the Visual Studio Profiler so we can see what is happening during the run. After including this package and adding the [DotNetObjectAllocDiagnoser] and [DotNetObjectAllocJobConfiguration] to the benchmark and rerunning we get:
The biggest thing of note is the line at the bottom showing the path to a collected diagsession file which is the Visual Studio profilers file format for its results. With the new updates it automatically opens in VS and now we have all the stuff we need to dig in and maybe reduce some allocations.
Hunting for allocations
Now that we have a diagsession detailing all the allocations from the run, lets see if we can reduce the allocations we are doing and reduce the load on the garbage collector.
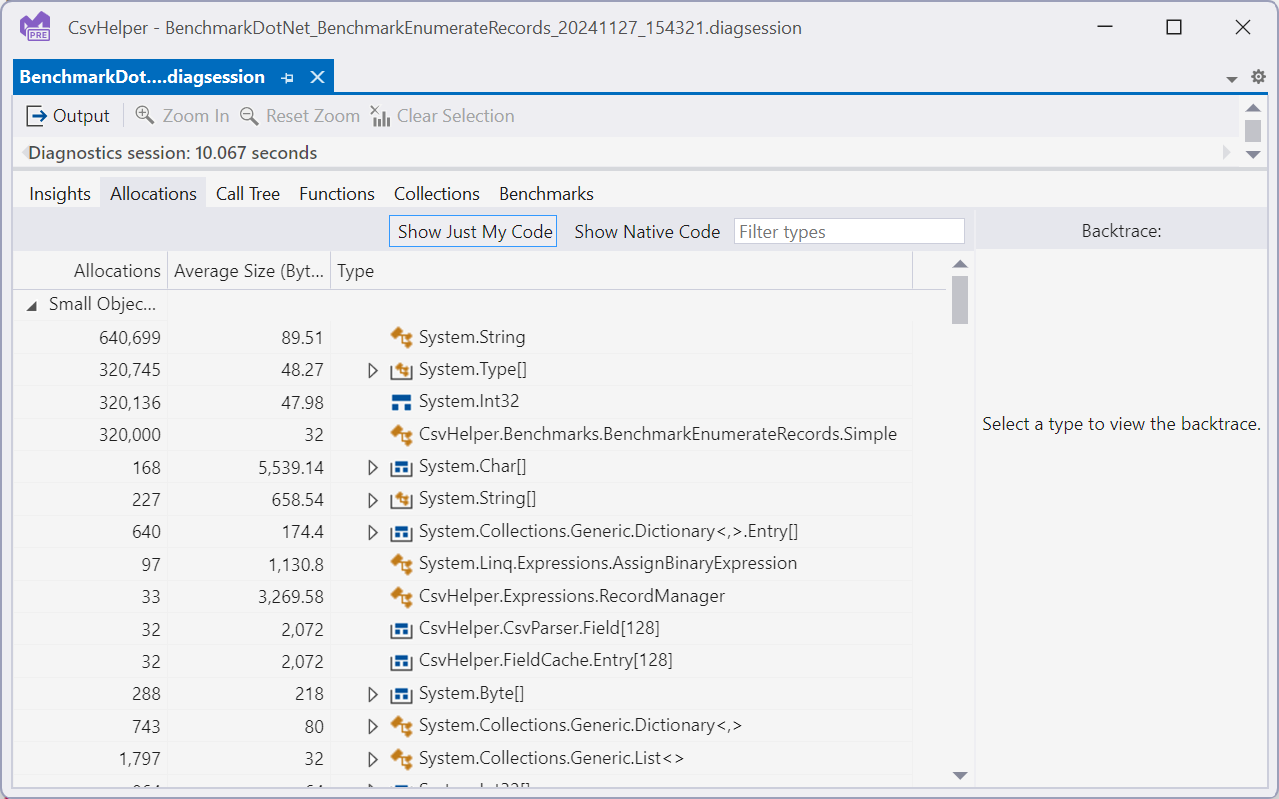
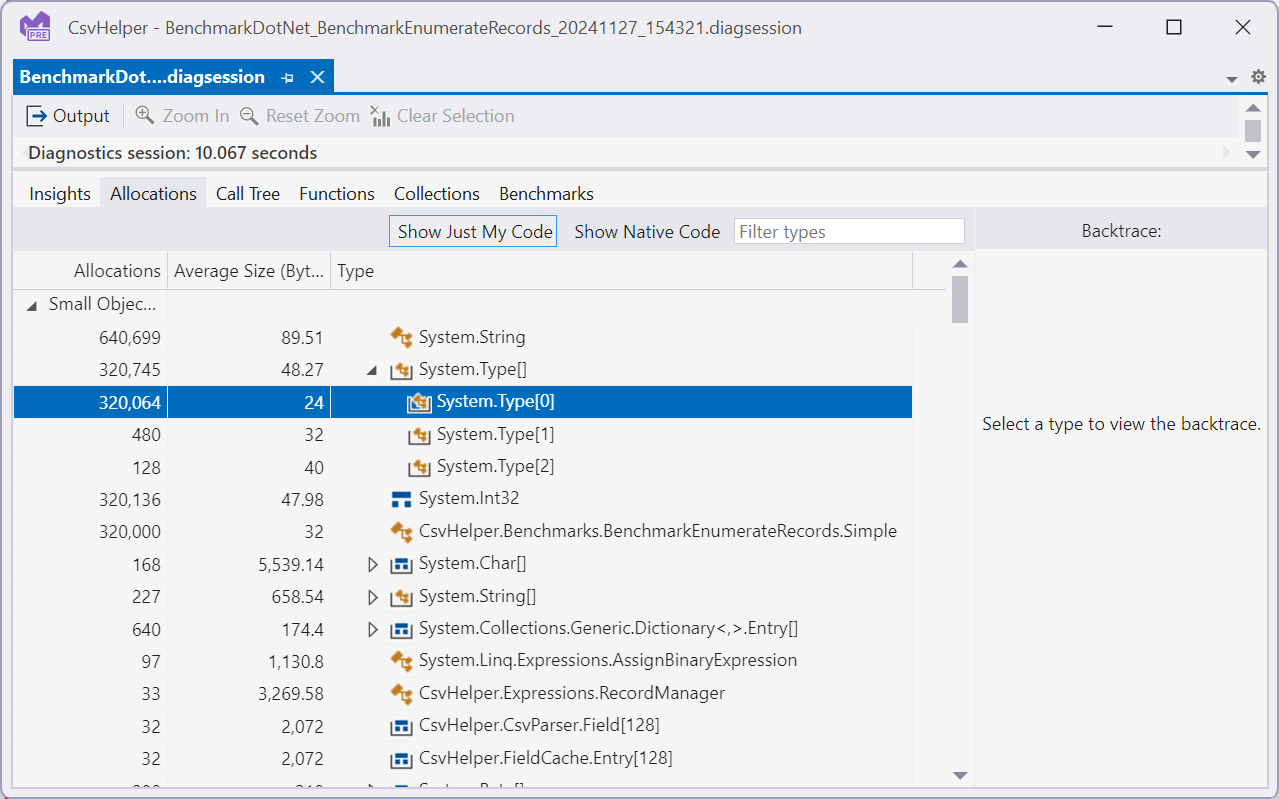
Since our benchmark is designed to deserialize 10,000 records from the memory stream we want to look for anything that is a multiple of 10,000 as that is indicating it is allocating for each record. Immediately we see, string, Type[], int32, and Simple. String and Int32 are the properties on our Simple record type so that makes sense, and Simple is the record type we are deserializing so again that makes sense. The Type[] is a bit suspicious and digging in further things just look worse:
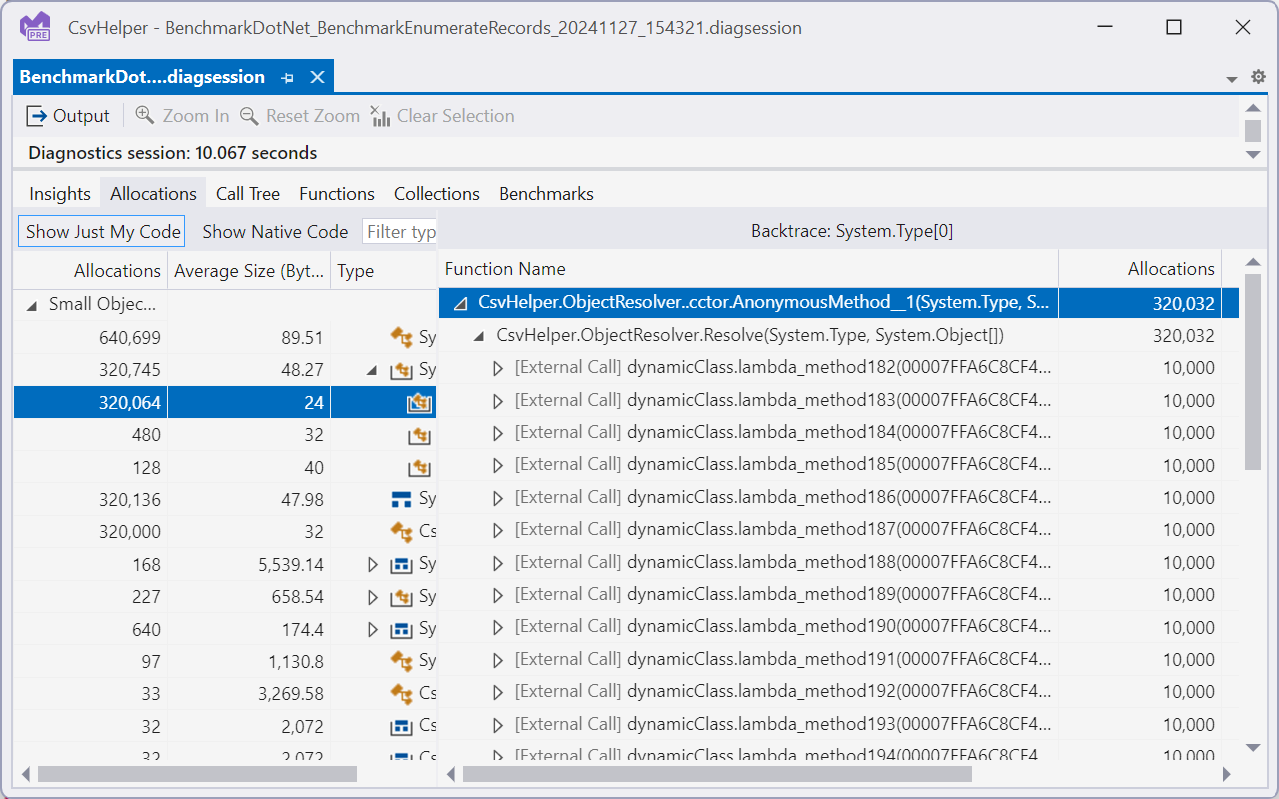
In this case it looks like we are allocating an empty Type[] for each record we deserialize, each one being 24 bytes adding up to 7.6MB of allocations in this benchmark run. These junk allocations that can’t hold any data wind up accounting for 14% of allocations in the benchmark run. This is crazy, and something we should be able to fix. Double clicking on the type shows us the backtraces, which shows it is coming from some anonymous function:
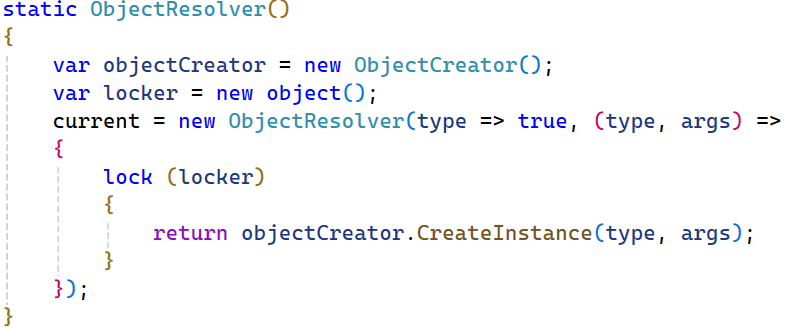
Going to source for this (right click context menu-> Go to Source File) we see the following:
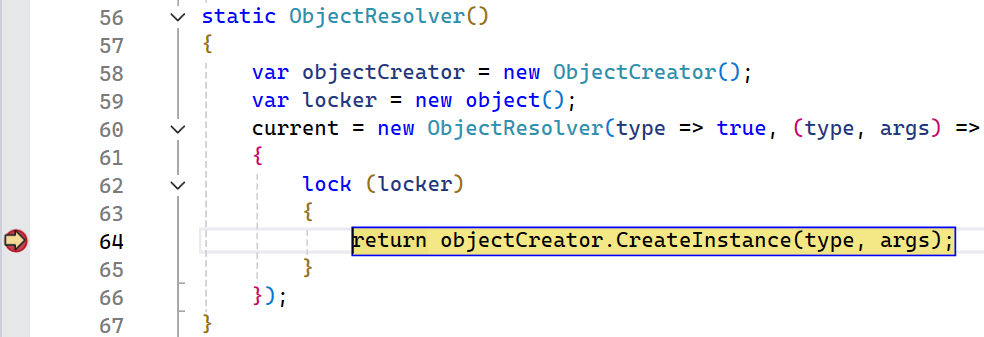
To me it isn’t immediately obvious where this allocation is coming from, so the easiest thing to do is just add a breakpoint to the CreateInstance call and then look around in the debugger. Now BDN runs our benchmarks in a separate process to better control the benchmarks, so to debug we can just instantiate our benchmark and call our benchmark method ourself. We can do this by updating main like so:
static async Task Main(string[] args)
{
	//_ = BenchmarkRunner.Run<BenchmarkEnumerateRecords>();

	var benchmarks = new BenchmarkEnumerateRecords();
	benchmarks.GlobalSetup();
	await benchmarks.EnumerateRecords();
	benchmarks.GlobalCleanup();
}
Running in the debugger we hit where our allocation is occurring:
Again, it isn’t super obvious where this allocation is occurring so let’s step into the call in case this is coming from an inlined frame:
This method has a Type parameter but not Type[]. It is a relatively short function though so maybe it and its caller are getting inlined so let’s step in again.
Unfortunately no Type[] yet, but this method is marked as AggressiveInlining which explains why we didn’t see it in the allocation stack. One last step in and boom, we got our Type[] allocation!
Now this is where the ah hah moment is! We are calling GetArgTypes which returns a Type[] based on the object[] that is passed in. We start by allocating an array that is the same size as the object[], but if the object[] is length 0 then we allocate a new 0 length array. In this case we can easily fix this by checking the parameter size and returning early in the case that there are no arguments to get the type from.
[MethodImpl(MethodImplOptions.AggressiveInlining)]
private static Type[] GetArgTypes(object?[] args)
{
	if (args.Length == 0)
	{
		return Array.Empty<Type>();
	}

	var argTypes = new Type[args.Length];
	for (var i = 0; i < args.Length; i++)
	{
		argTypes[i] = args[i]?.GetType() ?? typeof(object);
	}

	return argTypes;
}
After making this change, we can rerun our benchmarks, remember measure/change/measure, and we get the following:
We effectively cut down on the allocated memory by ~14%! While this may not seem like a huge win, this scales with the number of records. For CSV files with lots of records this is a big win, especially in a library that is already very fast and heavily optimized.
Let us know what you think
In summary, we were able to take a real-world project, add a benchmark to it, use the Visual Studio profiler, and make a meaningful contribution in just a single blog post. By creating a benchmarking suite, it is easy to isolate specific code that you want to improve by measure/change/measure and see the impact of your performance optimizations. We’d love to hear what you think!




0 comments