
The second principle of Sustainable Software Engineering is to build energy efficient applications. The very first steppingstone in that direction is to measure the energy your application consumes. Being able to measure or estimate the energy cost of your application will allow you to start reason over how your application can become more energy efficient. It will also allow you to observe when you are improving or when you are regressing. Which automatically leads us to the question, what is the best way to measure the energy consumption of your backend service?
My colleague Scott Chamberlin is writing a series of how to measure energy and carbon impact of Windows client applications. The first post in Scott’s series is available here. This post is operating system agnostic and is primarily meant for applications running on backend only.
Measure power consumption directly from the socket
The most reliable way is also the simplest way. Buy a cheap watt hour meter, plug it into the socket between your wall and your server and you are golden. This will always be the best way to measure power consumption because it will measure exactly what your server consumes. 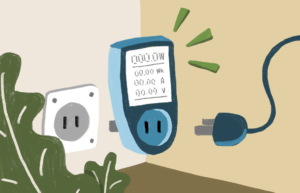 There are tricks to remember for reliable data.
- The server will consume power when idle. Consider this a baseline energy consumption. If you are interested in absolute numbers for your application, then you will need to measure the baseline consumption and then subtract it from the overall consumption measured when running the application.
- Always start measuring from Steady State (SS). There will be a transient event, often an oscillation, observed as a sudden burst of energy when starting up any electrical component, so start measuring when you can observe SS.
What if I run in the cloud?
There are a range of reasons why measuring directly from the socket might not work. If you are running in the cloud and don’t have access to your physical server, or if your server runs many different applications and you wish to measure them individually, we must break out a different toolbox.
The main consumers of power on a server will be the CPU, the GPU, and the memory. Estimating how much each consumes will give you an estimate of how much power your server, or your application on a server, consumes. This will, of course, be an estimation but if your goal is to start tracking energy consumption and make sure you are improving, this will do the job. Other components that consume energy may be less transparent to the end user, or completely missing from your setup, such as optical drives, motherboards, and hard drives.
Hardware manufacturers provide a data sheet for all their components and on which you will find a number called TDP, Thermal Design Power. This number is meant to help with designing what cooling the component needs, and not strictly for estimating energy consumption. But there is a correlation, even though it will be a simplification. Since we are all aware that the best way is to measure power consumption directly from the socket and we are looking for an estimation only, let’s continue down this path together. If we approximate the TDP with the energy consumption of each component we will get this mathematical formula: P[kWh]=(c∙P_c+ P_r+g∙P_g)/1000 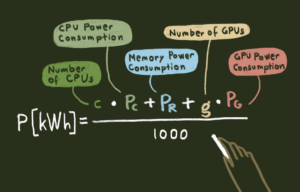
For our estimate to account for this like cooling in a data center this number needs to be multiplied with the PUE, Power Usage Effectiveness, of your datacenter. The PUE is a ratio that determines how effective a datacenter is at utilizing their energy, e.g. a PUE of 2.0 means for every 1 kWh of electricity that reached the server, the data center needs 2 kWh to account for waste and other services like cooling. This is useful if you want to convert your numbers into CO2 equivalents. For comparing an application’s power consumption over time, you can consider it constant.
Estimate power consumption before deployment
If you are more interested in a hardware agnostic approach, or if it is more important to compare software over time or against one another, an option is to calculate the number of FLOPs (floating point operations, not FLOP per second in this post). The number of FLOPs can be computed analytically by obtaining, or defining, the cost of two basic CPU operations, ADD and MUL. From those two basic operations the cost of all others can be defined. This was suggested in the paper Green AI by Schwartz et al. where the authors, in addition to suggesting this metric, measured several machine learning models to find trends over time. This approach has also been used in several other studies. Examples: Tom Veniat and Ludovic Denoyer Learning time/memory-efficient deep architectures with budgeted super networks, In Proc. of CVPR, 2018, and Polosukhin et all. Attention is all you need, In Proc. of NeurIPS, 2017. Hardware providers sometimes release software for calculating FLOPs and there are also specialized open-source software for calculating FLOPs of different scenarios, for example neural networks.
What do FLOPs have to do with energy, you wonder? Counting the FLOPs is a good time – and hardware agnostic way to measure the amount of work a running machine performs to execute a piece of software. The amount of work a machine does corresponds well to the energy it consumes and therefore it can be used as an approximation. FLOPs are also correlated with the run time of software, which also has an impact on energy consumption. Another big win of this solution is that it can be analyzed on the code stage without being deployed anywhere, which makes comparing solutions to each other early in the development phase feasible.
Take Action
Ready to put it all into action? Checkout the Microsoft Sustainability Guide, especially the e-book on “Four steps to understanding your carbon footprint”, or watch the YouTube video on understanding the math behind Microsoft’s Commitment to become carbon negative by 2030.
0 comments