Summary: Boe Prox shows how to debug scripts in Windows PowerShell.
Honorary Scripting Guy and Windows PowerShell MVP, Boe Prox, here today filling in for my good friend, The Scripting Guy. This is the final part in a series of five posts about troubleshooting Windows PowerShell scripts and functions. The series includes:
- Provide Support by Using Verbose and Debug Streams
- Troubleshoot by Using Set-PSDebug
- Enforce Better Script Practices by Using Set-StrictMode
- Trace Your Commands by Using Trace-Command
- Use the PowerShell Debugger (this post)
Over the course of the week, I have been showing you various approaches to troubleshoot your code (or someone else’s code). Today I wrap things up by talking about the Windows PowerShell debugger. I’ll look at the console and the ISE to help troubleshoot different parts of the code.
Debugging in the ISE is nicer because you can use keyboard shortcuts to set breakpoints on various lines of code. When you hit that breakpoint, it shows up in the ISE, making it easier to tell where you are. The following table lists the keyboard shortcut.
|
Action |
Keyboard Shortcut |
|
Run/Continue |
F5 |
|
Step Into |
F11 |
|
Step Over |
F10 |
|
Step Out |
SHIFT+F11 |
|
Display Call Stack |
CTRL+SHIFT+D |
|
List Breakpoints |
CTRL+SHIFT+L |
|
Toggle Breakpoint |
F9 |
|
Remove All Breakpoints |
CTRL+SHIFT+F9 |
|
Stop Debugger |
SHIFT+F5 |
Let’s image that I have a script that I want to test to make sure it behaves properly. I am going to run this in the ISE to set up a couple of breakpoints and see what everything is doing. Eventually, the first breakpoint will trip and then the console will enter the debugger.
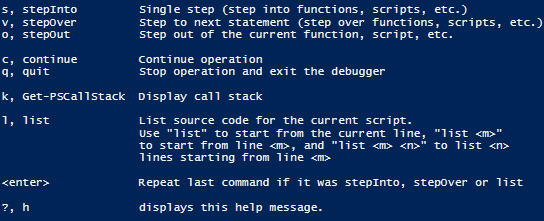
Now that we have hit the debugger, we can start working with some of the available debugging commands to further explore the code and step through various parts. These are the same commands that are available in the console.
If we have other breakpoints set, we can type c **(continue), and the code will execute to the next breakpoint. We can also find all the available debugging commands by typing **? (questions mark) at the debug prompt.
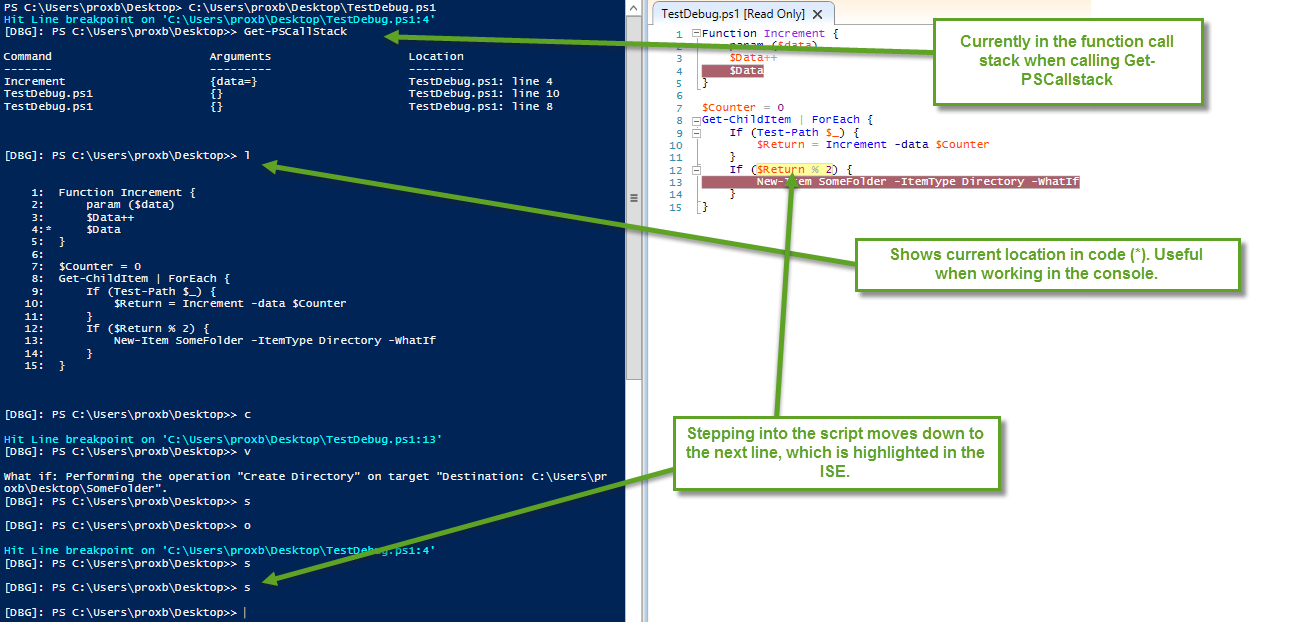
Knowing this, we can begin debugging the code and tracking the progress of each line, if needed, or simply move to the next breakpoint. The nice thing about the ISE is that the tracking for each line is shown as a highlighted row. In the console, we would be making liberal use of ‘list’ to see where we actually are. I can also use Get-PSCallStack to see where we are in the current call stack.
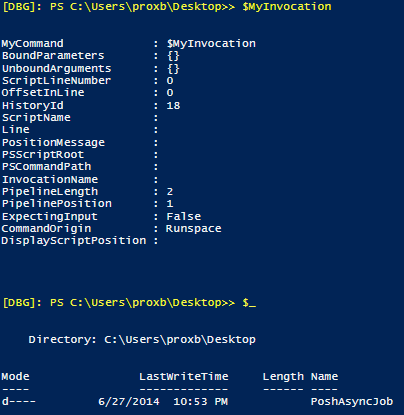
Another thing worth noting is that there are a few variables that hold a value in the debugger that is different from the value they would have in the script or function. Those variables are:
- $_
- $Args
- $Input
- $MyInvocation
- $PSBoundParameters
If you want these variables to be available, you need to assign the values to a different variable.
So I have had a little fun with the ISE, but now I am going to turn my attention to the console and show how we can set breakpoints on scripts or commands by using Set-PSBreakPoint (these also can be used in the ISE).
Breaking on a variable
We can set a breakpoint on a variable based on three actions:
- Read
- Read/Write
- Write
Let’s say we want to see whenever an error occurs with a command. We can use the –ErrorVariable parameter and then set a breakpoint against that variable to send us to the debugger to further investigate what is going on.
Set-PSBreakpoint -Variable WMIErrors -Mode Write
## Script Named ComputerScan.ps1
Param($Computername)
$WMIParams = @{
Class = ‘Win32_OperatingSystem’
ErrorVariable = ‘WMIErrors’
}
ForEach ($Computer in $Computername) {
$WMIParams.computername = $Computer
Write-Verbose “Checking $Computer” -Verbose
Get-WmiObject @WMIParams
}
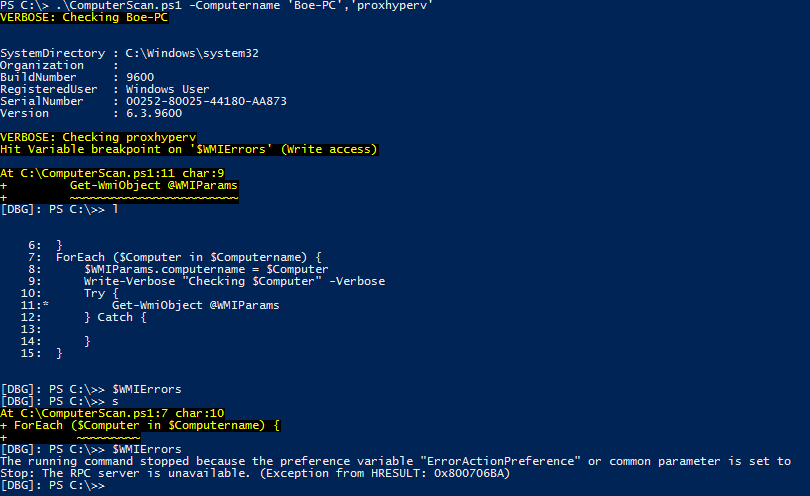
As expected, when an error occurs with my WMI query, the error is written to the $WMIErrors variable, which throws me into the debugger, based on the breakpoint that I set. I cannot actually view the error yet because it hasn’t been written to the variable. We need to move to the next line of the script to see what the error is.
Breaking on a command
We can break into the debugger whenever a command is used! I am going to modify my script a bit to remove the error handling and error variable for the sake of this demonstration.
Param($Computername)
$WMIParams = @{
Class = ‘Win32_OperatingSystem’
}
ForEach ($Computer in $Computername) {
$WMIParams.computername = $Computer
Write-Verbose “Checking $Computer” -Verbose
Get-WmiObject @WMIParams
}
This breakpoint will now target the Set-StrictMode cmdlet, and it will put me in the debugger whenever this command occurs:
Set-PSBreakpoint -Command Set-StrictMode
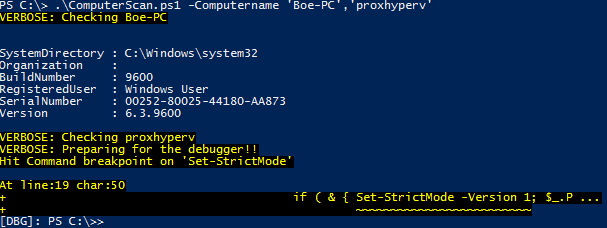
Now we can run the script and wait for the error to occur.
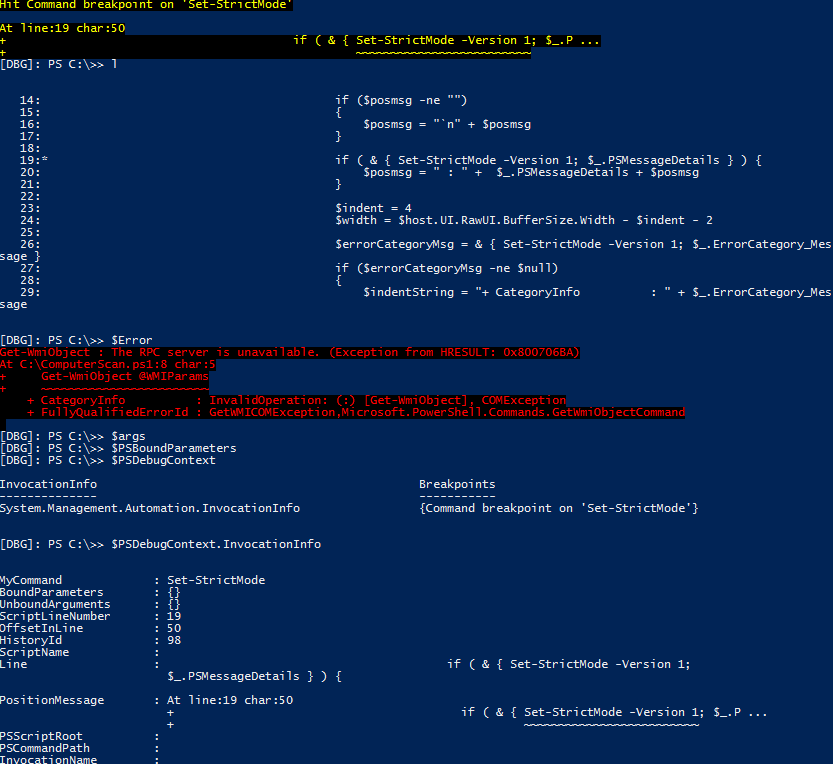
After breaking on Set-Strictmode, we can see where the handler is by using ‘l’. I could choose to continue stepping through the handler; but in this case, I am simply exploring some of the variables such as $PSBoundParameters and $args. Neither of them offers me anything because I am in the debugger. I can also look at the $DebugContext automatic variable that is created when entering the debugger to see if there is anything useful there.
Note You can always tell if you are in the debugger by testing for $PSDebugContext. This is useful if you use a custom prompt that overwrites the [DBG]: that would normally appear.
One last thing that I wanted to touch on is the use of the –Action parameter with Set-PSBreakPoint. For example, by using this, you can perform other validation checks or set other variables, depending on what you want to accomplish.
An important thing to realize is that if you use this parameter, you must use the Break keyword to enter the debugger. Otherwise, the code will continue like nothing happened. This command will not enter the debugger:
Set-PSBreakpoint -Command Set-StrictMode -Action {Write-Verbose ‘Preparing for the debugger!!’ -Verbose}
This command will work:
Set-PSBreakpoint -Command Set-StrictMode -Action {Write-Verbose ‘Preparing for the debugger!!’ -Verbose;Break}
That looks more like what I wanted! If you remember to add the Break keyword in your script block, you will enter the debugger and can start looking at what is happening in your code.
This wraps up my week of script troubleshooting! I hope you have found this information to be useful. If you have any questions, feel free to let me know!
We invite you to follow the Scripting Guy on Twitter and Facebook. If you have any questions, send email to the Scripting Guy at scripter@microsoft.com, or post your questions on the Official Scripting Guys Forum. Until then, see ya!
Boe Prox, Windows PowerShell MVP and Honorary Scripting Guy



0 comments