Summary: Learn how to use Windows PowerShell to troubleshoot Windows by working with ETW logs.
Weekend Scripter: Troubleshooting Windows
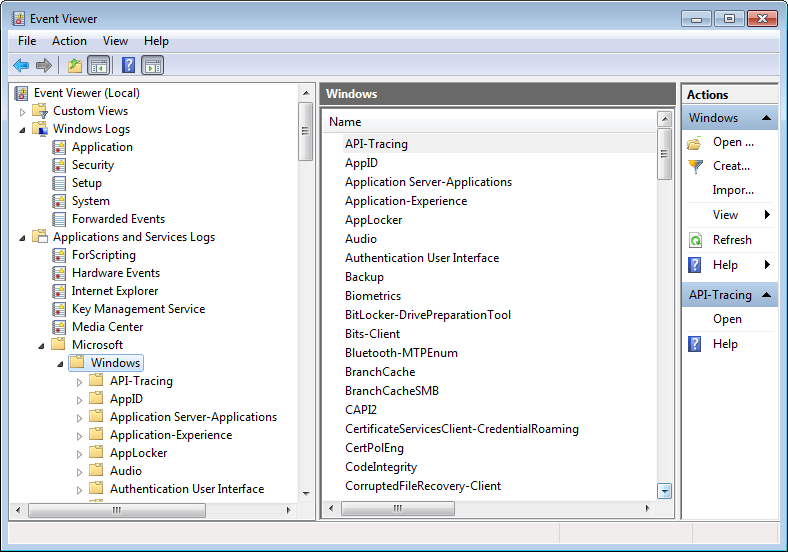
Microsoft Scripting Guy Ed Wilson here. I do not know about you, but I enjoy troubleshooting Microsoft Windows. There is something rewarding about seeing a problem, diagnosing the problem, and resolving the issue. With Windows 7, troubleshooting is quite a bit easier than it was in previous versions. One reason for this is because of all the new diagnostic logs that are available (these logs first became available with Windows Vista and Windows Server 2008; they are also available in Windows Server 2008 R2). The Event Tracing for Windows (ETW) logs are visible in Event Viewer as seen in the figure that follows.
Two things must happen before using the analytic and debug logs. The first is to make them visible. To do this, open Event Viewer by typing eventvwr in Windows PowerShell; or, click the Start button, click Control Panel, click Administrative Tools, and then click Event Viewer. On the View menu in Event viewer, click Show Analytic and Debug Logs, which is shown in the following figure.
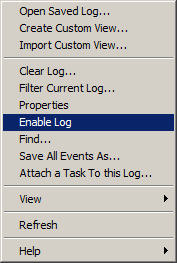
The second thing that must happen before using one of the analytic and debug logs is enabling the specific log. In most cases, these advanced analytic and debug logs are disabled because of performance reasons, so they must be specifically enabled. To enable a trace log, right-click the specific log and click Enable Log in the shortcut menu, as shown in the following figure.
Note Keep in mind that enabling a trace log requires administrator rights. If you attempt to enable the trace log without administrator rights, an “Access is denied” will be displayed. You must click OK, and restart Event Viewer with administrator rights. If the account you used to click Show Analytic and Debug Logs in the View menu is different from the one with administrator rights, you will need to reselect the option to show the analytic and debug logs.
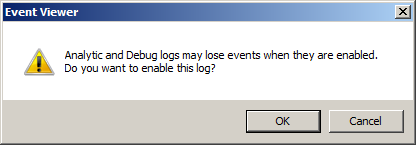
The best way to see how to work with the ETW logs is to “play around” with them. Enable the WMI-Activity Trace log by right clicking the log name and choosing Enable Log from the shortcut menu. A warning message appears that states that you might lose events when enabled, but there are no events in the log anyway, so the message doesn’t apply in this case. The warning appears in the following figure.
After the WMI-Activity Trace log is enabled, generate some WMI activity by performing a query via the Get-WMIObject cmdlet. Here is the command I use:
Get-WmiObject win32_bios
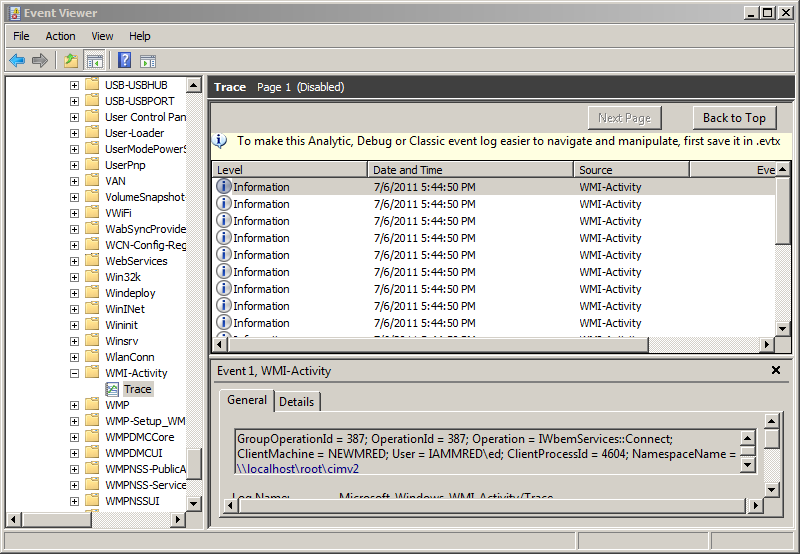
Now disable the WMI-Activity Trace log by right clicking it in Event Viewer and then clicking Disable Log. Press F5 to refresh the view of the WMI-Activity Trace log, and the logging activity seen in the following figure is shown.
The Get-WinEvent Windows PowerShell cmdlet is used to query ETW logs. The first task is to find the WMI-Activity Trace log.
It is possible to use wild cards to assist in finding trace logs. Unfortunately, when I attempt this nothing is returned. This command and its associated error output are shown here:
PS C:\Windows\system32> Get-WinEvent -ListLog *wmi* | select logname
Get-WinEvent : There is not an event log on the localhost computer that matches “*wmi*”.
At line:1 char:13
+ Get-WinEvent <<<< -ListLog *wmi* | select logname
+ CategoryInfo : ObjectNotFound: (:) [Get-WinEvent], Exception
+ FullyQualifiedErrorId : NoMatchingLogsFound,Microsoft.PowerShell.Commands.GetWinEventCommand
PS C:\Windows\system32>
An error appears because you must make analytic and debug logs visible to the Get-WinEvent cmdlet by using the force switched parameter. The revised command and associated output are shown here:
PS C:\Windows\system32> Get-WinEvent -ListLog *wmi* -force | select logname
LogName
Microsoft-Windows-EventLog-WMIProvider/Debug
Microsoft-Windows-WMI-Activity/Trace
There are two logs that match the wildcard character pattern *wmi*. No problem! I add the word trace to the end of my wildcard character pattern, and now I retrieve only the log name I am interested in viewing. The command and associated output are shown here:
PS C:\Windows\system32> Get-WinEvent -ListLog *wmi*trace -force | select logname
LogName
——-
Microsoft-Windows-WMI-Activity/Trace
Because the wildcard character pattern only returns a single item, it is possible to retrieve the log name directly by using a dotted notation. When completed, I can use the Get-WinEvent cmdlet to retrieve contents from the WMI trace log file. Unfortunately, an error occurs. The command and associated error are shown here:
PS C:\Windows\system32> $wmiLog = (Get-WinEvent -ListLog *wmi*trace -force).logname
PS C:\Windows\system32> Get-WinEvent -LogName $wmilog
Get-WinEvent : The Microsoft-Windows-WMI-Activity/Trace event log can be read only in the forward chronological order because it is an analytical or a debug log. To see events from the Microsoft-Windows-WMI-Activity/Trace event log, use the Oldest parameter in the command.
At line:1 char:13
+ Get-WinEvent <<<< -LogName $wmilog
+ CategoryInfo : InvalidArgument: (Microsoft-Windows-WMI-Activity/Trace:String) [Get-WinEvent], Exception
+ FullyQualifiedErrorId : SpecifyOldestForLog,Microsoft.PowerShell.Commands.GetWinEventCommand
The needed clue appears in the error message, “…use the Oldest parameter in the command.” After I modify the command, the command works. The revised command and associated output are shown here:
PS C:\Windows\system32> Get-WinEvent -LogName $wmilog -Oldest
TimeCreated ProviderName Id Message
7/6/2011 6:03:51 PM Microsoft-Windows-WMI-Acti… 1 GroupOperationId = 398; Op…
7/6/2011 6:03:51 PM Microsoft-Windows-WMI-Acti… 1 GroupOperationId = 399; Op…
7/6/2011 6:03:51 PM Microsoft-Windows-WMI-Acti… 1 GroupOperationId = 399; Op…
7/6/2011 6:03:51 PM Microsoft-Windows-WMI-Acti… 1 GroupOperationId = 399; Op…
7/6/2011 6:03:51 PM Microsoft-Windows-WMI-Acti… 3 Stop OperationId = 402
7/6/2011 6:03:51 PM Microsoft-Windows-WMI-Acti… 1 GroupOperationId = 399; Op…
7/6/2011 6:03:51 PM Microsoft-Windows-WMI-Acti… 3 Stop OperationId = 403
7/6/2011 6:03:51 PM Microsoft-Windows-WMI-Acti… 3 Stop OperationId = 401
7/6/2011 6:03:51 PM Microsoft-Windows-WMI-Acti… 1 GroupOperationId = 399; Op…
7/6/2011 6:03:51 PM Microsoft-Windows-WMI-Acti… 3 Stop OperationId = 404
7/6/2011 6:03:51 PM Microsoft-Windows-WMI-Acti… 1 GroupOperationId = 399; Op…
7/6/2011 6:03:51 PM Microsoft-Windows-WMI-Acti… 3 Stop OperationId = 405
7/6/2011 6:03:51 PM Microsoft-Windows-WMI-Acti… 1 GroupOperationId = 406; Op…
7/6/2011 6:03:51 PM Microsoft-Windows-WMI-Acti… 3 Stop OperationId = 406
7/6/2011 6:03:51 PM Microsoft-Windows-WMI-Acti… 3 Stop OperationId = 407
7/6/2011 6:03:51 PM Microsoft-Windows-WMI-Acti… 1 GroupOperationId = 399; Op…
7/6/2011 6:03:51 PM Microsoft-Windows-WMI-Acti… 1 GroupOperationId = 399; Op…
7/6/2011 6:03:51 PM Microsoft-Windows-WMI-Acti… 3 Stop OperationId = 408
7/6/2011 6:03:51 PM Microsoft-Windows-WMI-Acti… 2 ProviderInfo for GroupOper…
7/6/2011 6:04:01 PM Microsoft-Windows-WMI-Acti… 3 Stop OperationId = 400
7/6/2011 6:04:42 PM Microsoft-Windows-WMI-Acti… 3 Stop OperationId = 387
7/6/2011 6:04:42 PM Microsoft-Windows-WMI-Acti… 3 Stop OperationId = 398
PS C:\Windows\system32>
Well, that is enough for a Saturday. Tomorrow, I have a great guest article by James Brundage. On Monday, I will pick up where we left off today, and we will begin to analyze the WMI trace log. For more information about using the Get-WinEvent cmdlet, refer to this collection of Hey, Scripting Guy! Blog posts.
I invite you to follow me on Twitter and Facebook. If you have any questions, send email to me at scripter@microsoft.com, or post your questions on the Official Scripting Guys Forum. See you tomorrow. Until then, peace.
Ed Wilson, Microsoft Scripting Guy


0 comments