Summary: Learn how to use Windows PowerShell to slice and dice WMI data in an easy, SQL-like fashion.
![]() Hey, Scripting Guy! Does the WMI select statement have any other clauses like SQL does? For example, can I just select top 10 * from to get a sample of the collection rather than doing a * for the entire collection?
Hey, Scripting Guy! Does the WMI select statement have any other clauses like SQL does? For example, can I just select top 10 * from to get a sample of the collection rather than doing a * for the entire collection?
—UJ
![]() Hello UJ,
Hello UJ,
Microsoft Scripting Guy Ed Wilson here. This is actually a rather common request. People see WMI queries that sort of look like Structured Query Language (SQL), and they immediately want to know if they can use other language statements instead of just the select statement.
UJ, the first thing you need to know about querying WMI is that it does not use SQL. It uses a query language called WQL (WMI Query Language). If the name WQL sort of looks like SQL, that is a good thing because WQL is sort of like SQL. And it sort of is not like SQL. WQL is actually a subset of ANSI SQL, with a few additions. The language keywords and their meanings are documented on MSDN. They are also covered in my WMI book.
So, to directly answer your question, no. WMI does not have a top keyword, a sortby keyword, or any of the other more sophisticated features of SQL. However, all is not lost because, using Windows PowerShell, it is very easy to accomplish these tasks. I simply pipe the results of the WMI query to other Windows PowerShell cmdlets.
For example, if I want to query the Win32_Process WMI class and find the top 10 processes that are creating the most pagefaults, I can use the following command (gwmi is an alias for the Get-WmiObject cmdlet; sort is an alias for the Sort-Object cmdlet; and select is an alias for the Select-Object cmdlet):
gwmi win32_process | sort pagefaults -des | select name, pagefaults -First 10
The command and associated output are shown in the following figure.
If I am concerned about reducing the amount of data that is returned by the WMI query, I can save a decent amount of space by only choosing the two properties I am displaying. This modified command is shown here:
gwmi win32_process -prop name,pagefaults | sort pagefaults -des | select name, pagefaults -First 10
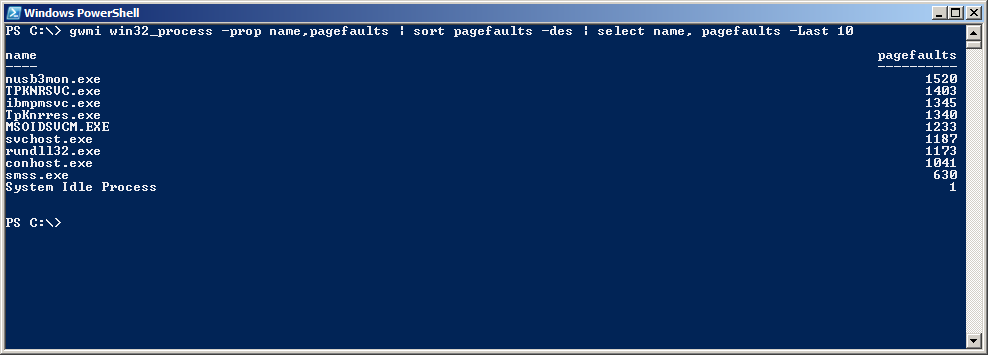
If I want to see the most efficient processes (in terms of the number of pagefaults generated), I use the last parameter of the Select-Object cmdlet instead of the first parameter. This command is shown here:
gwmi win32_process -prop name,pagefaults | sort pagefaults -des | select name, pagefaults -Last 10
The command and associated output are shown in the following figure.
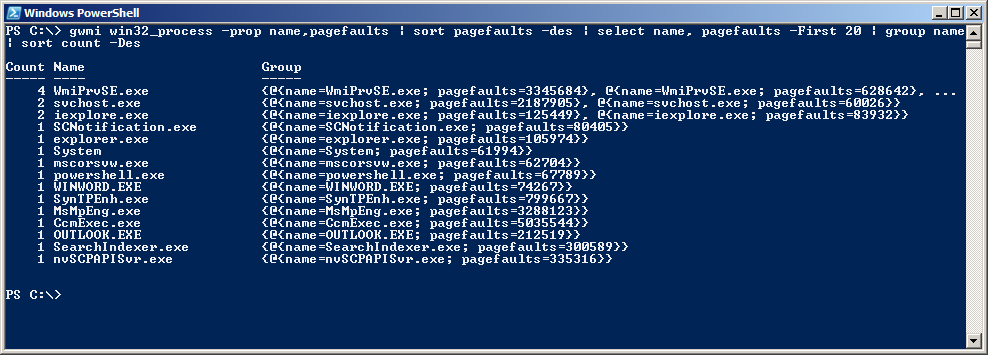
Using Windows PowerShell, some really cool queries are produced. For example, I decided I wanted to see the top 20 processes that are producing the most page faults. When I ran that command, I noticed that several processes appeared multiple times. I then decided to group by name so that I could see how many processes occupied the top 20 slot. To do this, I introduced a new cmdlet into the mix: Group-Object (the alias is group). The output was actually a bit surprising. First, my command; it is shown here:
gwmi win32_process -prop name,pagefaults | sort pagefaults -des | select name, pagefaults -First 20 | group name | sort count –Des
The command and associated output are shown in the following figure.
For the last little bit, I have been running the same WMI command over and over again. If this were a WMI command that took a decent amount of time to run, it would be much better to store the results in a variable and work through the same offline data. In fact, from a decision perspective, my data keeps changing each time I run the command. To store and process, my commands would look like the following:
$wmi = gwmi win32_process -prop name,pagefaults
$wmi | sort pagefaults -des | select name, pagefaults -First 20 | group name| sort count –Des
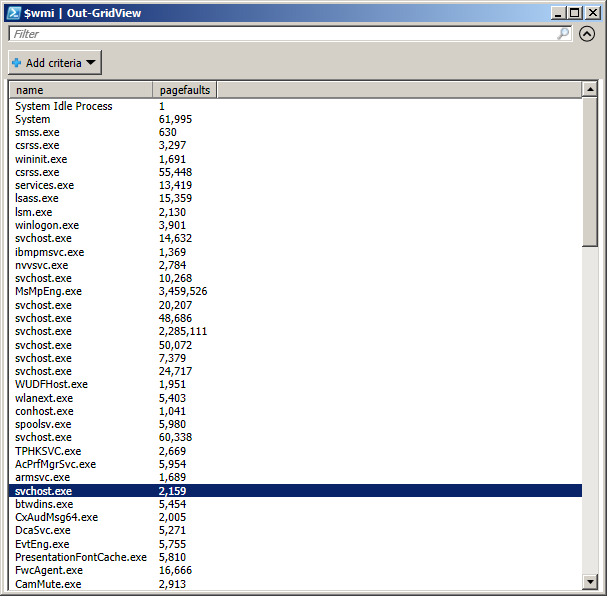
Of course, for analyzing data it is hard to beat the Out-Gridview cmdlet because it makes it really easy to add conditions that permit quick slicing and dicing. I like to pass the results through the Select-Object cmdlet to ensure I only have the data I want to examine. Here is the command I used:
$wmi = gwmi win32_process -prop name,pagefaults | select name, pagefaults
$wmi | Out-GridView
The Out-Gridview cmdlet produces a gridview tool that is shown in the following figure.
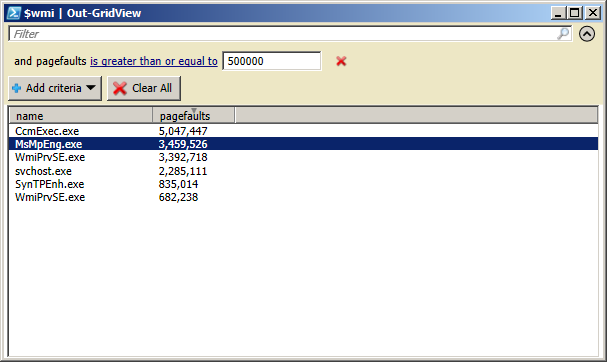
I add a criterion by clicking Add criteria and selecting the property I want to examine. Next, I choose the operator and type the value I want to see. The cool thing is that, as I type zeroes on my number, the list of processes changes dynamically. I ended up with 500,000 page faults and found six processes that had more than that number. It would have taken me a while to discover this information without using this tool. The gridview with the associated filter is shown in the following figure.
UJ, the short answer to your question is no. The longer answer is that, by using Windows PowerShell, I have an extremely powerful tool set that actually makes it easy to slice and to dice the WMI data in a very logical manner. Well, that is it for today. Join me tomorrow for more cool Windows PowerShell stuff.
I invite you to follow me on Twitter and Facebook. If you have any questions, send email to me at scripter@microsoft.com, or post your questions on the Official Scripting Guys Forum. See you tomorrow. Until then, peace.
Ed Wilson, Microsoft Scripting Guy


0 comments