Summary: Learn how to automatically import performance counters from a Perfmon chart into Windows PowerShell for ease of analysis.
![]() Hey, Scripting Guy! I have several custom Perfmon charts set up. Like many network administrators, I spent a decent amount of time setting up this chart. I would like to see if there is a way I can automatically import those counters into a Windows PowerShell script. It may sound like a goofy request, but if you saw the actual number of charts and counters, this would save me a huge amount of time. I am in the same hemisphere as you, which means it is summer: I would rather spend my time playing golf than copying Perfmon counters into Windows PowerShell scripts. My golf handicap needs your assistance. Please!
Hey, Scripting Guy! I have several custom Perfmon charts set up. Like many network administrators, I spent a decent amount of time setting up this chart. I would like to see if there is a way I can automatically import those counters into a Windows PowerShell script. It may sound like a goofy request, but if you saw the actual number of charts and counters, this would save me a huge amount of time. I am in the same hemisphere as you, which means it is summer: I would rather spend my time playing golf than copying Perfmon counters into Windows PowerShell scripts. My golf handicap needs your assistance. Please!
—YM
![]() Hello YM,
Hello YM,
Microsoft Scripting Guy Ed Wilson here. As someone who used to be a scratch golfer (at least when playing a golf simulator on my computer), I sympathize with your predicament. Actually, as someone who absolutely despises rework, I really really sympathize with your situation. I would almost be willing to say, dude (or dudette as the case may be), but you will gain so much more in productivity if you convert your Perfmon charts to Windows PowerShell scripts that it will actually be worth the effort.
Before I get too carried away, I need to tell you a little bit about the Performance Monitor tool. Perfmon is one of my favorite Microsoft tools. I fell in love with it when I was writing a chapter for the MSCE for Dummies book for the NT 4 in the Enterprise exam. I was so excited about the tool, I thought about writing an entire book about the subject; instead, I wrote a book called Network Monitoring and Analysis: A Protocol Approach to Troubleshooting.
Unfortunately, there is no really straightforward way to export counters from Perfmon. There are lots of ways to export your settings and various configurations, but no easy way to export only the settings. I will use an example to make this clear.
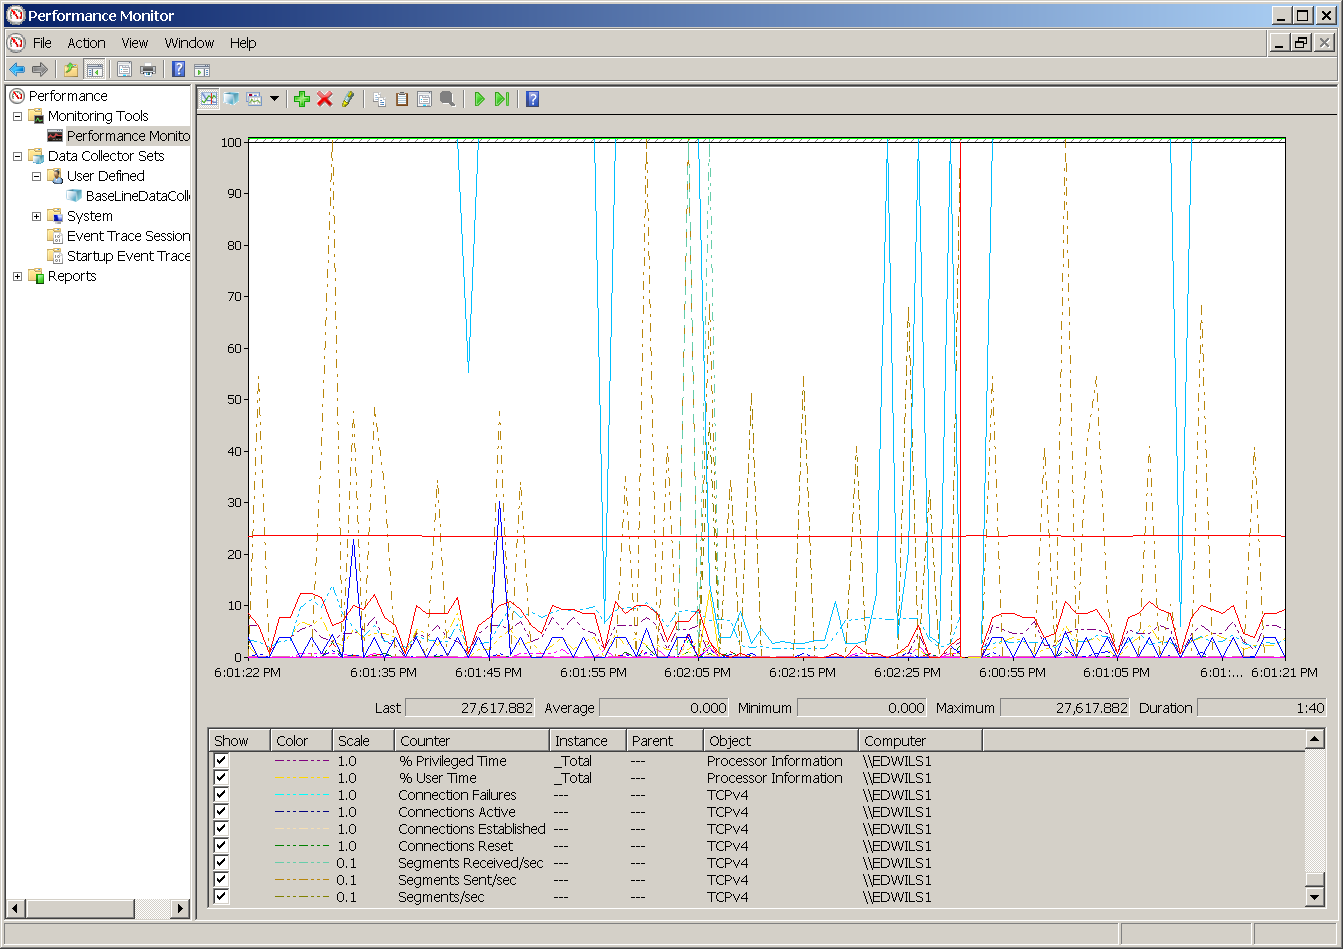
I have created a custom performance counter set, as is shown in the following figure.
I can right-click the graph portion and choose Save Counters As from the shortcut menu. The Web Page option is probably the easiest to work with.
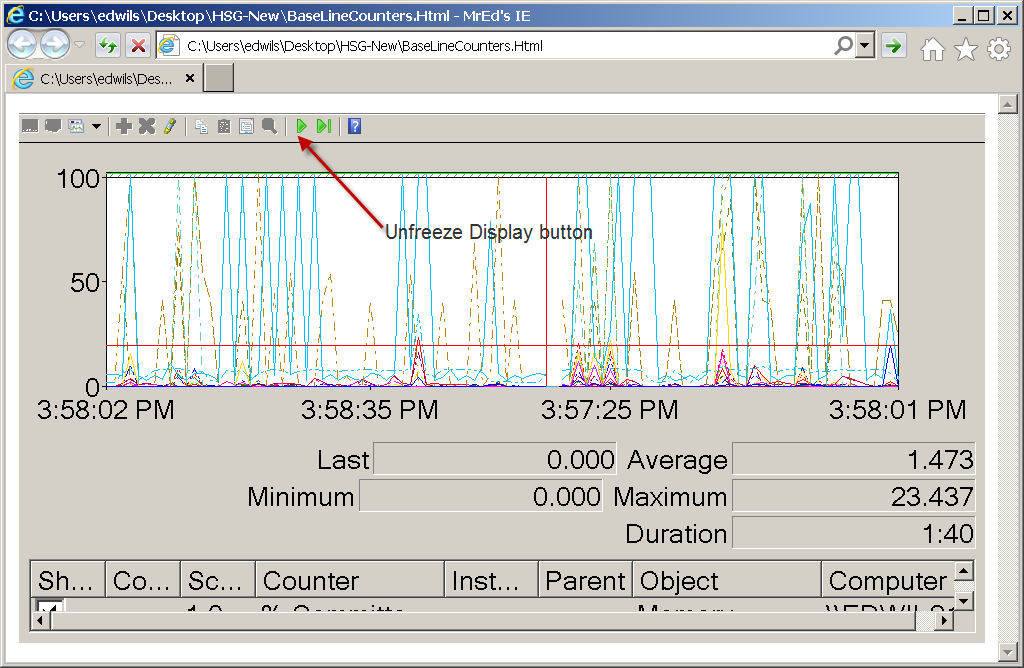
As an aside, I can open the web page in Internet Explorer, click the Unfreeze Display button, and start a new real-time trace. It is really cool, and is shown in the following figure.
To create a new data collector set from a Performance Monitor graph, right-click Performance Monitor in the left pane, and click New Data Collector Set in the shortcut menu. All the counters from the graph will automatically appear in the new Data Collector Set.
When I have a custom Data Collector Set, I can start the data collection in the log file that was configured during the creation of the Data Collector Set. I prefer the binary file type (.blg) because it imports easily via the Import-Counter cmdlet.
These steps are not necessarily something that every network administrator will need to accomplish. In fact, if you already have custom Performance Monitor charts and Data Collector Sets, there are probably already trace log files that have been created. All I need to pull the counters is a single snapshot.
Now for the fun part.
After I have a .blg file, I can use the Import-Counter cmdlet to import the log. I can then use normal Windows PowerShell techniques to parse the file and analyze the data. Windows PowerShell makes it easy to look through massive amounts of data and search for anomalies or patterns. But the specific task at hand is to use Windows PowerShell to query the same counters that are defined in the custom Perfmon trace. To do this, I provide the path to the .blg file, and I store the returned performance data in a variable. This technique is shown here:
$counters = Import-Counter -Path “C:\Users\edwilson\Perf\System Monitor Log.blg”
After I have the data stored in a variable, I can explore the contents as illustrated in the following figure.
It is obvious I am dealing with a collection, so I am able to index directly into the collection by using a square bracket and a number. Each slice will contain the same types of data (of course, the actual values will vary). As a result, I can simply index into the first element by using a zero. This technique is shown here (with truncated output):
PS C:\> $counters[0].countersamples
Path InstanceName CookedValue
\\edwils1\tcpv4\connection fai… 0
\\edwils1\tcpv4\segments/sec 0
<output is truncated … bigtime …>
The property I want is the path to the counters. I can use the Select-Object cmdlet to retrieve them and store them into a variable. This technique is shown here:
$paths = $counters[0].countersamples | % {$_.path}
Now that I have a collection of paths, I might be inclined to examine them. I can do this by displaying the value of the $paths variable. This is shown here with truncated output:
PS C:\> $paths
Path
\\edwils1\tcpv4\connection failures
\\edwils1\tcpv4\segments/sec
\\edwils1\tcpv4\connections established
\\edwils1\tcpv4\connections reset
\\edwils1\tcpv4\segments received/sec
How many paths do I have? I can use the Measure-Object cmdlet to find:
PS C:\> $paths | Measure-Object
Count : 81
Average :
Sum :
Maximum :
Minimum :
Property :
The cool thing about the Get-Counter cmdlet is I can easily pipe to it. The command and associated output are shown here (output is truncated):
PS C:\> Get-Counter -Counter $paths
Timestamp CounterSamples
7/20/2011 7:34:06 PM \\edwils1\network interface(intel[r] 82566mm gigabit network connection)\
bytes total/sec :
0
\\edwils1\network interface(local area connection* 9)\bytes total/sec :
0
\\edwils1\network interface(6to4 adapter)\bytes total/sec :
0
The complete sequence of commands required to import the performance monitor log, store the results in a variable, choose the path from the first instance of the counter samples, store the resultant custom object in a variable, and pipe the variable to the Get-Counter cmdlet to perform a query is shown here:
$counters = Import-Counter -Path “C:\Users\edwils\Desktop\HSG-New\System Monitor Log.blg”
$paths = $counters[0].countersamples | % {$_.path}
$counterData = Get-Counter -Counter $paths
I invite you to follow me on Twitter and Facebook. If you have any questions, send email to me at scripter@microsoft.com, or post your questions on the Official Scripting Guys Forum. See you tomorrow. Until then, peace.
Ed Wilson, Microsoft Scripting Guy


0 comments