
Sr. Consultant Daniel Taylor shares his thoughts about monitoring SQL Server in Azure.
Monitoring our systems is key to a healthy, predictable, and stable environment. Utilizing and understanding the tools to do this is also important. In my years as a consultant it has been my experience that teams do not actively monitor or are not as proactive as I would like them to be. On premises it is a bit more challenging and teams supporting data environments must find the time to create monitoring solutions or investigate 3rd party monitoring tools. Depending on the size of the team this can be a daunting task. Ultimately, I find teams are being more reactive than proactive and the conversation leads to how can we be more proactive?
However, if you are moving to Azure there is a light at the end of the tunnel. Microsoft has had monitoring in place since it has been providing cloud solutions. These monitoring tools however may not have covered as much as we would like or were in disparate locations making it frustrating when setting up alerting and monitoring within the environment. I am proud to say that Microsoft has made great strides in making monitoring our Azure solutions should I say fun. As an individual who focuses on more the data platform task’s I would like to share some of the monitoring I utilize when deploying Azure solutions.
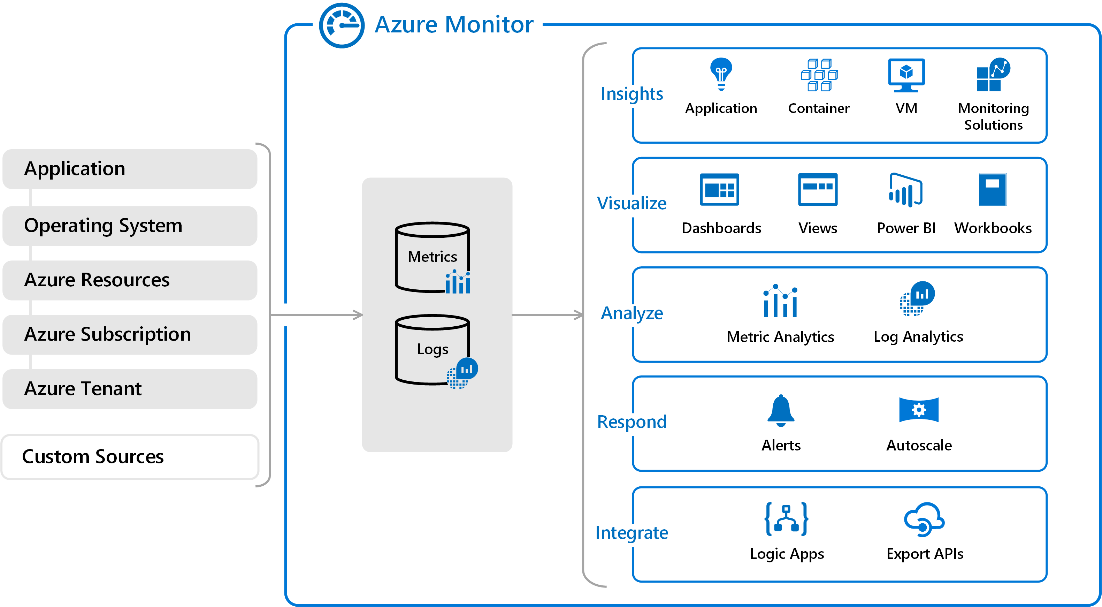
My first general recommendation is to set up Azure monitor dashboards. Azure Monitor provides us the ability to monitor many aspects of our Azure solution. In the case of our data platforms we can monitor our Azure virtual machines, storage, and our databases. Azure monitor allows us to aggregate all metric information into a single map. With Azure monitor, I like to look at the usual suspects CPU, memory, and disk utilization.
Provided is a link to a video and overview of the full capabilities of Azure Monitor
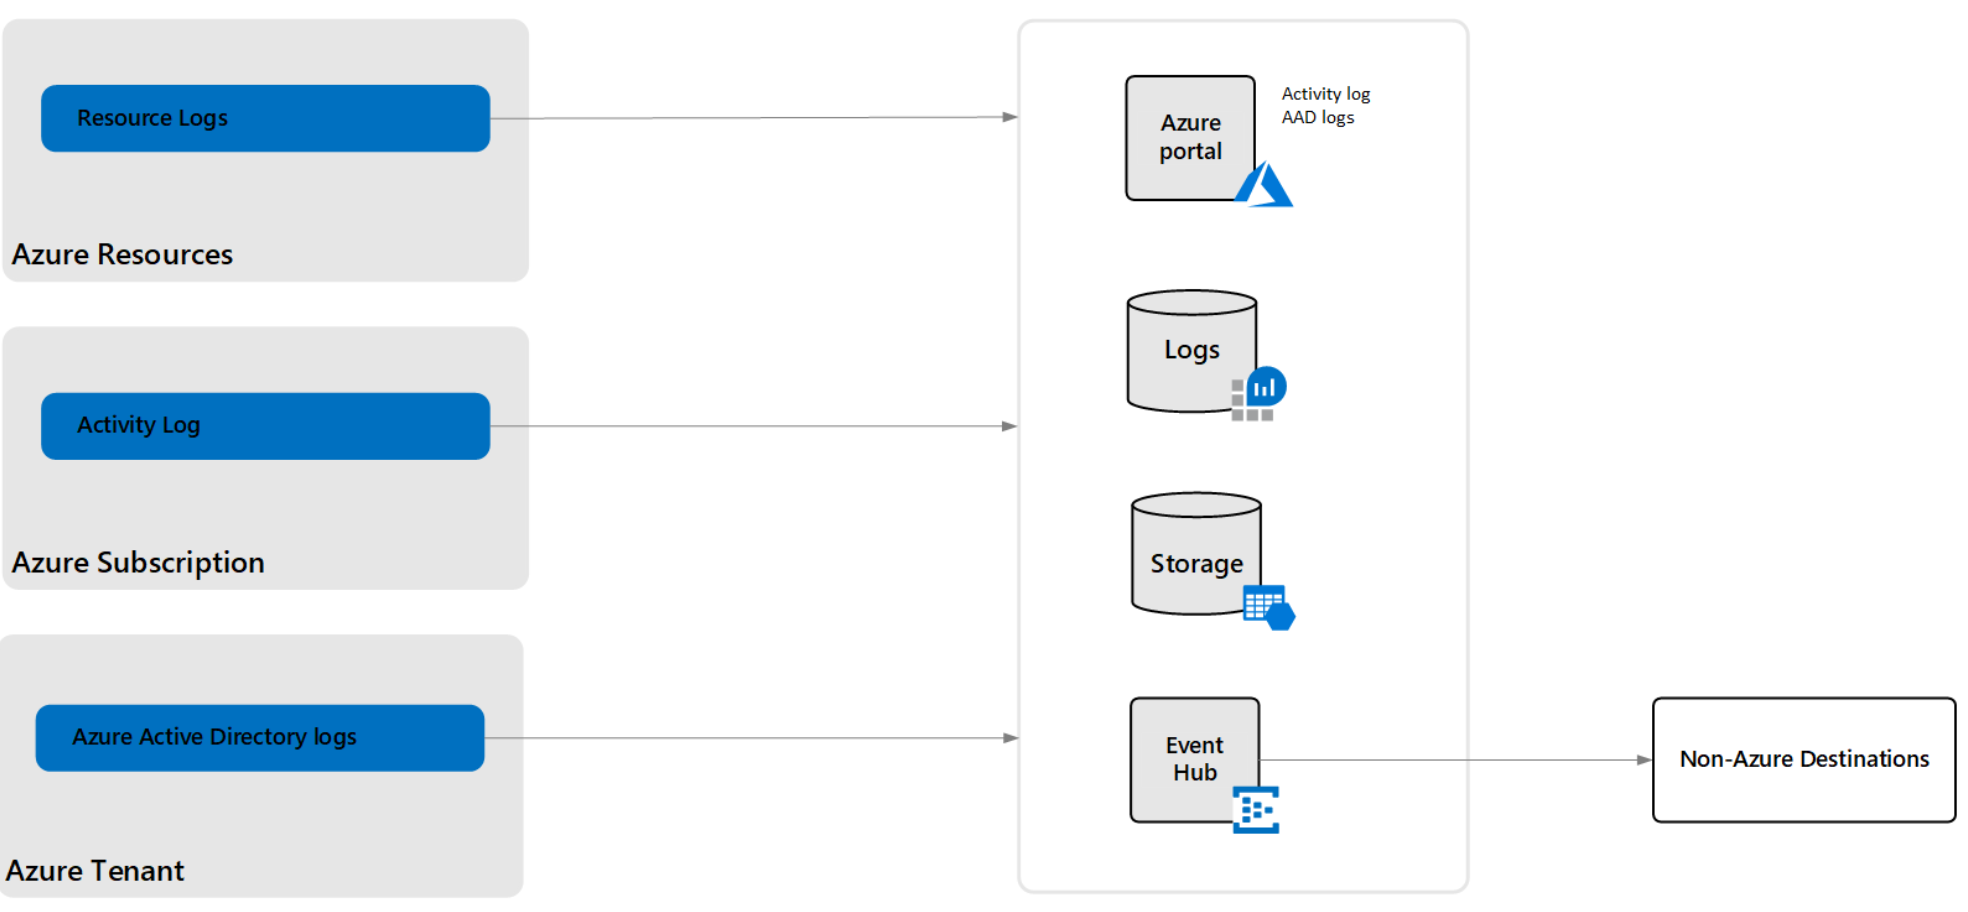
Azure provides a great view into our Azure solutions, however if we want to extend the data Azure Monitoring metrics being collected my second recommendation is to enable diagnostics. One of the primary recommendations for enabling diagnostics is that it provides telemetry beyond the 93 days Azure monitor provides. The diagnostics collected will vary by the solution/service we are collecting. Resource logs can be sent to a storage account, Event Hubs, and one of my personal favorites Log Analytics workspace. In a few clicks you can extend your collection of data and save it into an ODS for quick retrieval with the numerous pre-defined queries or write custom queries against the logs with Kusto. This data can be store indefinitely or from 1 to 365 days.
Provided is a link to a video and overview of how to extend monitoring with Diagnostic Logs
With your dashboards in place and extending monitoring to something like log analytics we can with confidence and in less time:
- Proactively monitor our data platforms such as SQL DBs, Instances, Managed Instances
- Proactively provide our teams with real time or near real time monitoring
- Proactively provide insights to events, issues, or future needs for our Azure solutions
- Proactively alert on events or performance issues by sending emails
- Proactively resolve the alerted items with automation
Your friendly @DBABulldog
Is extended events unusable in Azure SQL? I can only ever seem to start one or two EE sessions across the entire “server”.