
Dev Consultant Laurie Atkinson demonstrates how to integrate Application Insights into your Angular SPA to track page views and load times. This is a follow-up article to a previous post, https://devblogs.microsoft.com/premier-developer/add-application-insights-to-an-angular-spa
Application Insights is an Azure service for monitoring web applications. It includes analytics tools to help you understand application usage and to diagnose issues with the goal of continuously improving performance and usability. In addition to its integration with a variety of backend web platforms, Application Insights also includes browser analytics.
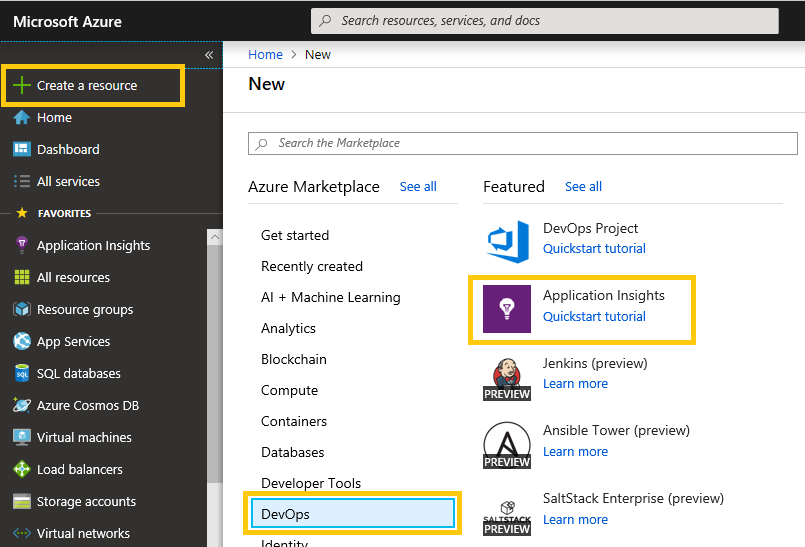
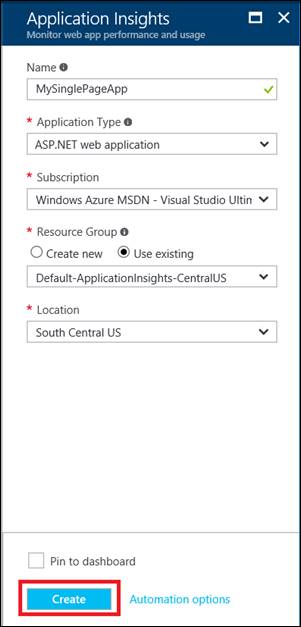
Add Application Insights through the Azure portal
Configure Angular application and include dependencies
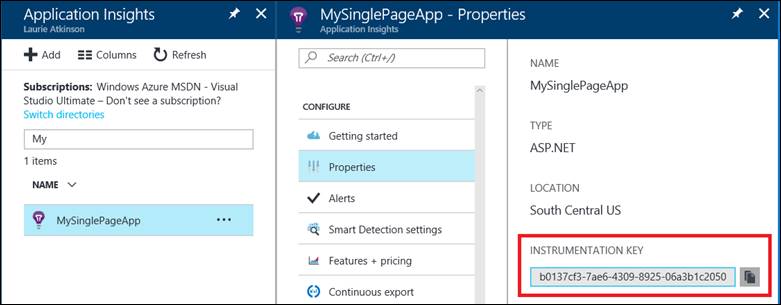
Copy the instrumentation key into the Angular application. If your key can be included in TypeScript, then the environment.ts is the place to store it.
export const environment = {
    . . .
        appInsights: {
            instrumentationKey: 'b0137cf3-7ae6-4309-8925-06a3b1c20508'
    }
};
If the key needs to be modified at deployment and not at build time, then you will need a different solution. One option is to download a JSON file containing your configuration data. Refer to this post for instructions on implementing this option.
Add two dependencies to package.json and restore them using npm install.
"dependencies": {
    "applicationinsights-js": "^1.0.20"
},
"devDependencies": {
    "@types/applicationinsights-js": "^1.0.9",
}
applicationinsights-js – JavaScript library supplied by Microsoft to interface with the Application Insights SDK. Documentation on this library is located here:
@types/applicationinsights-js – TypeScript type definition file for applicationinsights-js.
Consume the Application Insights SDK in TypeScript
Create a TypeScript class as a wrapper around the Application Insights JavaScript API and import the AppInsights class using the module loading system.
STATIC CONFIG OPTION: If the instrumentation key is stored in the environment.ts file, this class can take responsibility for downloading the app insights JavaScript library.
import { Injectable } from '@angular/core';
import { environment } from '../../../environments/environment';
import { AppInsights } from 'applicationinsights-js';
@Injectable({ providedIn: 'root' })
export class MyMonitoringService {
    private config: Microsoft.ApplicationInsights.IConfig = {
        instrumentationKey: environment.appInsights.instrumentationKey
    };
    constructor() {
        if (!AppInsights.config) {
            AppInsights.downloadAndSetup(this.config);
        }
    }
}
On creation, the service calls into the Application Insights SDK JavaScript API, which triggers the download of ai.js from a CDN. This is recommended to ensure that the latest JavaScript is running against the Application Insights API.
DYNAMIC CONFIG OPTION: If you used a dynamic configuration file instead of environment.ts, then the app insights download should be triggered at application startup.
import { NgModule, APP_INITIALIZER } from '@angular/core';
export function initializeApp(appConfig: AppConfig) { // see this post for AppConfig
    const promise = appConfig.load().then(() => {
        if (AppConfig.settings && AppConfig.settings.logging &&
            AppConfig.settings.logging.appInsights) {
            const config: Microsoft.ApplicationInsights.IConfig = {
                instrumentationKey: AppConfig.settings.appInsights.instrumentationKey
            };
            AppInsights.downloadAndSetup(config);
        }
    });
    return () => promise;
}
@NgModule({
. . .,
    providers: [
        AppConfig,
        { provide: APP_INITIALIZER, useFactory: initializeApp, deps: [AppConfig], multi: true },
    ],
    bootstrap: [
        AppComponent
    ]
})
export class AppModule { }
Track page load time
Due to the nature of a Single Page Application (SPA), page transitions do not automatically trigger logging to Application Insights. To track the user’s activity as s/he navigates from page to page, a call must be made manually to trackPageView().
Also, trackPageView() is not sufficient to log page load time. To gather this information, add methods to start and end a custom event, so that every time the user navigates to a new page, the total time can be calculated by App Insights.
One more important line of code should also be executed when the user starts navigating to a new page and that is to modify the operation id, which will allow you to group the App Insights metrics by each page. Otherwise, all page views will be associated with the same operation id.
export class MyMonitoringService {
    logPageView() {
        if (AppConfig.settings && AppConfig.settings.logging &&
            AppConfig.settings.logging.appInsights) {
            AppInsights.trackPageView();
        }
    }
    startNavigationEvent(url: string) {
        if (AppConfig.settings && AppConfig.settings.logging &&
            AppConfig.settings.logging.appInsights) {
            if (AppInsights.context) {
                AppInsights.context.operation.id =
                    window['Microsoft'].ApplicationInsights.Util.newId();
                AppInsights.context.operation.name = url;
            }
            AppInsights.startTrackEvent(url);
        }
    }
    endNavigationEvent(url: string) {
        if (AppConfig.settings && AppConfig.settings.logging &&
            AppConfig.settings.logging.appInsights) {
            AppInsights.stopTrackEvent(url, { type: 'PAGE LOAD TIME' });
        }
    }
}
If you are using a global service, that is a good place to listen for the routing events.
router.events.subscribe(event => {
    if (event instanceof NavigationStart) {
        myMonitoringService.startNavigationEvent(event.url);
    } else if (event instanceof NavigationEnd) {
        myMonitoringService.endNavigationEvent(event.url);
        myMonitoringService.logPageView();
    }
});
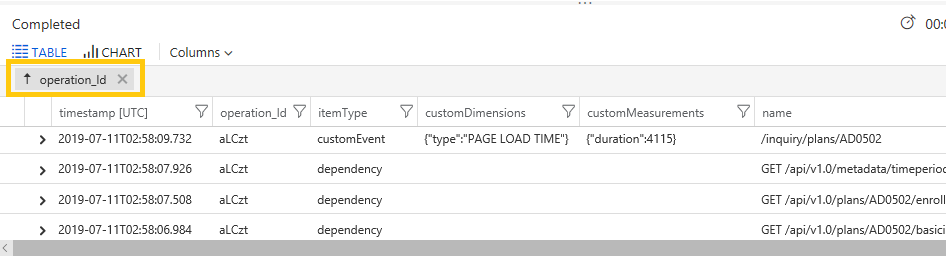
Configure query in Azure Portal to show timing
The following query includes the pageView events as well as the custom event containing the load time. Also, any AJAX requests made in route resolvers will be listed as dependencies with the same operation id.
union pageViews, dependencies, customEvents
| project operation_Id, timestamp, itemType, name, url, duration, client_Type,
          customDimensions, customMeasurements
| where (itemType == 'pageView' or itemType == 'customEvent' or itemType == 'dependency')
and (timestamp > ago(1h) and client_Type == 'Browser')
| order by timestamp desc
The results pane allows you to group by the operation_Id column.
These steps should get your application up and running with Application Insights. To read about how to use the metrics being gathered, refer to this article. And, if you want to dig deeper into the API, you can read about using custom events and metrics.
Hello, I am a bit confused here, where is this AppConfig coming from? Is that the CDN ai.js file ?
I dont see a link to AppConfig page : // see this post for AppConfig