
Release 2412.12 of PIX on Windows includes a Preview of a new implementation of the Range Details view in Timing Captures.
The initial implementation of the Range Details view allowed you to list individual data items for a given range of time. While this capability provided several basic scenarios, it was not flexible enough to support many of the analysis scenarios that PIX users have requested over the last few years.
Limitations of the current Range Details view include a limited, hard-coded set of filtering and grouping capabilities per data type. Additionally, aggregations are not provided for most of the data types. We added aggregation for a few data types, such as sampled functions and memory allocations, but even in these cases, the set of aggregation dimensions were limited and hard-coded. Finally, there is no way to bridge the gap between aggregated data and the set of individual items that are part of the aggregation.
Here are a few examples of analysis scenarios that PIX users have asked for, but that couldn’t be satisfied with the current Range Details view:
- I have a PIX event or function that performs a given task on multiple threads. For example, I have a PIX event representing my job system work, and I distribute that work across a thread pool. How can I determine the total time I spent executing jobs across all threads on which it ran?
- I’d like a way to filter the set of PIX events down to only those in which a given sample occurred. Right now, I have to select each event, and view it in the timeline to find those that have the sample I’m interested in.
- Given a callstack that results in several memory allocations, how can I find the individual allocations produced by that callstack?
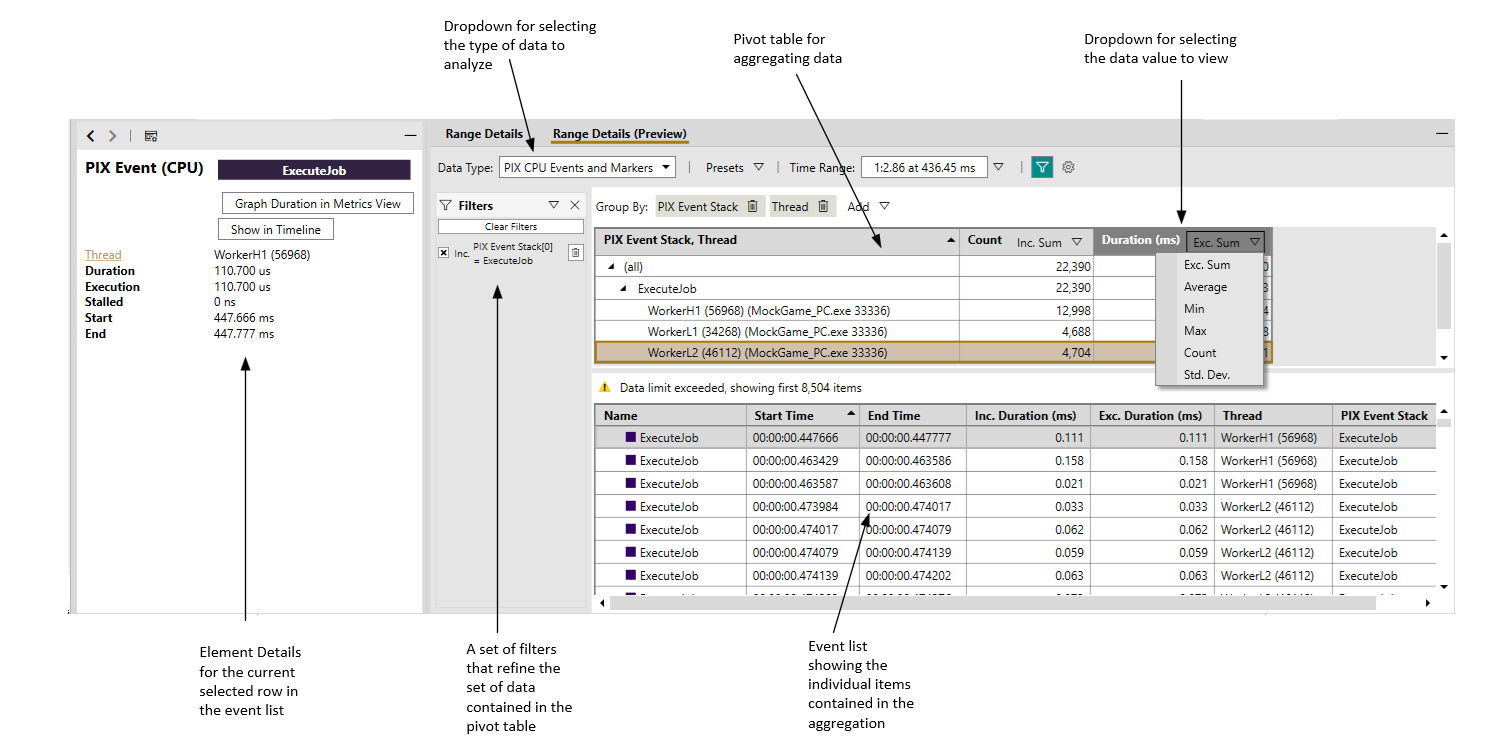
The new Range Details view is built to be flexible enough to answer these types of questions. The flexibility comes from the combination of a pivot table, an event list and a set of filters. The pivot table lets you aggregate the data on multiple dimensions, in an arbitrary order. The event list shows the individual items that make up the aggregation. Finally, filters can be used to restrict the data contained in the aggregation and the event list.
The following figure shows the primary elements of the new implementation of Range Details.
Example: Summing the durations of a PIX event across multiple threads
Using the new view, we can answer the questions posed above, starting with:
“I have a PIX event or function that performs a given task on multiple threads. For example, I have a PIX event representing my job system work, and I distribute that work across a thread pool. How can I determine the total time I spent executing jobs across all threads on which it ran?”
Start by selecting a time range, then choose PIX CPU Events and Markers from the Data Type dropdown. In this initial state, the pivot table contains an aggregation of all PIX events and markers and the event list contains all of the individual data items.
The PIX event representing a job system that is distributed across several threads is named ExecuteJob. To find ExecuteJob in the aggregation, add a pivot by PIX Event Stack by selecting that item from the Add dropdown.

The pivot table now groups all PIX events and markers by the stack in which they are contained. Next, because we’re only interested in our job system work, filter the pivot table to just the data for the ExecuteJob event. Find the event in the aggregation, then select Filter To Selection from the right click context menu.
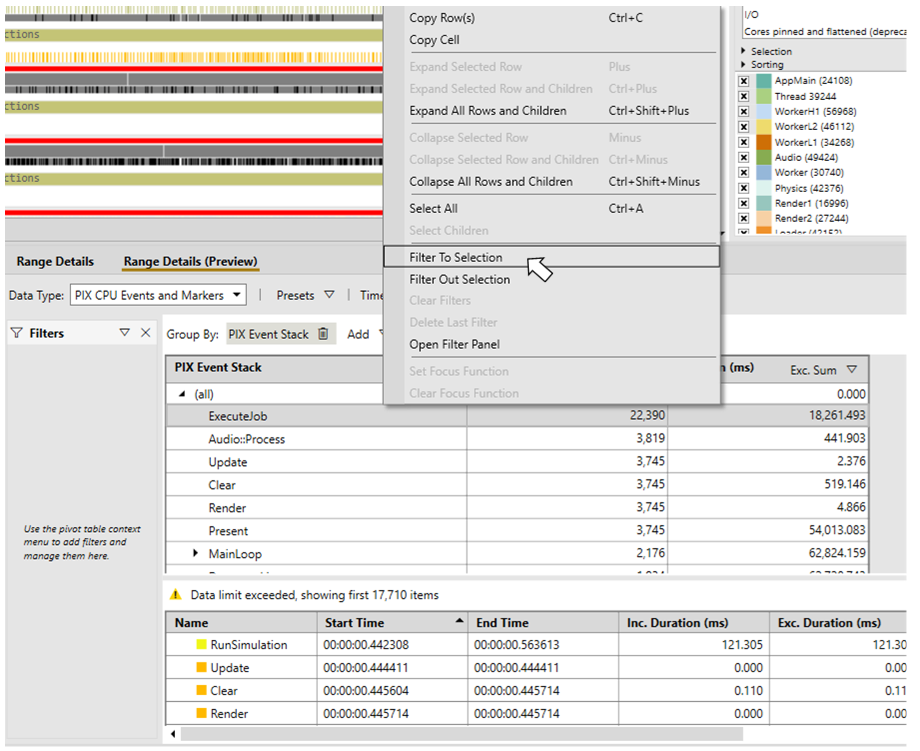
Applying the filter changes the view in three ways. First, the pivot table now contains aggregated data for only the ExecuteJob event. Second, the event details table now includes rows for all instances of ExecuteJob for the selected time range. And finally, the Filters pane now contains the filter for ExecuteJob. The Duration column shows the sum of the durations of ExecuteJob across all threads on which it ran, in this case just over 18 seconds.

To break down the instances of ExecuteJob by thread, use the Add dropdown to add another pivot, this time by thread.
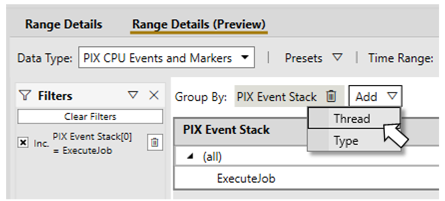
The pivot table now shows that instances of ExecuteJob ran across 3 threads: WorkerH1, WorkerL2 and WorkerL1. The Count and Duration columns show the number of instances and the sum of the durations for each thread.

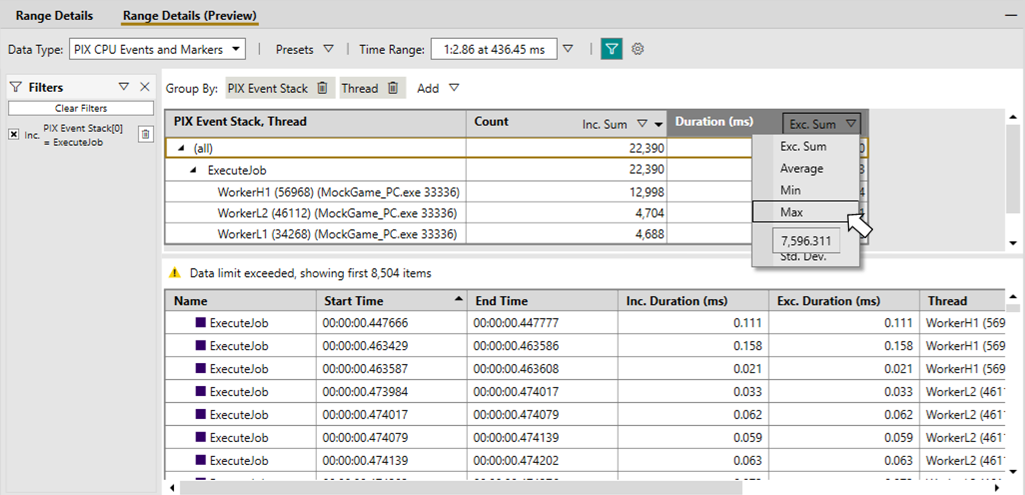
The Duration column can display other data values for the event, not just the Exc Sum. Use the dropdown on the Duration to column to view other data values, such as the Max duration of all instances, the Average duration and so on.
Finally, note that multiple filters may be used together. For example, to restrict the data further by only looking at the data for the instances of ExecuteJob than ran on WorkerH1, right click on the appropriate row in the pivot table and choose Filter To Selection.
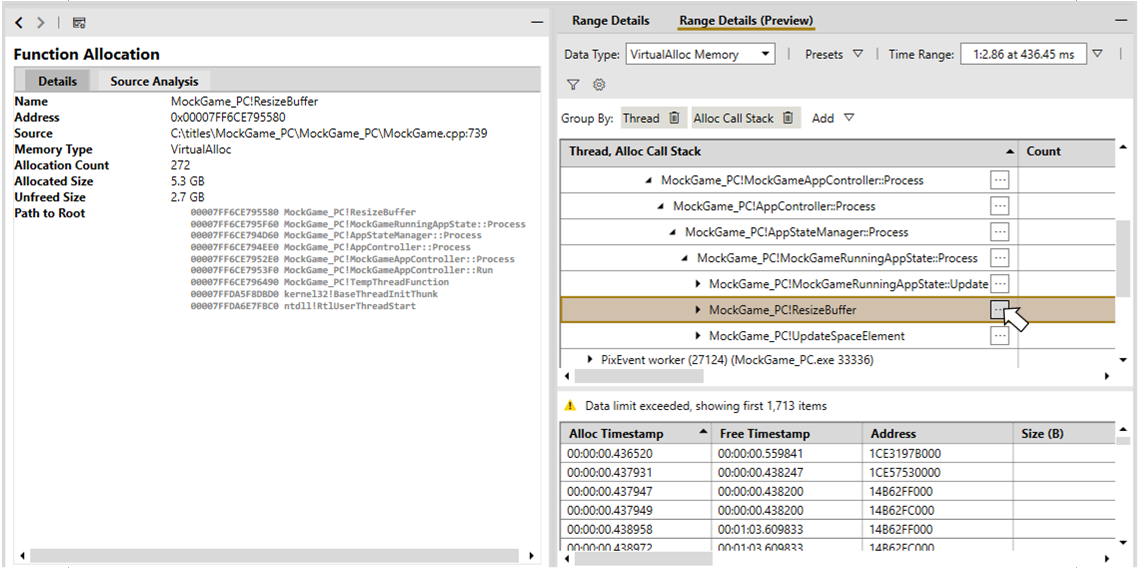
Example: Finding all PIX events in which a given sample lands
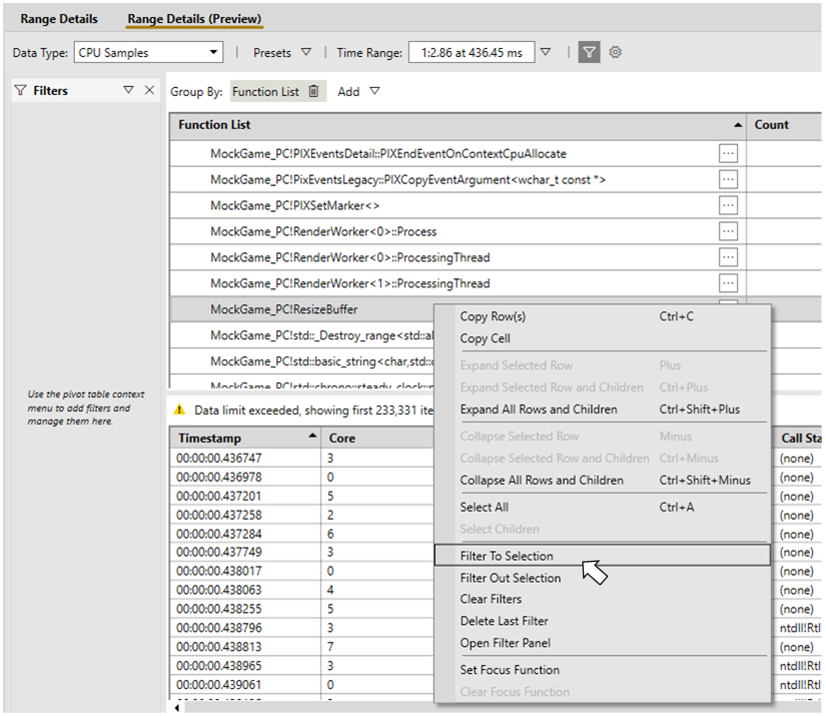
In this example, I want to find all the PIX events in which a given sampled function lands. The function I’m looking for is ResizeBuffer. To start, select CPU Samples from the Data Type dropdown and then add a pivot on Function List using the Add dropdown. Then find ResizeBuffer in the pivot table.
Note: Searching in the pivot table and the event list is not supported in this Preview. Searching capability will be added in a future release.
Filter the pivot table to just those samples that landed in ResizeBuffer by right clicking on the function and choosing Filter To Selection from the context menu.
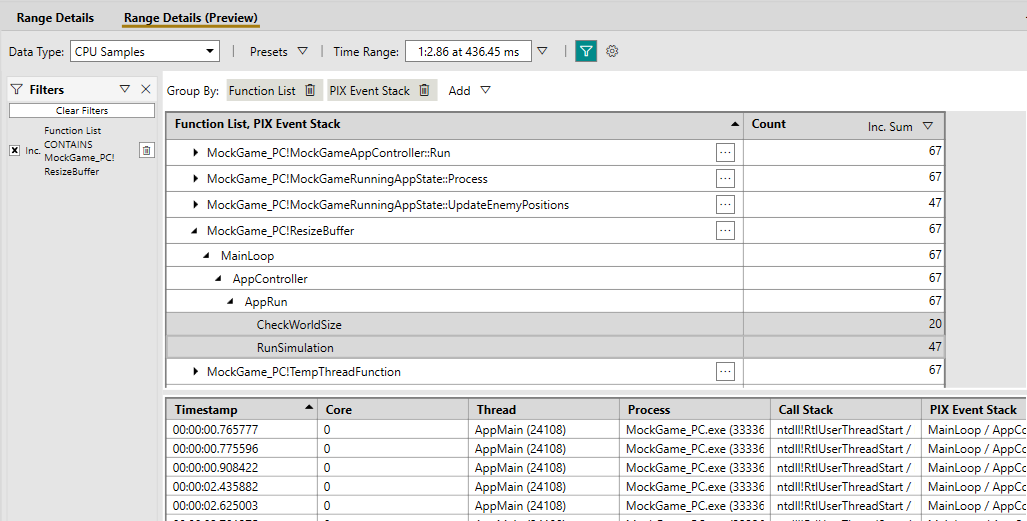
The pivot table now contains only those samples that landed in the ResizeBuffer functions or one of its callers, including all callers in the callstack. Add a pivot by PIX Event Stack using the Add dropdown the view the PIX events in which CPU samples for ResizeBuffer occurred. Looking at the PIX event stacks under the ResizeBuffer function in the pivot table shows that CPU samples that landed in the ResizeBuffer function occurred when ResizeBuffer was called from two PIX events: CheckWorldSize and RunSimulation.
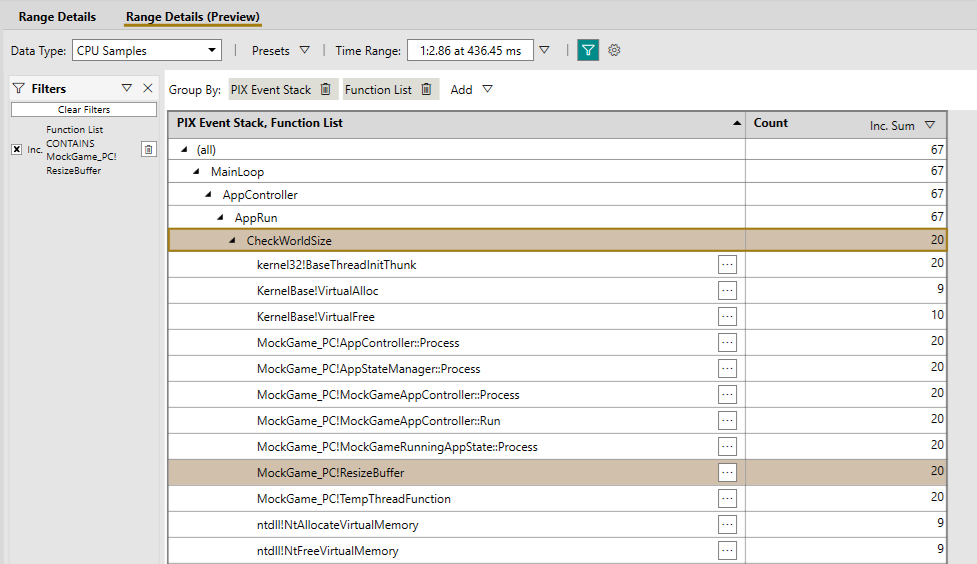
As an example of the flexibility provided by the pivot table, note that the pivots can be reversed. Rather than grouping first by Function List, then PIX Event Stack, grouping by PIX Event Stack first and then Function List shows all functions in which CPU samples landed during a given PIX event. The figure below shows the samples in ResizeBuffer that occurred within the CheckWorldSize PIX event.
Other features
Presets
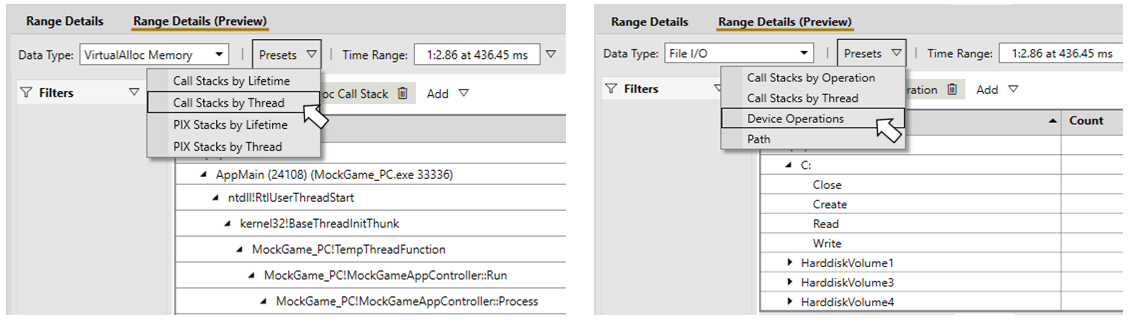
In the examples above, each dimension was added individually to the pivot table using the Add dropdown. The pivot table also offers a “preset” number of pivots for common scenarios. For example, the memory-related data types offer preset pivots based on allocation lifetime, callstacks, PIX event stacks and threads. The presets for file io data include pivots based on device, thread, file operation and so on.
Element Details and the Pivot Table
Selecting the “…” box for an entry in the pivot table populates the Element Details view with information about that level of the aggregation.
0 comments